


How to Backtest Trading Strategy: A Step-by-Step Guide
Why Your Trading Success Depends on Smart Backtesting
Here's a piece of advice many traders only learn after some painful losses: entering the market with an untested strategy is the financial equivalent of driving blindfolded. You might get away with it for a short while, but a costly mistake is almost a certainty. Smart backtesting isn't just an optional first step; it’s the bedrock of any sustainable trading career. It’s how you replace hope with hard evidence.
Beyond simply checking if your entry and exit rules work, proper backtesting builds the mental toughness you need to trade effectively. Picture this: your strategy hits an inevitable rough patch, and you find yourself down 5% in a single week. The urge to abandon your plan is powerful. But what if your backtest showed that this exact strategy survived five similar drawdowns over the last ten years and still came out ahead? That’s how you get the conviction to stick to your guns. This data-backed confidence is what truly separates disciplined traders from those who panic at the first sign of trouble.
Distinguishing Real Edge from False Confidence
Be warned: not all backtesting is created equal. A badly done test can be worse than doing no test at all, as it gives you a dangerous sense of false confidence. I’ve seen countless strategies that looked amazing on paper only to fall apart in a live trading environment. For example, a basic moving average crossover strategy might appear incredibly profitable until you account for real-world transaction costs and slippage on every trade. All of a sudden, that "perfect" system is bleeding money. The objective isn't to find a flawless past performance but a robust edge.
This is why knowing how to backtest a trading strategy correctly means getting serious about your data quality. One of the most common pitfalls is survivorship bias. This happens when your historical data only includes companies that are still around today, conveniently leaving out all the ones that went bust or got acquired. Running a simulation on this biased data will give you wildly optimistic results because it filters out the failures. Making sure your dataset includes these delisted stocks is essential for an honest look at your strategy's true potential. You can explore the finer points of avoiding bias in backtesting to dig deeper.
What a Proper Backtest Truly Reveals
A solid backtest offers so much more than a final profit number. It gives you a detailed personality profile of your strategy, showing you what to expect when your own money is on the line. Think of it as a diagnostic tool that helps you find the answers before the market forces you to learn them the hard way.
A complete analysis will show you:
- Maximum Drawdown: This is the largest peak-to-trough drop your account would have suffered. Can you really stomach that kind of loss without panicking?
- Duration of Drawdowns: How long did it take to recover from the worst losses? Some strategies can stay below their peak for months or even years.
- Win Rate vs. Risk/Reward: Are you building an account with small, frequent wins, or are you taking small losses while patiently waiting for a few huge home runs?
- Performance Across Regimes: Does your strategy only work when the market is in a full-blown bull run, or can it also navigate choppy, sideways, or bearish conditions?
Ultimately, backtesting is your chance to break your strategy in a completely safe environment. It’s about proactively finding the weaknesses, understanding the risks involved, and building genuine, data-driven confidence in your trading edge. By stress-testing your ideas against the past, you prepare yourself to face the future with a clear plan, not just a guess.
Finding Backtesting Tools That Actually Work for Real Traders
Choosing your backtesting software is the first real test of your trading journey. The market is packed with tools that promise incredible results, but the reality is that the "best" tool is the one that fits your strategy, your technical comfort level, and your goals. Picking the wrong platform can set you on a path to bad conclusions before you even place a single simulated trade.
The Coding vs. No-Code Dilemma
For most price-action traders, the easiest way in is through no-code platforms. A tool like TradingView is a fantastic example. Its visual interface lets you literally draw your strategy on a chart and watch the simulated trades play out. It’s an excellent way to validate simple, rule-based systems without touching a line of code. The downside? You're often confined to the platform's features and may find it difficult to test more complex, portfolio-wide ideas.
At the other end of the spectrum, you have coding-heavy solutions. This usually means using Python with a library like backtrader or specialized software like Amibroker. This route gives you almost total freedom to build any logic you can dream up, controlling every tiny detail of the simulation. The major trade-off is the steep learning curve. You’re not just a trader anymore; you're also a part-time developer, and that’s a commitment not everyone is willing to make.
To help you decide which path is right for you, here’s a quick comparison of some popular options and what they offer in the real world.
Essential Backtesting Platform Features Comparison
Real-world comparison of backtesting tools focusing on practical capabilities that impact your results
| Platform | Monthly Cost | Data Coverage | Learning Curve | Best Trading Style |
|---|---|---|---|---|
| TradingView | Free to ~$60 | Broad (Forex, Stocks, Crypto), historical depth varies by plan | Low | Visual, Discretionary, Rule-Based |
Python (with backtrader) |
Free (open-source) | Bring Your Own Data (limitless potential) | High | Quantitative, Systematic, Custom Logic |
| Amibroker | ~$340 (one-time) | Bring Your Own Data | Moderate (AFL language) | Systematic, High-Speed Portfolio Testing |
| MetaTrader 5 | Free | Broker-dependent (mostly Forex & CFDs) | Moderate (MQL5 language) | Algorithmic Forex & CFD Trading |
As you can see, the "best" tool really depends on what you're trying to achieve. There's no single right answer, only the right fit for your specific needs.
Key Features That Genuinely Matter
No matter which platform you choose, some features are simply non-negotiable. First and foremost is data quality. Your backtest is only as good as the data it runs on. A great tool must provide clean historical data that's already adjusted for things like stock splits and dividends. The ability to import your own datasets is also a massive advantage, freeing you to test niche assets the platform might not cover.
Next, you have to demand realistic cost modeling. A backtest that doesn't account for transaction fees and slippage—the small price difference between when you place an order and when it actually fills—is just an exercise in fantasy. Even a tiny slippage of 0.05% on each trade can completely wipe out the profits of a frequent trading strategy. Your software must allow you to factor in these real-world costs.
Finally, the report at the end is where the real learning begins. A simple profit curve is not nearly enough information. You need a detailed breakdown, including key performance metrics like the Sharpe ratio (which measures risk-adjusted return), maximum drawdown (the biggest drop from a peak to a trough), and your longest streak of consecutive losses. These numbers tell you about the strategy’s personality—the journey you’ll have to endure, not just the final destination.
Is It Worth Paying for a Backtesting Tool?
You absolutely do not need to spend a lot of money when you're getting started. Many excellent platforms have free tiers that are more than powerful enough for you to validate your initial ideas and get comfortable with the entire process. In fact, you can get very far without spending a dime; we have a detailed guide on how to backtest a trading strategy for free.
Paying for a premium solution makes sense when your needs become more advanced. This typically happens when you need to test over much longer periods—think 20+ years of data to see how a strategy holds up through multiple recessions and bull markets—or when you want to run highly complex simulations across a huge basket of assets. At that point, a subscription is an investment in higher-quality research that ultimately saves you an immense amount of time.
Building Your Data Foundation Without Common Mistakes
Your backtesting platform is only as good as the data you feed it. I’ve seen it time and again: a trader builds what looks like a money-printing strategy, only to see it fall apart in live trading. The number one culprit is almost always poor-quality data. Think of it as putting dirty fuel in a Ferrari—you simply won’t get the performance you expect.
Matching Your Data's "Zoom Level" to Your Strategy
The first choice you'll make is about data granularity, which is basically the "zoom level" on your price chart. Daily data gives you a bird's-eye view, showing the open, high, low, and close for each day. Intraday data (like 1-hour or 5-minute bars) brings you closer to the action, and tick data puts you on the ground, recording every single trade.
Your strategy’s timeframe dictates which one you need. If you're building a long-term portfolio that you rebalance every quarter, daily data is more than enough. It's easier to handle and gets the job done. But if you’re a day trader trying to scalp the first 30 minutes of the market open, daily data is useless. It’s completely blind to the price movements your strategy relies on, making any backtest results pure fiction. For that, you need 1-minute or 5-minute data at the absolute minimum to test your idea.
The “Silent Killers” in Your Historical Data
Raw price data straight from the source can be a minefield. Before you run a single simulation, you have to be sure your data is "clean." This means it's been adjusted for corporate actions—events that change a stock's price but not its underlying value. Skipping this step can make a winning strategy look like a loser, or even worse, make a flawed strategy look like a genius move.
These are the adjustments you absolutely cannot ignore:
- Dividend Adjustments: When a company pays a dividend, its stock price mechanically drops by the dividend amount on the ex-dividend date. Without an adjustment, your backtest sees this as a real loss. For a strategy holding dividend-paying stocks, this error compounds over years, dramatically understating your real total return.
- Stock Split Adjustments: A stock is trading at $100 and undergoes a 2-for-1 split. Its price instantly becomes $50, but your investment's value is unchanged. An unadjusted dataset interprets this as a catastrophic 50% crash overnight. This could trigger false sell signals and completely distort your performance metrics.
- Delisted Securities: This goes hand-in-hand with avoiding survivorship bias. A complete dataset must include the market's "ghosts"—companies that went bankrupt or were acquired. If your strategy could have bought a stock that eventually went to zero, you need to see that painful loss in your backtest results. Clean data includes these failures, offering a brutally honest picture of your strategy's true risk.
Where to Get Your Data and How to Trust It
You generally have two options for sourcing data: your broker or a dedicated data vendor. Data from your broker is often free, but in my experience, it can have gaps or miss adjustments for older corporate actions. Professional data vendors will charge you, but you're paying for peace of mind—a clean, comprehensive, and reliable dataset.
Ultimately, high-quality historical data is the cornerstone of a meaningful backtest. It lets you see how your strategy would have weathered different market storms without putting any real money on the line. For instance, using detailed intraday data can provide granular insights into how a strategy would have performed during specific events or times of day. You can discover more about high-quality data sources here.
Here's a simple sanity check I always recommend: spot-check your data. Pull up a chart from a trusted source, like TradingView or your brokerage platform. Pick a few dates with major market events, like the Flash Crash in 2010 or the COVID-19 plunge in March 2020. Does your data for a major ETF like SPY or a stock like Apple match the price action on the chart? This quick check can save you from weeks of wasted effort on a corrupt dataset and ensures your backtesting starts on a solid footing.
Creating Your First Real-World Backtest
Now that your data is clean and ready, it's time to get practical. This is where we stop talking theory and actually build a backtest that mirrors how markets truly behave. It all begins by taking a vague trading hunch and turning it into a set of iron-clad rules that a machine can follow without fail.
Defining Your Strategy's DNA: The Rules of Engagement
Let's imagine we're working with a simple momentum idea: "I want to buy strong stocks that are trending up." That's a decent start, but a computer needs specifics. What does "strong" mean? When do we get out? A backtest forces you to answer these questions with total clarity. Here's how we could translate that idea into concrete rules:
- The Universe: We’ll stick to stocks in the S&P 500. This keeps us in highly liquid names with good data.
- The Entry Signal: We’ll buy a stock when it’s trading above its 200-day moving average (our filter for a long-term uptrend) AND it just hit a new 3-month high (our momentum trigger).
- The Exit Signal: We’ll sell the position if the stock closes below its 50-day moving average. This is a shorter-term signal to help us lock in profits or cut a losing trade before it gets worse.
- Risk Management: A hard stop-loss is non-negotiable. We'll set ours at 10% below our entry price. If that price is hit, we're out of the trade, period.
These rules are now totally unambiguous. There’s no more room for "I feel like…" which is one of the most common and fatal mistakes traders make. You've officially created a testable hypothesis.
Modeling Real-World Friction: Costs and Slippage
A backtest without costs isn't a backtest—it's a fantasy. Every single trade you make has costs that chip away at your returns. Forgetting this is a primary reason why strategies that look amazing on paper fall apart in the real world. You have to factor in:
- Commissions: This is your broker's fee for the trade. We’ll use a conservative $1 commission for every transaction.
- Slippage: This is the small price difference between where you think you'll get filled and where you actually do. For liquid S&P 500 stocks, modeling 0.05% slippage per trade is a realistic starting point.
This workflow is about defining your rules and parameters first, then running the simulation.
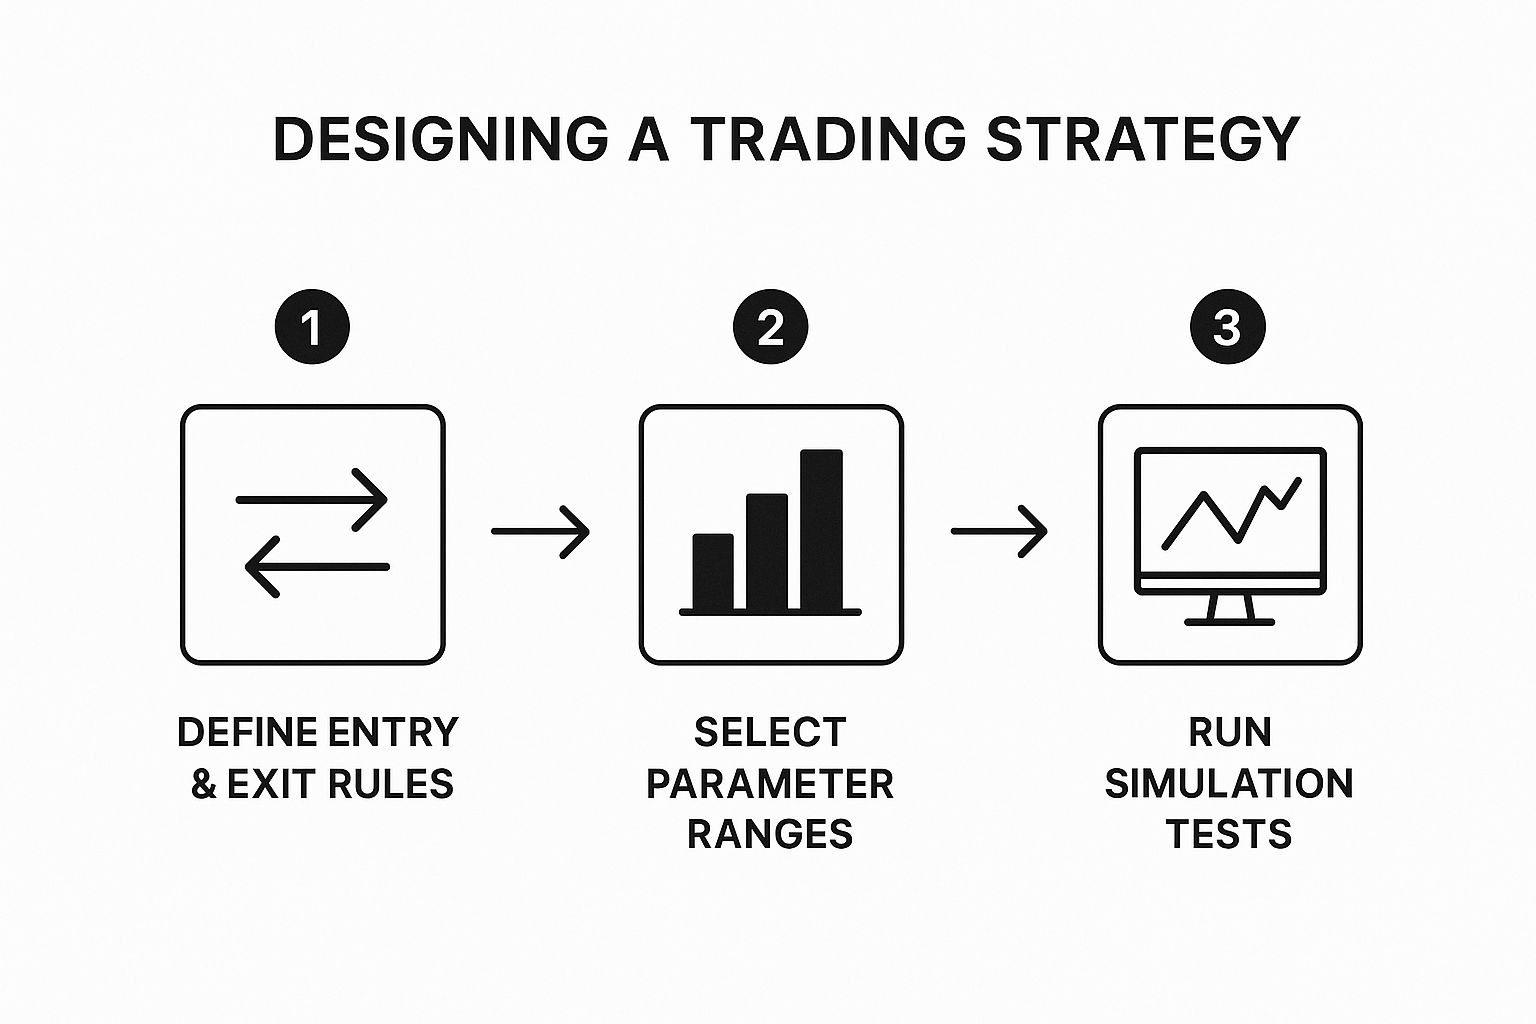
This diagram shows why it’s so important to define everything before you click "run." It prevents you from tweaking the rules halfway through just to make the results look better.
Executing the Simulation and Sizing Your Bets
With your rules defined, you can now feed them into your backtesting software. For many traders, a visual platform is the best place to start. A platform like TradingView can plot your hypothetical entries and exits right on the price chart, which is incredibly helpful.
You get instant visual feedback, seeing where the strategy would have told you to buy (blue) and sell (red). The "Strategy Tester" pane at the bottom gives you the hard numbers that tell the real story. But before we get to that, there's one last crucial decision: how much to bet.
A great rule of thumb is to risk a fixed percentage of your account on any single trade. For this example, let's say we decide to risk only 1% of our total equity per position. Since our stop-loss is 10% away from our entry, we would allocate 10% of our portfolio to that trade (1% risk / 10% stop-loss = 10% position). This method automatically reduces your bet size during a losing streak, which is a powerful way to protect your capital when the strategy is struggling.
By combining precise rules, realistic costs, and disciplined risk management, you've built a robust backtest that can give you meaningful results. Now, you’re finally ready to analyze the performance metrics and judge its true potential.
Interpreting Results Like a Professional Trader
So, your backtesting software just finished its run and spat out a report. It's tempting to zero in on that big, shiny total profit number, isn't it? But here’s a secret from seasoned traders: that number is often the least important part of the puzzle. A great backtest isn't about proving you could have been rich; it's about understanding the personality of your strategy and, more importantly, whether you can handle its mood swings in the real world.
The real skill in learning how to backtest a trading strategy lies in understanding the risk metrics. A system that promises massive gains but comes with gut-wrenching drawdowns is just a fast track to blowing up an account. I'd much rather trade a strategy with more modest returns but a smooth, steady equity curve. That's the kind of thing you can build a career on. It's all about striking a balance that lets you sleep at night when real money is on the line.
The Metrics That Truly Matter
Let's move past the vanity metrics. We need to focus on the numbers that reveal the true character of your strategy—its risk-adjusted performance and its ability to weather storms. These metrics tell you whether your profits are the result of a real edge or just a consequence of taking on way too much risk. To help with this, I've put together a table of the key metrics I always check first.
Critical Performance Metrics for Trading Strategy Evaluation
Key metrics every trader needs to evaluate strategy viability with realistic benchmarks and red flags
| Metric Name | What It Reveals | Target Range | Red Flag Levels |
|---|---|---|---|
| Max Drawdown | The largest peak-to-trough drop in equity. This is the pain you would have had to endure. | < 20% | > 30% |
| Sharpe Ratio | Measures your return per unit of risk (volatility). The higher, the better. | > 1.0 | < 0.5 |
| Profit Factor | Gross profit divided by gross loss. Shows how much you make for every dollar you lose. | > 1.75 | < 1.25 |
| Average Trade | The average profit or loss of all trades. Needs to be high enough to cover costs and slippage. | Well above commission/slippage | Barely profitable |
Looking at these numbers together gives you a much clearer picture. A high Profit Factor is great, but not if it comes with a crippling Max Drawdown. A strategy that passes muster across all these metrics is far more likely to be a reliable performer.
Gauging the Journey, Not Just the Destination
Your equity curve isn't just a final score; it’s a map of the emotional rollercoaster your strategy would have put you through. The most critical point on that map is the maximum drawdown. Let's be real: a strategy that makes 30% with a 5% max drawdown is infinitely better than one promising 300% with a 60% max drawdown. Why? Because you can actually survive the first one. The second one will almost certainly cause you to abandon the strategy long before you see any of those huge gains.
Ask yourself this, and be honest: could you stomach watching your account value drop by the max drawdown percentage and still have the discipline to place the next trade? If the answer is no, then that strategy isn't for you, no matter how profitable it looks on paper. You also need to consider the duration of drawdowns. How long was the strategy stuck in a losing streak before hitting a new equity high? A system that's underwater for years can be mentally exhausting, even if it eventually turns a profit.
Is Your Edge Real? Spotting the Red Flags
Sometimes, a backtest that looks too good to be true is exactly that. An amazing result can actually be a huge red flag pointing to a serious problem: over-optimization. This is a trap, also known as curve-fitting, where you've tweaked your strategy's parameters so much that it perfectly matches the past data but has no real predictive ability for the future.
Be on the lookout for these classic warning signs:
- A Perfect Equity Curve: Real trading edges are messy. They have ups and downs. A perfectly straight, upward-sloping line is a fantasy and a massive red flag.
- Too Many Rules: A strategy with a dozen complicated rules and filters is often a product of curve-fitting. The most robust strategies I've seen are usually built on simple, clear logic.
- Performance Cliff: If the strategy's performance falls off a cliff the moment the backtest period ends, it was probably just a statistical fluke, not a real edge.
The best way to fight this is to stress-test your results. Run the same strategy on different market data or time periods and see if the performance holds up. A truly solid strategy will show a consistent edge, even if the numbers aren't identical. That's how you know you've found something real, not just a product of luck.
Sidestepping the Traps That Destroy Trading Accounts
Running a backtest is one thing, but actually trusting the results is a completely different ballgame. I've seen countless traders, both green and seasoned, fall into subtle traps that make a terrible strategy look like a goldmine on paper. These mistakes don't just give you a misleading report; they build a false sense of confidence that gets accounts obliterated in live market conditions.
The Silent Killer: Look-Ahead Bias
Let me paint a picture. You’re testing a day-trading strategy with a simple rule: "If a company's earnings beat expectations, buy the stock at the market open." You run the backtest, and the results are incredible. But there's a fatal flaw: that earnings data often gets released after the market closes. Your simulation was using information that you couldn't possibly have had at the time of the trade. This is look-ahead bias, and it's one of the most common ways to fool yourself.
It’s the equivalent of watching a replay of a football game and then placing a bet on the team you already know won. It’s cheating. This bias can be incredibly sneaky, like using the day's closing price to calculate an indicator that supposedly gave you a signal to buy that morning. You’re peeking into the future to inform your past decisions. Always, always ask yourself: "Would I have known this exact piece of data at the precise moment my trade signal fired?" If the answer is anything but a hard "yes," your backtest is worthless.
The Seduction of Curve Fitting
Another huge pitfall is curve fitting, which is also called over-optimization. This is what happens when you endlessly tweak your strategy's parameters until they perfectly match the historical data you're testing on. The problem is, this perfectly tailored strategy almost always falls apart when it sees new, live data. It's like tailoring a suit to fit a specific mannequin so perfectly that it won't fit any actual person.
Here’s how it typically goes down: your first backtest is just okay, so you change your moving average from 50 days to 47. A little better. You adjust your RSI exit from 70 to 73.5. Better still. You add a filter so it only trades on Wednesdays. Suddenly, your equity curve is a beautiful, smooth line going straight up. You haven't found a holy grail; you've just forced your strategy to memorize the past. A dead giveaway of curve fitting is overly specific, nonsensical rules. A strong strategy works with general, logical principles, not hyper-specific ones that feel like they were cherry-picked.
Staying Honest and Stress-Testing Your Idea
So, how do you stop yourself from drinking your own Kool-Aid? The secret is to validate your results with data your strategy has never seen before. This is where you separate the real strategies from the imposters.
- Out-of-Sample Testing: This is the gold standard. Split your historical data into two chunks. Build and fine-tune your strategy on the first part (the "in-sample" data, maybe from 2015-2020). Then, without touching a single rule, run the final strategy on the second part (the "out-of-sample" data, from 2021-2023). If its performance tanks, you likely have a curve-fit system that isn't robust.
- Walk-Forward Analysis: This is a more dynamic version where you continuously test on rolling blocks of data. It's a great way to mimic how you would actually trade over time, constantly adapting to new information.
- Keep It Simple: My personal advice is that the most durable strategies are often the simplest. A system built on three solid rules is almost always more dependable than one with fifteen specific and convoluted conditions.
In the end, backtesting is an exercise in intellectual honesty. Your goal isn't to generate a perfect report but to find the truth about your strategy—the good, the bad, and the ugly. Every weakness you uncover in a backtest is a potential loss you avoid in the real world. This process is a foundational element for sound trading, and you can learn more about how this connects to keeping your capital safe in our guide on risk management. Embracing this mindset is non-negotiable before you risk a single dollar.
Making the Leap to Live Trading With Confidence
You've done the hard work, you've crunched the numbers, and your backtest looks fantastic. But the final step isn't about data—it's about you. This is the moment where theory meets reality, and translating that simulated success into actual profit is where even seasoned traders can get tripped up. Real money and raw emotions are now part of the equation. Your backtest is an excellent map, but you're the one who has to navigate the terrain.
Bridging the Gap: From Simulation to Reality
The biggest trap traders fall into is going all-in from day one. Instead, you need to ease into the water. A great way to do this is by starting with a much smaller position size, maybe just 25% of what your backtested model suggests. This immediately lowers the financial and emotional stakes, giving you room to breathe and get used to the very real pressure of having your own money on the line. The goal here isn't to get rich overnight; it's to prove you can execute your plan like a machine.
Before you even risk a single dollar, try paper trading your strategy in real-time for a couple of weeks. This is called forward-testing, and it's a crucial dress rehearsal. It validates your ability to spot and act on signals as they happen, which is a completely different skill from analyzing historical charts. From your very first trade—paper or real—you must keep a detailed trading journal. This journal is now your most important performance report.
When Live Performance Doesn't Match the Backtest
Sooner or later, it will happen: your live results will start to diverge from your backtest. This is perfectly normal. The market is a living, breathing entity, and no simulation can capture its every whim. The difference between a successful trader and a failed one is how they react. The gut reaction is to panic and ditch the strategy at the first sign of a drawdown. You have to resist that urge.
Instead, put on your detective hat. Your trading journal is your first piece of evidence.
- Audit Your Trades: Did you follow your rules to the letter? Or did a moment of hesitation cause you to enter late, or did you let a losing trade run past its stop-loss because you "felt" it would turn around? Be brutally honest with yourself.
- Analyze Market Conditions: Has the market's personality changed since you ran your test? If your strategy was tested in a low-volatility, trending environment and you're now trading in a choppy, sideways market, you can't expect the same results.
- Check Your Costs: Are real-world slippage and commissions higher than what you modeled in your backtest? These small amounts are "hidden" costs that can seriously damage a strategy's profitability, especially for frequent trading systems.
The Psychology of Real Money
There's one variable that no backtest can ever fully account for: you. The whole process of learning how to backtest a trading strategy is designed to build the data-driven confidence you need to overcome your own worst instincts. Seeing a real-time P&L number fluctuate triggers powerful emotions like fear and greed that simply don't exist in a simulation. The pain of a losing streak feels ten times worse when it’s your hard-earned capital on the line.
This is where your discipline becomes the bridge between your plan and your profits. You have to trust the rigorous work you put in. Trust the drawdown data you uncovered during your testing. That data-backed confidence is your anchor in an emotional storm, giving you the strength to execute with the consistency required for long-term success.
Ready to build strategies with this level of confidence? At Colibri Trader, we focus on proven price action techniques that give you a real edge. Start your journey and transform your trading today.