


How to Backtest a Trading Strategy: Step-by-Step Guide

The Foundation: Understanding Backtesting That Actually Works
Backtesting a trading strategy is vital. It's a continuous process that sets apart consistently profitable traders from those chasing short-term gains. This process involves rigorously testing a strategy using historical data to gauge its potential in live markets. Surprisingly, most backtests fail, not because of flawed strategies, but due to fundamental misunderstandings of effective testing procedures.
Hypothesis-Driven vs. Data Mining
A key element of successful backtesting is understanding the two primary approaches: hypothesis-driven testing and data mining. Hypothesis-driven backtesting starts with a specific market assumption, or hypothesis. For example, a trader might hypothesize that stocks breaking above their 52-week high tend to keep rising.
This hypothesis is then rigorously tested against historical data. Data mining, conversely, involves sifting through market data to find recurring patterns. These patterns can then be formulated into a trading strategy. This approach requires careful validation across different datasets and time periods to avoid overfitting. Overfitting occurs when a strategy performs well on historical data but poorly in live trading.
Backtesting often involves both approaches. You can learn more about backtesting approaches. For example, a hypothesis about a 5-year trend might be initially 75% effective, then further optimized to 85% by using data mining techniques. This allows for the identification of subtle, yet supporting patterns.
To further illustrate the differences between these two approaches, let's take a look at the following comparison table:
Backtesting Approaches Comparison
This table compares hypothesis-driven and data mining approaches to backtesting.
| Approach | Starting Point | Process | Advantages | Limitations | Best For |
|---|---|---|---|---|---|
| Hypothesis-Driven | Specific market assumption (hypothesis) | Test hypothesis against historical data | Focused, reduces overfitting risk | May miss unexpected patterns | Testing existing beliefs, refining established strategies |
| Data Mining | Raw market data | Search for patterns, then formulate a strategy | Can uncover hidden relationships | Prone to overfitting, requires extensive validation | Discovering new strategies, identifying market inefficiencies |
As the table highlights, each approach has its own strengths and weaknesses. Hypothesis-driven testing provides a focused approach, minimizing the risk of overfitting. However, it might overlook unforeseen patterns. Data mining, while powerful for uncovering hidden relationships, is more susceptible to overfitting and requires thorough validation.
Interpreting Backtesting Metrics
Analyzing backtesting results requires careful consideration. Looking at overall profit or win rate alone is insufficient. A thorough assessment involves examining a range of metrics. Some key metrics to consider include win rate, average return per trade, and maximum drawdown. Examining these metrics allows you to understand the risk-reward profile of the strategy.
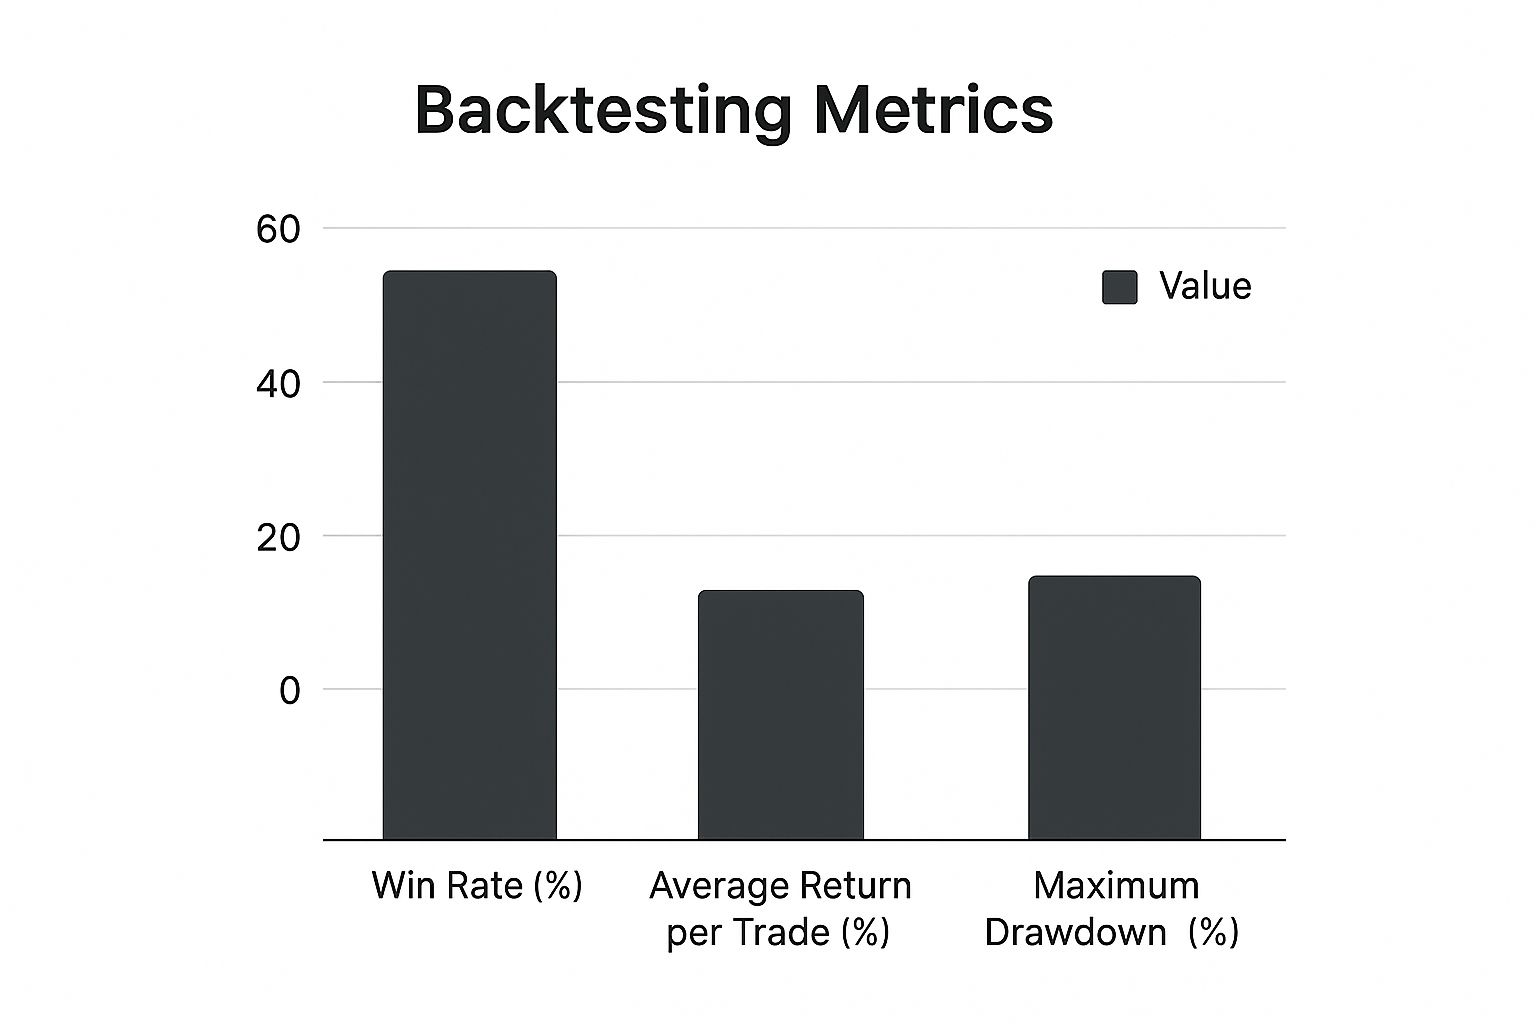
This infographic visualizes the comparison of three key backtesting metrics: Win Rate, Average Return per Trade, and Maximum Drawdown. A high win rate is appealing, but must be balanced against potential losses, as reflected in the maximum drawdown.
The interplay between these performance indicators is crucial for a robust trading strategy. A strategy with a slightly lower win rate but a much smaller maximum drawdown can be more beneficial for long-term profitability.
Realistic Expectations and Continuous Refinement
Maintaining realistic expectations when backtesting is crucial. No backtest can perfectly predict the future. Market conditions constantly shift, and past performance is not indicative of future results. Therefore, backtesting is not a one-time event, but an ongoing process.
Successful traders consistently revisit and adjust their backtests. They incorporate new data and adapt to changing market dynamics. This continuous refinement is essential for staying ahead and maintaining a profitable edge in trading. This ongoing adaptation differentiates consistently successful traders from those who struggle to remain profitable.
Finding Historical Data That Won't Mislead You
The foundation of any successful backtest lies in the quality of its historical data. Using unreliable data is like building a house on sand; it's destined to collapse. Many promising trading strategies fail not because the strategy is inherently flawed, but because the backtesting data provided a distorted view of reality. This section explores how to source reliable historical data for backtesting a trading strategy and avoid the pitfalls of misleading information.
Identifying Reliable Data Sources
Finding accurate historical data is crucial for backtesting. This data allows you to simulate trades under different market conditions and adjust strategies accordingly. For example, a trader might backtest a strategy using daily data from 2010 to 2020. By analyzing this data, they can refine their strategy to better handle bull and bear markets. Sourcing this data strategically is paramount, and understanding the nuances of different data providers is key. Historical data is the cornerstone of backtesting, enabling traders to evaluate strategies against past market conditions. High-quality data must be sourced from reliable providers to ensure accuracy. Discover more insights about historical data. Including transaction costs and slippage in the backtest ensures that the strategy's profitability is accurately represented.
Several key factors determine a data provider's reliability. Data accuracy is paramount. Look for providers with a proven track record and transparent data validation processes. Coverage, both in terms of asset classes and time periods, is also critical. A strategy requiring tick data for the past decade will have different data needs than one using daily data for the past year. Finally, consider the format and delivery method. Does the provider offer data in a format compatible with your backtesting platform? Do they provide APIs for automated data retrieval? You might be interested in: How to master your trading.
To help you compare data sources, take a look at the table below:
Historical Data Sources Comparison
Evaluation of different data providers for backtesting purposes
| Data Provider | Data Types | Cost | Quality | Coverage | API Available | Best For |
|---|---|---|---|---|---|---|
| Example Provider A | Tick, Minute, Daily | Premium | High | Extensive | Yes | High-Frequency Trading |
| Example Provider B | Daily, Weekly | Free | Medium | Limited | No | Beginners, Simple Strategies |
| Example Provider C | Tick, Minute, Daily, Options | Premium | High | Moderate | Yes | Options Trading, Algorithmic Trading |
This table provides example data and may not reflect actual data providers.
As you can see, choosing a data provider involves balancing cost, quality, and the specific data needs of your strategy.
Free vs. Premium Data: Understanding the Trade-Offs
While free data sources can be tempting, especially for beginners, they often come with limitations. Free data may have gaps, inaccuracies, or limited historical coverage. Premium data providers, on the other hand, typically offer higher quality, more comprehensive data, along with features like real-time updates and API access. However, these services come at a cost.
The decision between free and premium data depends on your individual needs and budget. If you're backtesting a simple strategy on a limited dataset, free data might suffice. However, for more complex strategies or larger datasets, investing in premium data can be a worthwhile investment. It can mean the difference between a backtest that reflects reality and one that provides a false sense of security.
Data Characteristics for Different Trading Timeframes
Different trading strategies require different types of data. High-frequency strategies, for instance, rely on tick-by-tick or even millisecond data to capture minute price movements. Day traders typically use minute or tick data, while swing traders and position traders may find daily or weekly data sufficient. Understanding these data requirements is crucial for building a backtest that accurately reflects the conditions your strategy will operate under.
Using insufficiently granular data can lead to look-ahead bias, where your backtest incorporates information not available at the time a trade would have been executed. This can significantly inflate backtested results, leading to disappointment when the strategy is applied to live trading.
Ensuring Data Integrity
Even with high-quality data, maintaining data integrity is essential. Survivorship bias, where the data only includes assets that “survived” a particular period, can skew results. Ensure your data accounts for delisted stocks or bankruptcies to avoid an overly optimistic view of historical performance. Additionally, consider adjusting for stock splits and dividends to maintain accurate price histories. These adjustments can significantly impact the results of your backtest, especially over longer periods.
Building Your Backtesting Environment Without Overkill
Many new traders think backtesting requires a hugely complicated and expensive setup. This just isn't true. Successful traders, whether they're seasoned pros or just starting out, build backtesting systems that fit their specific strategies and needs. This section will show you how to backtest a trading strategy effectively and efficiently.
Choosing the Right Platform for Your Strategy
The first step is picking a backtesting platform that matches your trading style and technical abilities. If you're a visual learner or if you work with simpler strategies, platforms like TradingView (TradingView) offer user-friendly charting and built-in backtesting tools. These platforms let you quickly test basic technical strategies without writing any code.
For instance, if you’re testing a simple moving average crossover strategy, you can easily see entries and exits on TradingView, getting instant feedback on how it would have performed historically.
But if your strategies are more complex, or if they use custom indicators or algorithms, a programming environment like Python (Python) with libraries such as Pandas (Pandas) and Backtrader (Backtrader) becomes crucial. These tools allow you to manage, process, and analyze large amounts of data, and implement more sophisticated backtesting logic.
Essential Features vs. Expensive Overkill
It’s tempting to get drawn in by all the extra features of advanced backtesting software. However, many of the costly extras are unnecessary for most traders. Concentrate on the core functions that truly affect your results.
-
Accurate Historical Data: High-quality historical data is essential for reliable backtesting. Invest in a trustworthy data provider that offers the right level of detail for your timeframe. This is non-negotiable.
-
Slippage and Commission Modeling: Include realistic slippage and commission costs to avoid overly optimistic backtest results. Real-world trading has costs that you need to consider.
-
Performance Metrics: Key performance metrics like maximum drawdown, Sharpe ratio, and win rate offer important insights into a strategy's strengths and weaknesses.
Beyond these essentials, many added features—like fancy optimization algorithms or order book simulation—are often excessive, especially for beginners. Focus on these fundamental components before investing in more advanced tools.
Streamlining Your Workflow for Rapid Testing
Effective backtesting relies on quickly iterating and improving your strategy. A streamlined workflow will help you achieve this. This means:
-
Clear Entry and Exit Rules: Define your entry and exit rules precisely. Avoid vague or subjective rules you can’t test consistently. This keeps your results unbiased.
-
Automated Backtesting: If you’re using a programming environment like Python, automate the backtesting process to quickly test across different parameters and datasets.
-
Version Control: Keep track of different versions of your strategy and their results. This lets you go back to previous versions and understand how changes affect performance.
By building a focused and efficient backtesting setup, you can concentrate on what really matters: developing a strong and profitable trading strategy. Experienced traders understand that complexity doesn't equal profits. A simple, well-defined strategy tested rigorously with accurate data often outperforms complex, over-optimized systems.
Crafting a Backtesting Methodology That Reflects Reality
Most backtests fail because they don't account for real-world conditions. They exist in a perfect, frictionless vacuum. Orders are always filled at the exact price you want, and slippage is a mythical creature. This section will unpack how professional traders design backtests that genuinely reflect market realities, bridging the gap between theory and practice.

Incorporating Slippage and Commissions
One of the most crucial aspects of a realistic backtest is incorporating slippage. Slippage represents the difference between the expected price of a trade and the price at which it's executed. This can be due to rapid price movements, especially during volatile markets. It can also simply be due to a lack of available buyers or sellers at your target price.
Similarly, commissions need to be factored in. Commissions are the fees charged by brokers like Interactive Brokers for executing trades. While seemingly small per trade, these costs can accumulate. They can drastically impact overall profitability. A strategy that appears profitable with zero commission might actually lose money once real-world brokerage fees are applied.
Realistic Position Sizing and Risk Management
Position sizing is another critical factor. Position sizing refers to the amount of capital allocated to each trade. A backtest should reflect your actual trading capital and risk tolerance. Risking 2% of your capital per trade in a backtest will yield different results than risking 10%.
Implementing proper risk management within your backtest is essential. This is key for understanding potential drawdown and protecting your capital. You might be interested in learning more about position sizing and risk management: How to master position sizing and risk management.
Defining Clear Entry and Exit Rules
Vague entry and exit criteria are a recipe for backtesting disaster. Successful traders establish crystal-clear rules. These rules can be objectively coded and tested. Subjective criteria, based on gut feelings or “market sentiment,” are impossible to replicate. They often lead to overly optimistic results. A rule based on a specific moving average crossover is testable, while a rule based on “when the market feels overbought” is not.
Accounting for Market Frictions
Real-world markets are full of frictions. These can include delays in order execution. Unexpected price gaps and periods of illiquidity are also common. While not always predictable, these frictions should be considered. This can be done by incorporating conservative slippage models. Testing the strategy's robustness across diverse market conditions, including periods of high volatility, is also helpful.
When backtesting, use historical data that reflects varied market conditions. This includes data from companies that went bankrupt, were sold, or were liquidated. This avoids artificially high returns. According to Investopedia, including diverse data ensures realistic results.
Consider a 10-year backtest. Using only data from currently active companies might show a 20% annual return. Including data from failed companies might show returns closer to 10% annually, a more realistic figure.
Testing Across Diverse Market Conditions
A strategy optimized for a specific historical period might perform poorly under different conditions. To ensure robustness, test your strategy across a variety of market environments. This includes bull markets, bear markets, and periods of high volatility. This determines if your strategy is truly adaptable or simply a product of curve fitting to a particular dataset.
Reading Between the Lines: What Your Backtest Is Really Saying
Backtesting a trading strategy isn't about chasing massive simulated profits. It's about gaining a deeper understanding of what your backtest truly reveals. Successful traders don't just celebrate paper gains; they meticulously examine their backtests to uncover hidden strengths and weaknesses. This involves going beyond surface-level metrics and developing an intuition for separating robust strategies from those overfitted to historical data.
Beyond Basic Metrics: Understanding Key Performance Indicators
Metrics like net profit and win rate offer a starting point, but they only scratch the surface. Savvy traders delve deeper, analyzing the equity curve, drawdown patterns, and trade distributions to gain a more comprehensive view of their strategy's behavior.
-
Equity Curve Analysis: A smooth, upward-trending equity curve suggests consistent performance. Sharp spikes and dips, however, can indicate instability and potential vulnerabilities. These irregularities might highlight an over-reliance on specific market conditions or hidden risks.
-
Drawdown Examination: Examining drawdown, the peak-to-trough decline in equity, is essential. Frequent, significant drawdowns can be psychologically taxing and rapidly erode capital. A robust strategy demonstrates manageable drawdowns and quick recovery periods.
-
Trade Distribution Insights: Analyzing the distribution of winning and losing trades offers valuable information. A strategy with a few outsized wins and many small losses can be statistically misleading. Consistency in trade outcomes offers a more reliable indicator of long-term viability.
Visualization: Unveiling Hidden Patterns
Visualizing backtest data can illuminate patterns obscured by raw numbers. Consider incorporating software quality assurance practices, like those found in this resource on software quality assurance best practices, to strengthen your analysis process. Plotting trade outcomes against various market conditions can reveal vulnerabilities to specific events or market regimes. For example, does your strategy thrive during periods of high volatility or only in calmer markets? This type of visual analysis helps pinpoint a strategy's strengths and weaknesses.
Statistical Significance: Knowing When to Trust Your Results
A profitable backtest doesn't guarantee future success. Understanding statistical significance is paramount. A small sample size or limited historical data can skew results, creating a false sense of optimism. Imagine flipping a coin five times and landing heads four times. This doesn't necessarily mean the coin is biased. Similarly, a short-term backtest with impressive returns might be a statistical anomaly rather than evidence of a true edge.
Robust backtesting requires testing your strategy across diverse market conditions and over extended historical periods. This helps ascertain whether the results are statistically significant and whether your strategy is genuinely robust or simply a product of overfitting to specific data. Consider the total number of trades in your backtest. A strategy with a high win rate based on only a few trades is less reliable than one with a slightly lower win rate based on hundreds of trades.
The Human Element: Avoiding Over-Optimization
While rigorous backtesting is crucial, avoid the pitfall of over-optimization. Chasing perfect historical performance often leads to complex strategies that underperform in live markets. Markets are inherently dynamic and unpredictable. A sound strategy should be adaptable, not overly sensitive to specific historical circumstances.
The best traders blend quantitative analysis with qualitative judgment. They use backtesting to inform their decisions but avoid blindly following every indication. They recognize backtesting as a tool, not a predictor of the future. They use their experience and market knowledge to interpret the results and refine their approach. By combining data-driven insights with human intuition, they develop strategies that are both robust and adaptable to the constantly shifting market dynamics.
From Backtest to Live Trading: Bridging the Reality Gap
A flawless backtest can be deceptive. While it provides valuable insights into a trading strategy's potential, it doesn't guarantee success in the unpredictable world of live trading. Moving from simulated results to real-world markets presents a unique set of challenges, both psychological and technical, that can easily derail even the most prepared traders. This section explores these challenges and discusses how to navigate this critical transition effectively. One important factor to consider when evaluating backtest results is the possibility of errors or flaky tests, which can skew your perception of a strategy's viability.
Validating Your Strategy Before Committing Capital
Before risking substantial capital, wise traders validate their backtested strategies through a series of practical steps. Paper trading, a process of simulating trades in a live market environment without real money, provides an invaluable testing ground. This allows you to experience the emotional and practical realities of executing your strategy under pressure.
Position scaling is another critical step. Start with small position sizes in live trading and gradually increase them as your confidence and experience grow. This controlled approach minimizes potential losses during the initial transition.
Monitoring Frameworks for Performance Evaluation
Once live trading begins, consistent monitoring is essential. A robust monitoring framework is key to understanding how your strategy is performing and identifying any necessary adjustments.
-
Key Performance Indicators (KPIs): Carefully select and track KPIs that directly reflect your strategy's core logic. For instance, if your strategy focuses on identifying breakouts, monitor the success rate of trades initiated after such breakouts. This provides crucial feedback on whether the strategy is functioning as designed.
-
Comparative Analytics: Maintain detailed records comparing your backtest projections with your live trading performance. Compare key metrics such as win rate, average profit per trade, and maximum drawdown. Significant discrepancies can indicate issues with the strategy's implementation or changes in market conditions.
-
Regular Review and Adaptation: Regularly review your monitoring data and be prepared to adapt. Markets are dynamic, and successful traders recognize the need for ongoing adjustments. Refine parameters, adjust entry/exit rules, or even discard a strategy if it consistently underperforms in live markets.
Psychological and Practical Considerations
The shift to live trading also involves significant psychological adjustments. The detached objectivity of backtesting is replaced by the real-time pressures of managing risk and navigating market volatility. Cultivating discipline and emotional control is crucial for success. Adhering to predefined rules and avoiding impulsive decisions driven by fear or greed can make all the difference. You might be interested in learning more about How to master your trading psychology.
Practical challenges can also emerge, such as technical issues with your trading platform or unforeseen market events. Having backup plans and contingency procedures in place will allow you to manage these obstacles and maintain consistent performance.
Successfully bridging the gap between backtesting and live trading requires a holistic approach that goes beyond simply having a profitable backtest. It demands psychological resilience, robust monitoring, and a willingness to adapt to the constantly evolving realities of the market.
Ready to elevate your trading and achieve consistent results? Explore the potential of price action trading with Colibri Trader. Start your journey today!