


How to Analyze Market Trends for Business Growth

Analyzing market trends isn't just about spotting the next big thing. It’s a methodical process. You start by figuring out what you actually need to know for your business, then you dive into the data—both the hard numbers and the softer, human insights from things like customer interviews. Finally, you piece it all together to separate a fleeting fad from a genuine market shift. Done right, this process turns a mountain of information into a real strategic edge.
Why Your Approach to Trends Matters

Before you get lost in complex charts and sophisticated software, you need to get your mindset right. Simply chasing whatever is popular right now is a surefire way to waste time and money. Real trend analysis is about digging deeper to understand the why behind what’s happening—the underlying forces shaping what people buy and how industries move.
It’s the difference between noticing skinny jeans are out and understanding the broader cultural shift towards comfort and looser fits that’s actually driving the change.
This is what separates businesses that just react from those that lead. Look at Netflix. They didn't just see that DVDs were popular; they saw the early signals of on-demand digital consumption. While Blockbuster was busy optimizing its physical stores, Netflix was already building the infrastructure for a streaming-first world. That foresight came from looking past surface-level data to spot a fundamental, long-term shift in consumer behavior.
Distinguishing Fads from Foundational Shifts
One of the first hurdles everyone faces is telling a fleeting craze apart from a meaningful market evolution. A fad tends to explode with a ton of hype and then fizzles out just as quickly. A trend, on the other hand, builds momentum more slowly and has a lasting impact because it’s tied to something deeper.
To get this right, you have to ask the tough questions:
- What’s the engine behind this? Is it new tech, a demographic change, an economic squeeze, or a shift in cultural values?
- Who is adopting it? Is it a small, niche group or is it spreading across a broad and growing audience?
- Does it actually solve a problem? Trends that offer real solutions or make life easier tend to stick around.
Think about it this way: a viral TikTok dance is a fad. But the underlying trend is the growing dominance of short-form video as a primary way we communicate and entertain ourselves. That’s a foundational shift companies like TikTok and Instagram have successfully built empires on.
A trend is a manifestation of something that has 'unlocked' or changed. It’s not the change itself, but the result of it. Understanding that root cause is the key to predicting its longevity and impact.
Before you can truly get a handle on what the market is doing, it helps to understand the different ways you can look at it. Each analytical approach gives you a unique lens.
Here's a quick rundown of the core methods and what they're good for:
Core Approaches to Market Analysis
| Analysis Type | What It Tells You | Best Used For |
|---|---|---|
| Technical Analysis | The "what" – focuses on price action, chart patterns, and trading volume to predict future movements. | Short- to medium-term trading, identifying entry/exit points, and gauging market sentiment. |
| Fundamental Analysis | The "why" – examines economic, financial, and other qualitative/quantitative factors affecting an asset's intrinsic value. | Long-term investing, evaluating a company's financial health, and understanding broad economic trends. |
| Quantitative Analysis | The "how much" – uses mathematical and statistical modeling to analyze behavioral data and financial events. | Algorithmic trading, risk management, and testing complex investment strategies with historical data. |
| Qualitative Analysis | The "human element" – looks at non-numerical data like brand strength, customer sentiment, and management quality. | Assessing competitive advantages, understanding consumer behavior, and identifying emerging cultural shifts. |
No single method is perfect. The real magic happens when you start combining insights from a few of these. A technical pattern might alert you to an opportunity, but a fundamental check confirms the company is solid enough to invest in.
Setting Clear Objectives for Your Analysis
Without a clear goal, you’re just swimming in data. You'll find plenty of interesting tidbits but will struggle to connect them to anything that actually helps your business. So, before you start, define exactly what you’re trying to accomplish.
Your objectives need to be specific and actionable. Are you trying to:
- Pinpoint unmet customer needs for your next product feature?
- Uncover new marketing channels to reach an emerging demographic?
- Anticipate what a competitor might do next?
For example, a software company might set a goal to "identify emerging workflow challenges among remote teams to guide our 2025 product roadmap." That goal is focused. They aren't just looking for "remote work trends"; they are hunting for specific pain points they can solve. This targeted approach is the first real step in turning raw data into a competitive weapon.
Uncovering the 'Why' with Qualitative Insights
Hard data and charts are essential. They tell you the "what"—sales figures are down, traffic from a specific source is up, a certain demographic isn't converting. But to really understand a market trend, you have to dig deeper than the numbers and find the "why" behind them.
This is where qualitative insights become your secret weapon.
Qualitative analysis is all about understanding the human side of the equation. It's about the real-world motivations, frustrations, and desires that actually drive people to buy (or not buy). Your quantitative data gives you a map, but the qualitative stuff tells you about the terrain—the rocky paths and hidden shortcuts. Without that context, you’re just guessing, potentially chasing trends that are hollow or about to fizzle out.
It’s the difference between seeing a drop in sales and understanding that customers are fed up with a clunky user interface and are jumping ship to a competitor with a cleaner design. One is data; the other is a story you can act on.
Tapping into Genuine Customer Conversations
The best place to find unfiltered, honest opinions is wherever people are already talking. Forget sterile focus groups where participants might just tell you what they think you want to hear. You want the raw, authentic conversations happening online every single day.
Social listening isn't just about tracking brand mentions. It’s about becoming a fly on the wall in the right digital spaces to truly understand sentiment.
- Industry Forums and Subreddits: Communities like Reddit are absolute goldmines. Find subreddits related to your industry (think r/skincareaddiction for a beauty brand) and just observe. What are people struggling with? What products do they rave about, and which ones do they shred to pieces?
- Product Review Sites: Look beyond your own reviews and start analyzing your top competitors'. You're looking for patterns in both the glowing praise and the scathing critiques—these are direct clues to unmet needs in the market.
- Q&A Platforms: Sites like Quora show you the exact questions your target audience is asking, in their own words. That language can directly inform your marketing copy and shine a spotlight on their biggest pain points.
This kind of observation helps you master decision-making under uncertainty because you’re grounding your strategy in reality, not assumptions. You start to anticipate shifts because you have a direct line to what your audience is thinking.
Conducting Interviews That Uncover Truth
While lurking online is powerful, sometimes you need to get more direct. Well-structured customer interviews can give you a depth of understanding that passive observation just can't match. The key here isn't to validate your own ideas; it's to have your assumptions completely shattered.
The most dangerous thing in market analysis is an echo chamber. The goal of a good customer interview is to hear something you don’t expect. That's where the real opportunities are hiding.
To get that kind of honesty, you need to create a comfortable, conversational space.
- Ask Open-Ended Questions: Ditch the simple yes/no questions. Instead of, "Is our pricing fair?" try something like, "Can you walk me through how you think about the value of products like ours?"
- Focus on Past Behavior: People are terrible at predicting their own future actions. Don't ask what they would do; ask what they did. You'll get much more reliable stories about their past experiences.
- Listen More Than You Talk: Your job is to guide, not dominate. Let a little silence hang in the air after they answer; it's amazing how often this encourages someone to elaborate with a much deeper insight.
Finding Patterns with Thematic Analysis
Okay, so now you have a mountain of qualitative data—interview transcripts, forum threads, review summaries. How do you make sense of it all?
This is where a simple technique called thematic analysis comes in handy. It’s really just a process for spotting, analyzing, and reporting patterns (or "themes") within all that information.
You don’t need fancy software to get started. A simple spreadsheet will do. As you go through your notes, just highlight recurring words, concepts, frustrations, or desires. Group similar ideas together. Before long, clear themes will start to jump out, like "wants sustainable options," "hates subscription models," or "needs better integration with X."
This process can also reveal trends you never saw coming, like a growing preference for local products. One revealing McKinsey report found that 47% of consumers globally prefer to buy from locally owned companies. The "why" is even more telling: 36% want to support their local economy, while 20% feel local brands simply meet their needs better. That's the kind of insight that can directly reshape a company's entire marketing strategy.
These patterns are the stories hiding behind your data, turning abstract numbers into a narrative you can actually use.
Validating Your Hunches With Quantitative Data
Qualitative insights give you a story—a powerful narrative about what your customers are feeling and why they’re acting a certain way. But a good story isn't enough to justify a major strategic pivot. To build a rock-solid case, you need to back up those human insights with hard, undeniable numbers.
This is where quantitative data steps in. It’s all about turning your well-formed hypothesis into something measurable and objective. It’s the proof that transforms a smart hunch into a reliable foundation for your next big move.
Pinpointing the Right Metrics to Track
The first thing you have to do is figure out what to measure. Drowning in data is just as bad as having none, so you need to be selective. Focus on key performance indicators (KPIs) that directly prove or disprove the trend you've identified.
Let's imagine your customer interviews suggest a growing demand for sustainable, eco-friendly packaging in your industry. What numbers would actually confirm this?
- Sales Data: Check for a spike in sales for any products you offer with eco-friendly options. How does their growth rate stack up against your standard products?
- Website Analytics: Start tracking search queries on your site. Are terms like "recyclable," "sustainable," or "plastic-free" popping up more often? Also, keep an eye on click-through rates for banners or blog posts that mention sustainability.
- Social Media Engagement: See how posts that highlight your brand's green initiatives are performing. Are they getting more shares, comments, and positive sentiment than your other content?
This process—moving from a hypothesis to collecting hard data and checking it against the competition—is the core of quantitative validation.
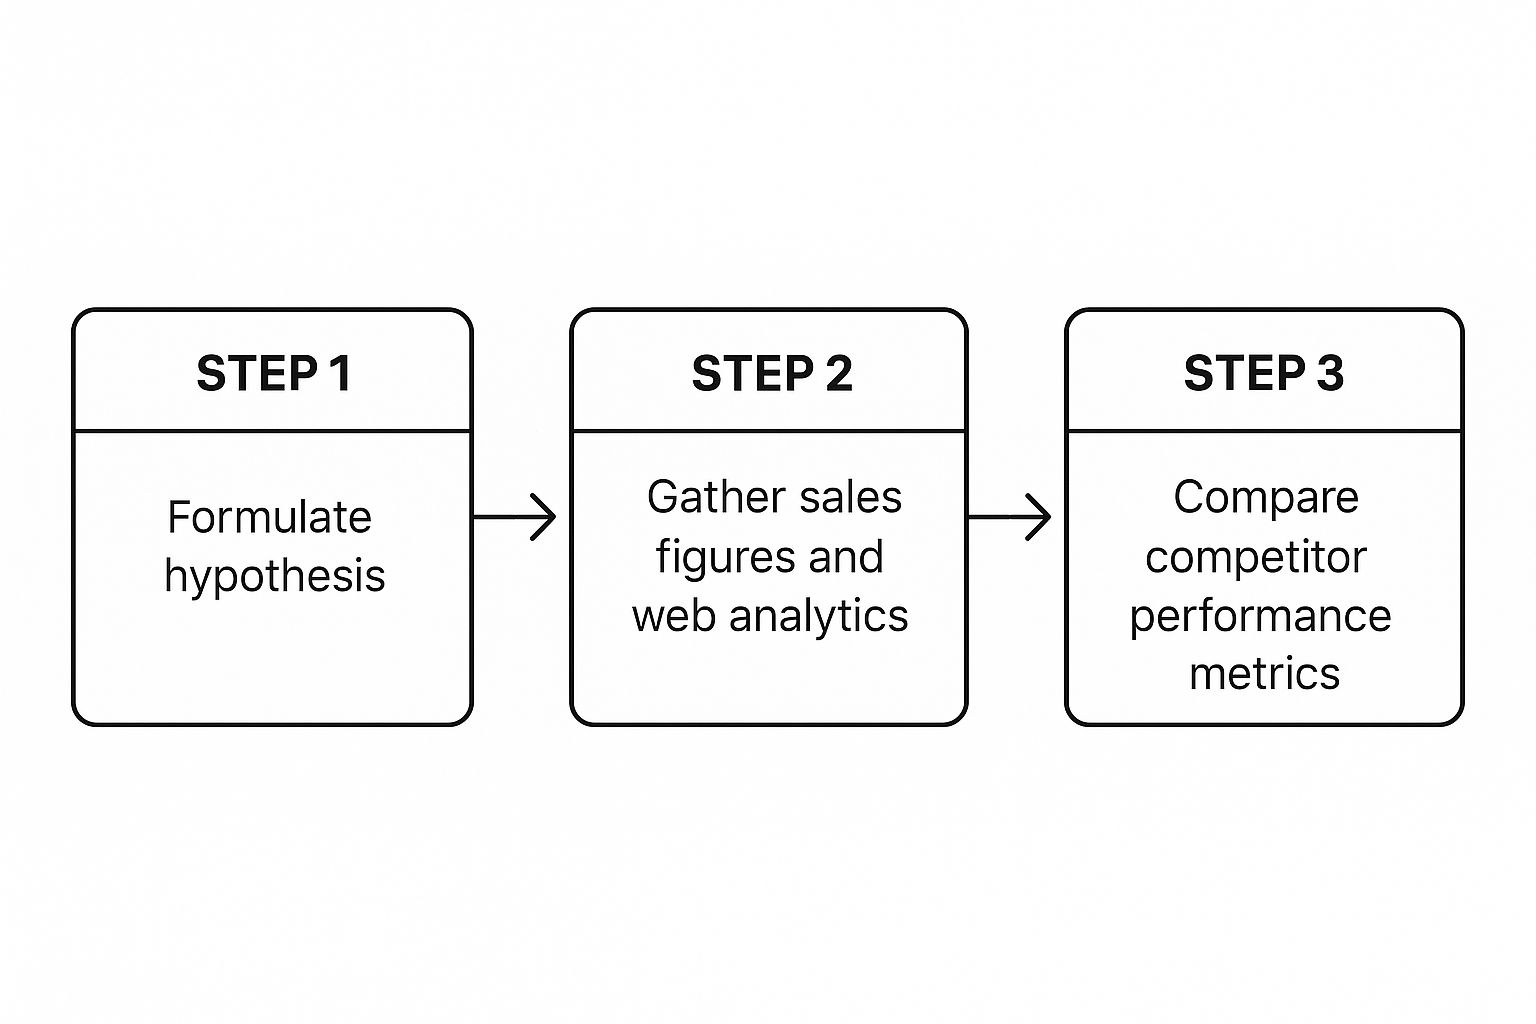
This visual gives you a simple roadmap for connecting an initial theory with concrete data points and competitive context.
Leveraging Accessible Data Tools
You don't need a massive budget or a dedicated data science team to get started here. Powerful tools are readily available, often for free, that can paint a clear numerical picture of public interest and market movement.
One of the most valuable is Google Trends. By plugging in keywords related to your suspected trend (like "plant-based snacks"), you can visualize search interest over time. You can see if it’s a seasonal fad, if it’s experiencing steady growth, or if it was just a flash in the pan. I like to compare it to related terms to see which concepts are really gaining traction.
Beyond public search data, your own internal data is an absolute goldmine. Dig into your Customer Relationship Management (CRM) software and sales reports. A sudden jump in product returns, for instance, could be a quantitative signal that validates qualitative feedback you've heard about declining product quality. This is how you analyze market trends in a way that directly impacts your bottom line.
Quantitative data doesn't just confirm a trend's existence; it quantifies its magnitude. It tells you if you're dealing with a small ripple or a tidal wave that's about to reshape your entire industry.
Putting It All Together: A Real-World Scenario
Let’s walk through an example. A trading education platform notices through forum chatter (qualitative data) that more novice traders are getting frustrated with complex, indicator-heavy strategies. Their hypothesis: There is a growing market trend towards simpler, price-action-based trading methods.
To validate this, they start digging for quantitative data:
- Website Analytics: They discover a 35% increase in organic traffic to their blog posts about "price action" over the last six months.
- Google Trends: The search term "price action trading" shows a steady upward climb over the past two years, while "day trading indicators" has stayed flat.
- Competitor Analysis: They see that two major competitors have recently launched new courses focused specifically on indicator-free trading.
The numbers strongly support their initial hunch. This data-backed insight gives them the confidence to double down on their marketing, create a new course tailored to this demand, and adjust their content strategy. This process is a lot like how traders learn how to backtest a trading strategy, using historical data to validate a forward-looking approach.
To take it a step further, advanced tools can seriously improve your data interpretation. For instance, some platforms now offer AI-powered financial analysis to uncover deeper market insights from complex datasets. By combining the stories from your qualitative work with the proof from your quantitative data, you create a complete picture. That’s what empowers you to act decisively and with real confidence.
Using Modern Tech for Smarter Trend Spotting

While the fundamentals of observation and analysis are timeless, let's be real: technology gives us a massive edge in spotting what's next. Modern tools can chew through data at speeds no human team could ever dream of, revealing subtle patterns that scream "a shift is coming." This is how you stop reacting to the market and start anticipating it.
Artificial intelligence (AI) and machine learning are at the heart of this. These systems are brilliant at sifting through messy, unstructured data—think social media rants, customer reviews, and news articles—to get a real-time pulse on public sentiment. Instead of spending days reading comments, you can get an instant, data-backed view of how a new product is landing.
Automating the Search for Signals
The most obvious win from technology is automation. It handles the grunt work of data collection. Sophisticated platforms can track competitor price changes, monitor brand mentions across the web, and even forecast demand based on historical data and current online buzz. This frees you up to think about what the data means, rather than getting bogged down in collecting it.
It's all about using computational power to connect dots that would otherwise stay hidden, leading to more advanced AI-powered decision-making.
Think about it in practical terms:
- Sentiment Analysis: Tools can scan millions of posts and reviews to gauge the feeling (positive, negative, neutral) toward a brand or topic. A sudden nosedive in sentiment could be your first warning of a product flaw or PR nightmare.
- Predictive Analytics: By crunching past sales data against things like economic indicators or even weather patterns, machine learning can forecast future demand with startling accuracy. This helps with everything from managing inventory to scheduling staff.
- Competitor Intelligence: Automated tools can send you an alert the second a competitor launches a new ad, drops their prices, or gets a major news feature. It’s like having a real-time spy on the competitive landscape.
A Look at Today's Trend Analysis Tools
The market is full of tools designed for this kind of analysis. Picking the right one depends entirely on what you're trying to achieve, from broad social listening to deep financial data mining.
| Tool Category | Primary Function | Example Platforms |
|---|---|---|
| Social Listening Platforms | Tracking brand mentions, sentiment, and keyword trends across social media and the web. | Brandwatch, Sprout Social |
| Business Intelligence (BI) Tools | Visualizing and analyzing your internal data (sales, customer behavior) to spot patterns. | Tableau, Microsoft Power BI |
| Market Research Platforms | Providing access to consumer surveys, industry reports, and demographic data. | Statista, GWI |
| Financial Data Terminals | Offering real-time market data, news, and advanced analytics for financial markets. | Bloomberg Terminal, Refinitiv Eikon |
These are just starting points. The key is to find platforms that integrate well with your existing data and provide the specific insights you need to make smarter, faster decisions.
The Power of Personalization Data
Personalization is more than just a slick marketing tactic; it's a goldmine of data for uncovering niche trends. When Amazon or Netflix suggests something, they aren't just trying to be helpful—they're logging billions of data points on what individuals want.
This granular data can reveal micro-trends that broad analysis would completely miss. You might find that a small but valuable segment of your audience always buys two seemingly unrelated products together. That insight could spark a new product bundle, a laser-focused marketing campaign, or even an entirely new product.
This kind of hyper-personalization is quickly becoming the standard, not the exception. The focus is shifting, with 56% of marketing leaders now actively investing in personalization and AI tools to meet consumer demand for more tailored experiences.
Algorithmic Trading as a Market Indicator
For a powerful example of tech in action, look at the financial world. Algorithmic trading systems use complex mathematical models to identify and act on market trends far faster than any human could.
You don't need to be a hedge fund manager to learn from this. The logic these systems use often reveals what sophisticated players consider important predictive signals. If you're curious, you can learn more about what algorithmic trading is in our detailed guide.
By watching the kinds of patterns these algorithms exploit, you can get a masterclass in how technology translates subtle data points into profitable action. Integrating these modern tools makes your trend analysis not just faster, but fundamentally smarter.
Turning Your Analysis into Actionable Strategy

Okay, you've done the digging. You have insights. Now what? This is the point where most analysis falls flat.
Gathering data is one thing, but turning it into a smart business decision is a completely different ballgame. The most brilliant analysis is worthless if it just sits in a spreadsheet or a slide deck. This is where you connect all the dots—the qualitative stories and the quantitative proof—to build a strategy that actually drives results.
Your real goal here is to move from observation to execution. It’s about building a clear, compelling story that gets your team and stakeholders to act.
Synthesizing Your Findings into a Coherent Story
First things first, you need to weave all those disparate data points into a single, understandable narrative. This isn't just about listing facts; it's about explaining what those facts mean when you put them all together.
I find it helps to start by answering a few core questions to give the story some structure:
- What is the core trend? Nail this down in a single, clear sentence. Something like, "Novice traders are increasingly seeking simpler, indicator-free trading strategies."
- Why is this happening now? Get to the root cause. Maybe it's market saturation with overly complex tools or even a cultural shift towards minimalism.
- What's the potential impact? This is where you frame the consequences for your business. It creates urgency and highlights the opportunity (or the threat).
When you build this narrative, you give people the context they need to really grasp what you've found. A collection of data becomes a strategic imperative. The story is the "why" behind the actions you're about to propose.
From Insights to Concrete Strategic Moves
With a clear story in place, the next move is translating it into specific, actionable initiatives. This is where you finally answer the question, "So, what are we going to do about it?" A trend isn't just an interesting fact; it's a signal to adjust your course.
Think about how this trend hits different parts of your business. Does it just demand a new marketing angle, or does it call for a fundamental shift in the product itself?
The true value of market trend analysis isn't in knowing what's happening, but in knowing how to react. A well-defined trend should lead directly to a set of clear, strategic "if-then" statements for your business.
Let's say you've identified a growing demand for sustainable products. Your strategic moves might look something like this:
- Product Roadmap: Prioritize development of an eco-friendly product line. Or, at a minimum, update existing packaging to be recyclable.
- Marketing Angles: Launch a new campaign that hammers home your brand's commitment to sustainability. Focus on keywords and messaging that you know resonate with this audience.
- Operational Changes: Start re-evaluating your supply chain to partner with more environmentally responsible suppliers.
This is how you ensure your analysis doesn't just stay theoretical.
Building a Simple and Effective Trend Report
To get buy-in from the higher-ups, you have to present your findings in a way that's easy to digest and impossible to ignore. A bloated, 50-page report will get skimmed, at best. A sharp, focused summary will get action.
Your report should focus on three key areas:
- The Key Insight: Lead with the conclusion. What is the single most important thing you learned?
- The Supporting Evidence: Briefly show your work. Pull 2-3 key data points (a mix of qualitative and quantitative) that prove your point.
- The Recommended Actions: Clearly outline the top 3-5 strategic moves you're proposing. Add a brief note on the expected outcome for each.
The integration of AI in market research has become a fundamental part of building these reports, especially for sharpening forecasts. Recent data shows researchers are using AI tools to find deeper insights and dramatically speed up the process. This tech has moved from a novelty to a core methodology. You can explore the full study on AI's role in market research trends to see the latest advancements.
By keeping your report concise and action-oriented, you massively increase the odds that your hard work will translate into meaningful business growth. This is the final, and most critical, step.
Common Questions About Market Trend Analysis
When you first get into market trend analysis, a few questions always seem to pop up. Getting straight answers to these can clear up some major confusion and help you build real confidence in your process.
Let's tackle the most common ones head-on with some practical, no-fluff advice. Think of this as your go-to guide for those "what if" moments as you start putting these ideas into practice.
How Often Should I Analyze Market Trends?
There's no magic number here. The right frequency really depends on how fast your industry moves. The faster things change, the more often you need to check the market's pulse. A static approach just won't cut it.
For industries that are constantly shifting, like consumer tech or fast fashion, a comprehensive quarterly deep-dive is a solid starting point. You'll want to back that up with continuous monitoring using simple tools like Google Alerts or social listening platforms. This way, you catch those unexpected shifts right as they start to gain steam.
On the other hand, for more stable sectors like manufacturing or B2B industrial goods, a thorough bi-annual or annual review might be all you need. The key, no matter the industry, is to have an "always-on" system for tracking key signals so you're never caught completely flat-footed.
What Is the Difference Between a Market Trend and a Fad?
This is probably the single most important distinction you can make. Mistaking a short-lived fad for a genuine trend is a surefire way to make some disastrous strategic decisions and waste a ton of resources. The real difference comes down to their foundation and staying power.
-
A Trend lasts because it's tied to a deeper, more fundamental shift. Think about changes in technology (like the move to cloud computing), consumer values (the growing demand for sustainability), or demographics (an aging population). Trends build momentum over time and create lasting change.
-
A Fad is usually superficial, driven by novelty or social media hype. It shows up out of nowhere, burns incredibly bright, and then disappears almost as fast, leaving very little real impact. Viral social media challenges are a perfect example, or that one clothing item that's everywhere for a season and then vanishes.
To tell them apart, you have to dig for the "why." A fad just exists, but a trend is a symptom of a much larger, underlying change. Understanding that root cause is how you can confidently tell a fleeting distraction from a foundational market shift.
Can I Analyze Market Trends with a Small Budget?
Absolutely. Big, expensive enterprise tools are nice to have, but a small budget is not a barrier to doing effective market trend analysis. In fact, some of the best insights come from sources that are completely free. It's about being resourceful, not about how much cash you're throwing at the problem.
You can actually put together a powerful analysis toolkit without spending a dime.
Free Resources for Trend Analysis
| Resource | How to Use It for Trend Spotting |
|---|---|
| Google Trends | Directly compare search interest for keywords to see what's gaining traction and what's fading away. It's simple and incredibly revealing. |
| Reddit & Industry Forums | Eavesdrop on unfiltered conversations. This is where you'll find real customer pain points, desires, and the language they use to describe them. |
| Customer Reviews | Scour reviews for your products and your competitors'. You're looking for recurring themes, complaints, and unmet needs. |
| Google Forms & Surveys | Put together simple surveys and send them to your email list or social followers. Nothing beats getting direct, qualitative feedback straight from the source. |
Sure, these methods take a bit more manual effort, but the quality of the insights you can pull from them is often far better than what you'd get from some generic, off-the-shelf market report. At the end of the day, trend analysis is a skill of observation and synthesis, not just a function of your software budget.
Ready to stop guessing and start trading with a proven, indicator-free strategy? At Colibri Trader, we provide the no-nonsense, price-action education you need to build confidence and achieve consistent results. Explore our courses and transform your trading today at https://www.colibritrader.com.