


Gravestone Doji Candlestick: Identify & Trade Confidently
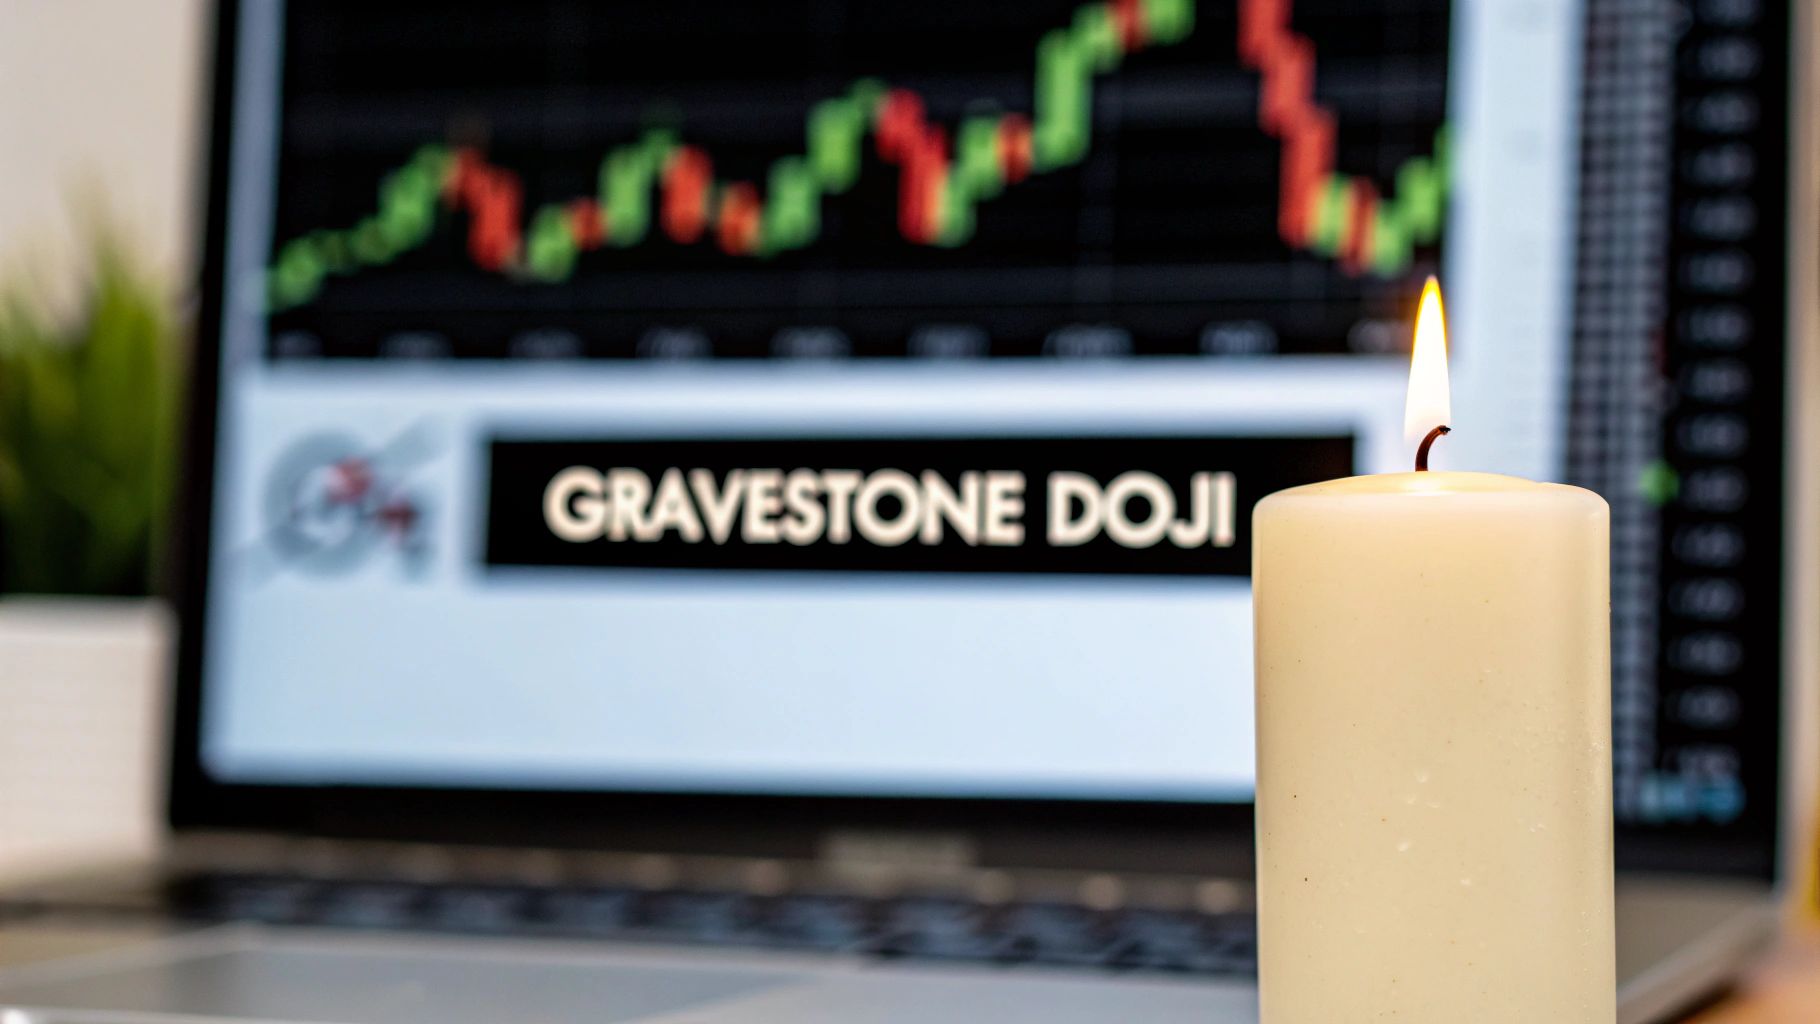
The Gravestone Doji. The name itself sounds ominous, doesn't it? It’s meant to. This powerful little candlestick is a stark warning sign for bulls, often appearing right at the peak of an uptrend just before things turn sour.
Think of it as the market trying to reach for the sky, getting smacked down hard, and landing right back where it started. It tells a dramatic, one-session story of a failed rally and a sudden shift in power.
Decoding the Gravestone Doji Candlestick
When you see a Gravestone Doji pop up on your charts, it's often marking the "grave" of a bullish trend. Its appearance is a clear signal that buyers have exhausted themselves, and sellers are stepping in with force, ready to take control.
To really get what this pattern is telling you, it helps to have a solid grip on the fundamentals of candlestick charts. Each candle tells a piece of the market's story, and the Gravestone Doji tells a particularly interesting one.
What Makes a Gravestone Doji?
This candle has a very distinct look, and for a good reason. It’s the visual representation of a battle between buyers and sellers where the sellers land a knockout blow.
To help you spot it in the wild, the table below breaks down its essential features.
Gravestone Doji Key Characteristics
| Characteristic | Description | Market Implication |
|---|---|---|
| Location | Appears after a sustained uptrend. | Signals potential trend exhaustion and reversal. |
| Upper Shadow | Very long; makes up most of the candle's range. | Shows a strong initial push by buyers that was completely rejected. |
| Real Body | Tiny to non-existent, located at the low of the session. | Indicates the close was at or very near the open and session low. |
| Lower Shadow | Little to no lower shadow. | Confirms sellers dominated from the session high to the close. |
In short, you're looking for an inverted "T" at the top of a move. That’s your signal.
The Psychology Behind the Reversal
So, why is this one little candle such a big deal? It’s all about the market psychology it reveals.
Imagine a trading session where the bulls are feeling confident. They push prices higher and higher, breaking new ground. Everything looks great. But then, they hit a wall. Sellers flood the market, not just stopping the rally but aggressively pushing the price all the way back down to where it opened.
This isn't just a pause; it's a powerful rejection of higher prices. It shows that the conviction behind the uptrend has evaporated, and sellers have seized control. The balance of power has shifted, often dramatically.
Of course, no pattern works in a vacuum. Context is everything. But the Gravestone Doji has a pretty solid track record. One study looking at 1,553 trades found it to be the third most profitable candlestick pattern, boasting a win rate around 58% as a bearish signal.
It's just one member of the Doji family, each telling a different story of market indecision. If you're curious, you can dig deeper into the broader meaning of a Doji candle to round out your knowledge.
The Market Psychology Behind the Gravestone Doji
To really get the Gravestone Doji, you have to look past its T-shape and understand the story it's telling. Every candlestick is a miniature battlefield report, a snapshot of the fight between buyers (bulls) and sellers (bears). And this particular one tells a tale of a dramatic power shift.
Picture a trading session kicking off with a ton of optimism. The bulls are running the show, maybe riding the wave of good news or just continuing a strong uptrend. They push prices higher and higher, creating that long upper shadow you see on the chart. To the untrained eye, it looks like the bulls are unstoppable.
But then, that upward climb hits a wall.
The Turning Point Where Sellers Dominate
Right at the peak of the session, sellers jump in with overwhelming force. This could be sparked by a major resistance level, early buyers deciding to cash in, or a sudden shift in the overall market mood. Whatever the cause, they don't just halt the rally—they completely reverse it.
Sellers hammer the price all the way back down, wiping out every single gain the bulls fought for. By the time the session closes, the price is right back where it started, or very close to it. This violent rejection of higher prices is what makes the Gravestone Doji candlestick such a powerful bearish signal. It's the visual proof of a failed attack.
The Gravestone Doji tells the story of a failed rally. It shows that buyers tried to push the market up, but sellers seized complete control by the session's end, signaling that the uptrend's momentum might be dead in the water.
This whole narrative gives us a few critical psychological clues:
- Buyer Exhaustion: The initial surge upward completely drained the buyers' energy.
- Seller Confidence: The aggressive pushback reveals that sellers are feeling confident and are taking control.
- Market Rejection: The price action is a clear and decisive "no" to the session's highs.
The Shift in Market Control
This single candle captures a total reversal of sentiment within one period. It's as if the market took a trip to higher price levels, looked around, and decided it wasn't worth it. The bulls lost all their ground, and you can bet their confidence is shaken.
This psychological blow often sets the stage for more downside, as the newly emboldened bears press their advantage in the next sessions. Getting a feel for this dynamic is the key to trusting what the pattern is telling you.
When you grasp the psychology behind different Japanese candlestick patterns, you give yourself a massive edge. It takes your analysis from just recognizing shapes to truly understanding the forces moving the market.
How to Spot and Confirm This Reversal Pattern
Spotting a potential Gravestone Doji is the easy part. The real skill is knowing if it’s a genuine signal or just market noise. Far too many new traders jump the gun on this pattern without proper validation, turning a promising setup into a costly mistake. True confirmation is what separates a high-probability trade from a false alarm.
Think of the Gravestone Doji as a flashing yellow light. It's a warning, a heads-up that things might be about to change. But you don't slam on the brakes and U-turn just because you see it. You wait to see the cross-traffic—the proof that the change is happening. In trading, that proof is your confirmation.
Your Identification Checklist
Before you even think about confirmation, you have to be sure you're looking at a legitimate Gravestone Doji. It isn't just any candle with a long wick. It needs to meet three strict criteria to even be a candidate for a bearish reversal.
- Preceding Uptrend: The pattern is only meaningful if it shows up after a clear push higher. A Gravestone Doji that forms in the middle of a choppy, sideways market is usually just noise and should be ignored.
- The Right Shape: It absolutely must have a long upper shadow and a body that's either non-existent or tiny, right at the bottom of the candle's range. That inverted "T" shape is non-negotiable.
- Location, Location, Location: Its predictive power goes through the roof when it forms at a significant technical level. We're talking about a known resistance zone, a previous major high, or even a big psychological round number.
If the candle you're watching ticks all three of these boxes, then you can move on to the most important step: getting confirmation.
A Gravestone Doji on its own is just an interesting observation. A confirmed Gravestone Doji is an actionable trade signal. Never confuse the two.
Confirmation: The Key to a Confident Trade
I'll say it again: never trade a Gravestone Doji the moment it closes. The most disciplined traders I know always, always wait for more evidence that sellers are actually taking charge. This patience is what filters out the weak signals and dramatically stacks the odds in your favour. It's not just a gut feeling; backtesting studies have shown that a Gravestone Doji appearing at the peak of an uptrend signals a reversal about 62% of the time. You can read more about these findings on Quantified Strategies.
Here are the three confirmation techniques I rely on:
-
The Next Candle's Story: This is the simplest and most powerful confirmation there is. Wait for the next candle to close. If it's a strong bearish candle that closes below the low of the Gravestone Doji, that’s your green light. It proves sellers followed through on their initial rejection of higher prices.
-
A Spike in Volume: Glance down at the volume bar that corresponds with your Gravestone Doji candle. Was it higher than average? A big volume spike tells you a significant battle took place between buyers and sellers, and the sellers' victory is that much more meaningful. It shows real conviction behind that price rejection.
-
Indicator Divergence: This is a more advanced layer, but it's incredibly powerful. Fire up an oscillator like the Relative Strength Index (RSI). If price makes a new high with the Gravestone Doji but the RSI makes a lower high, that’s classic bearish divergence. It's a massive clue that the momentum behind the uptrend is fading, giving you a powerful, independent reason to trust the candlestick signal.
Practical Trading Strategies Using the Gravestone Doji
Spotting a Gravestone Doji is one thing. Knowing exactly how to trade it with a disciplined, rock-solid plan is something else entirely. This is where we move from theory to an actionable trading strategy—the kind that removes emotion and lets you execute with confidence when this powerful bearish signal flashes on your charts.
The real goal here isn’t just to see the pattern, but to build a complete system around it. That means having precise rules for your entry trigger, a logical spot for your protective stop-loss, and clear criteria for taking profits. Without these three pieces, even the most perfect-looking signal can lead to inconsistent, frustrating results.
Building Your Trade Plan Step-by-Step
A professional trader doesn't just jump in the moment a Gravestone Doji forms. That's a classic rookie mistake. Instead, you need to let the market confirm the signal first, then execute your pre-defined plan. It’s all about patience and process.
Let's break down the three core elements of a solid Gravestone Doji strategy:
-
The Entry Trigger: This is your green light to act. The most common and reliable trigger is to enter a short position once the price breaks below the low of the Gravestone Doji candle itself. This move confirms that sellers are following through on their initial rejection of higher prices and are now wrestling control from the bulls.
-
The Stop-Loss Placement: Think of your stop-loss as your safety net. It's there to protect your capital if the signal fizzles out. A logical place for it is just above the high of the Gravestone Doji's long upper shadow. Since that high represents the peak of bullish failure, a price move above it completely invalidates the bearish setup.
-
The Profit Target: Your exit strategy is just as crucial as your entry. A few common-sense methods work well here. You could aim for a prior significant support level, where you'd expect buyers to step back in. Another popular approach is using a fixed risk-to-reward ratio, like 1:2 or 1:3. This ensures your potential profit is at least double or triple your potential loss, which is key to long-term profitability.
This flowchart maps out the decision-making process, helping you quickly validate whether a Gravestone Doji is a high-probability setup worth considering.
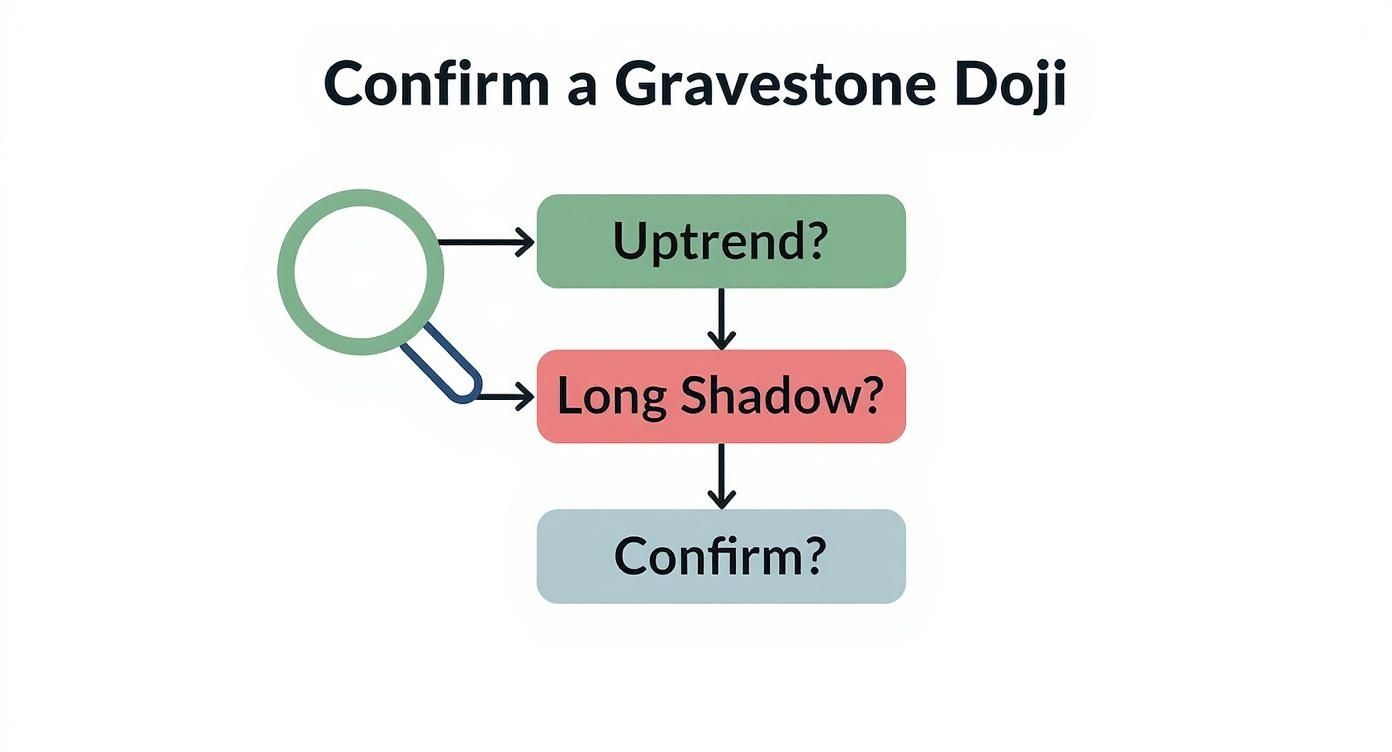
As you can see, a valid signal needs the right context (an uptrend), the right structure (the Gravestone candle), and the right follow-through (bearish confirmation).
To make this even more practical, I've put together a simple checklist you can run through before taking a trade. This helps keep you disciplined and focused on the key components of a high-quality setup.
Gravestone Doji Trade Setup Checklist
| Step | Action | Rationale |
|---|---|---|
| 1. Context Check | Confirm a clear uptrend precedes the pattern. | The pattern is a reversal signal; it needs a trend to reverse. |
| 2. Pattern ID | Identify a valid Gravestone Doji at a key resistance level. | Location is critical. A doji at a random price point is less reliable. |
| 3. Confirmation | Wait for the next candle to close below the low of the Gravestone Doji. | This proves sellers have taken control and validates the signal. |
| 4. Entry | Enter a short (sell) position on the break of the doji's low. | This is your trigger to act based on the confirmed weakness. |
| 5. Stop-Loss | Place a stop-loss order just above the high of the doji's shadow. | This defines your maximum risk and invalidates the setup if hit. |
| 6. Target | Set a profit target at a prior support level or use a 1:2+ R:R. | Ensures the potential reward justifies the risk taken on the trade. |
Following a checklist like this turns trading from a guessing game into a methodical process. You know your plan before you ever click the "sell" button.
An Example Trade Setup
Let's walk through a real-world example. Imagine a stock has been climbing and forms a Gravestone Doji right at a known resistance level of $150.
- Doji High: $152.50
- Doji Low/Open/Close: $150.00
Here’s how your trading plan would look:
- Entry: You'd place a sell order to trigger if the price breaks below $150. Let's say you get filled at $149.90.
- Stop-Loss: You set your stop-loss just a tick above the high, at $152.60. This means your risk per share is $2.70.
- Profit Target: If you're aiming for a 1:2 risk-to-reward, your target is twice your risk ($5.40) below your entry. That puts your target at $144.50.
By laying everything out this way, you’ve defined your entire trade—risk and reward—before putting any capital on the line.
While the Gravestone Doji is a fantastic bearish pattern, understanding its bullish counterpart helps build a more complete picture of price action. To learn more about a similar but opposite reversal signal, check out our guide on the Inverted Hammer candlestick pattern. Comparing the two really helps solidify your understanding of market psychology.
Real-World Examples of the Gravestone Doji in Action

Theory and rules are great, but the real "aha!" moment comes when you see a gravestone doji candlestick pop up on a live chart. This isn't just a textbook drawing; it's a signal that shows up time and again, marking critical turning points in every market you can think of.
Let’s move past the diagrams and look at a couple of real-world scenarios. This is where abstract concepts become tangible trading lessons.
Case Study: Apple Inc. (AAPL) Stock
Tech behemoth Apple (AAPL) gave us a textbook example of this pattern's punch. Back in July 2020, the stock was in the middle of a monster uptrend. Then, right near its all-time high, a picture-perfect Gravestone Doji formed on the daily chart. That was a huge red flag signalling that the buyers were finally running out of steam.
The very next candle was a big, bearish confirmation, closing decisively below the doji’s low. Just as the pattern warned, the stock took a nosedive, tumbling nearly 15% in the following week.
This example drives home one of the most important rules of trading: context is everything. The Gravestone Doji didn't just appear out of nowhere. It formed at the absolute peak of a long, powerful rally, which made its bearish message incredibly potent.
That combination—a relentless uptrend hitting a wall with a Gravestone Doji—was the perfect setup for traders anticipating a reversal.
Case Study: Bitcoin at a Psychological Peak
The Gravestone Doji isn't just for stocks; it’s just as powerful in the wild west of crypto. Take a look at April 2021, when Bitcoin (BTC/USD) was the talk of the town. As it approached the massive psychological barrier of $60,000, a glaring Gravestone Doji printed on the weekly chart.
That single candle told a powerful story. Despite all the hype and bullish momentum, sellers came in with overwhelming force, brutally rejecting any attempt to push higher. After that weekly signal, Bitcoin rolled over into a major correction, shedding over 30% of its value in the weeks that followed. If you want to dig into more chart examples, you can find great insights on trading the Gravestone Doji on TraderVue.
Key Takeaways from These Examples
Looking back at these charts, a few universal truths about trading the Gravestone Doji really stand out.
- Universality: This pattern is asset-agnostic. It works on blue-chip stocks like Apple and volatile digital currencies like Bitcoin because the underlying psychology—buyer exhaustion meeting seller dominance—is the same everywhere.
- Context Is King: Notice how the pattern’s power was amplified by its location. For AAPL, it was at an all-time high. For BTC, it was at a major psychological resistance level. Where the signal appears is just as important as the signal itself.
- Patience Pays Off: A trader jumping the gun on the doji alone would have been early. The real key was waiting for the next candle to confirm the bearish sentiment. That confirmation validated the reversal signal and offered a much clearer, higher-probability entry.
Common Mistakes That Will Cost You Money
Spotting a Gravestone Doji is the easy part. The real skill—what separates the traders who grind out consistent profits from everyone else—is knowing how to handle the signal without falling for the classic traps.
A perfect-looking setup can quickly turn into a nasty loss. It’s usually not because the pattern lied, but because of a simple, avoidable mistake in execution. Honestly, knowing what not to do is just as important as knowing when to pull the trigger.
The Most Expensive Mistake: Jumping the Gun
By far, the most common and costly error is firing off a trade the second you see the Gravestone form, without waiting for any kind of confirmation. A trader sees that ominous inverted “T” at a resistance level and immediately smashes the sell button, convinced they've caught the exact top.
And then they watch in horror as the very next candle rips higher, stopping them out. This pattern is a warning sign, a flare in the dark signaling a potential reversal. It's not a guarantee.
The Gravestone Doji signals a stalemate that’s leaning bearish. Trading it before sellers have actually proven they’re in control isn't trading; it's gambling. Always, always wait for the next candle to back up your theory.
Wearing Blinders: Ignoring The Bigger Picture
Another critical error is getting tunnel vision. You see the candle pattern and forget everything else that's happening on the chart. A Gravestone Doji that pops up randomly in the middle of a choppy, directionless market is mostly noise.
But one that forms at a major, well-established resistance level after a long, screaming uptrend? Now that is a signal worth paying attention to. Context is everything in this game.
-
Mistake #1: Forgetting Confirmation: Never trade the Doji the moment it closes.
- The Fix: Wait for the next candle to close. If it closes below the low of the Gravestone, you have your proof. Sellers are following through.
-
Mistake #2: Ignoring Market Context: Trading a Doji just because it appeared.
- The Fix: Only give serious weight to a Gravestone that forms at a key technical level. Think major resistance zones, pivot points, or the peak of an overextended rally.
Sloppy Risk Management: Turning Small Losses Into Big Ones
Finally, even with a confirmed signal in the right context, you can still lose money if your risk management is sloppy. Two sins are particularly common here: setting your stop-loss way too tight or, even worse, not having a clear invalidation point at all.
Placing your stop just a few ticks above the Doji's high is asking for trouble. Normal market volatility—the random noise of price action—can easily wick you out of a perfectly good trade.
Your stop-loss needs room to breathe. The professional approach is to place it decisively above the high of that long upper shadow. That high represents the peak of failure for the bulls. If the price manages to break above that level, your entire bearish idea is wrong, and it’s time to get out of the trade with a small, managed loss.
Frequently Asked Questions
After digging into the charts and strategies, you're bound to have a few questions about the finer points of the gravestone doji candlestick. I've put together answers to the most common ones I hear from traders. Think of this as a final check-in to sharpen your understanding before you go hunting for this pattern on your own charts.
Let's clear up any confusion so you can trade this signal with real confidence.
What Is the Difference Between a Gravestone Doji and a Shooting Star?
At first glance, a Gravestone Doji and a Shooting Star look almost identical. Both pop up at the top of a trend and scream "potential reversal." But there's a tiny, crucial difference that tells a much bigger story: the candle's body.
A Gravestone Doji is a pure doji. Its open and close are at the exact same price (or extremely close). This leaves no real body at all, just a long upper shadow. It’s a sign of a complete and total smackdown of the bulls. Sellers didn’t just win the session; they pitched a perfect game.
A Shooting Star, on the other hand, has a small body at the bottom of the candle. This still shows that sellers took control, but it wasn’t an absolute rout. The bulls managed to hang on to a tiny piece of territory by the close.
To put it another way: the Shooting Star is a loud warning that sellers are gaining the upper hand. The Gravestone Doji is a definitive statement that they already own the field. The doji is the more extreme, more emphatic signal of the two.
How Reliable Is the Gravestone Doji Candlestick Pattern?
By itself, a Gravestone Doji is just a warning flare, not a guarantee the trend is over. Its reliability skyrockets when you treat it as a piece of a larger puzzle and wait for confirmation.
Think of it in layers. A standalone doji is moderately useful. But its power multiplies when other factors fall into place:
- Confirmation is King: This is the most critical step. Wait for the next candle to close below the doji’s low. This proves the sellers are following through on their initial push.
- Location, Location, Location: A doji at a major resistance level or after a long, overextended rally is far more potent than one that appears in the middle of nowhere.
- Volume Speaks Volumes: A spike in trading volume on the doji candle shows real conviction. It tells you a lot of money changed hands to slam the price back down.
When all three of these line up, the Gravestone Doji transforms from a simple warning into a high-probability reversal signal. Never trade it in isolation; use it as evidence within a solid trading plan that includes proper risk management.
Can a Gravestone Doji Appear in a Downtrend?
Yes, it absolutely can, but its meaning changes completely. When a Gravestone Doji forms during a downtrend, it is not a bearish reversal signal.
In this context, it signals indecision. It shows that buyers tried to spark a rally during the session—pushing the price up—but sellers ultimately crushed the attempt and forced the price to close right back where it started. It’s a sign of a brief struggle, a pause in the selling pressure, but it’s certainly not a bullish signal.
Most experienced price action traders will simply ignore a Gravestone Doji in a downtrend. It’s not actionable information. Instead, they’d be looking for clear bullish patterns, like a Dragonfly Doji or an engulfing candle, to suggest the bears are finally losing control.
At Colibri Trader, we teach you to master price action and trade with confidence, free from confusing indicators. Our step-by-step programs are designed to give you a clear, repeatable process for finding high-probability setups in any market. Discover your trading potential with our proven strategies.