


A Trader’s Guide to Forex Chart Patterns

Forex chart patterns are the visual footprints left behind by the constant tug-of-war between buyers and sellers. They form recurring shapes on your chart that can give you a powerful edge in figuring out where the market might be headed next.
Think of it this way: price action is a language, and chart patterns are the specific phrases and sentences that tell you a story. They translate what can often feel like complex, chaotic market movements into a clear narrative about whether a trend is likely to reverse or power ahead.
Why Forex Chart Patterns Are the Market's Language

Have you ever tried to follow a conversation in a language you don't speak? You might pick up on the tone or a familiar word here and there, but the real meaning is lost. For a lot of traders just starting out, that’s exactly what looking at a forex chart feels like—just a jumble of random up and down ticks.
Forex chart patterns are your translator. They turn that noise into a structured story.
These patterns aren't just arbitrary shapes; they're graphical representations of mass market psychology. They show us moments of collective indecision, points where a trend is running out of steam, and periods where conviction is building.
When you learn to spot these formations, you stop seeing just lines and start reading the underlying story of supply and demand. This is the bedrock of a pure price action trading approach, and it’s what frees you from relying on slow, lagging indicators.
The Two Families of Chart Patterns
Every single chart pattern you'll ever come across belongs to one of two main families. Getting this distinction down is the first real step toward building a trading strategy that makes sense. It helps you frame what the market is telling you and make a much better guess about what’s coming next.
The two families are:
- Reversal Patterns: These formations are like warning flares. They signal that the current trend is losing momentum and might be about to completely change direction. When you see one, it’s a sign that the dominant sentiment—whether bullish or bearish—is starting to crack.
- Continuation Patterns: Think of these shapes as the market taking a quick breather. They suggest that the price is just pausing for a bit before picking up steam and continuing in its original direction. They represent a temporary stalemate before the dominant trend reasserts itself.
A chart pattern is a visual record of the constant struggle between buyers and sellers. It’s not just a shape; it's a footprint of market sentiment that tells a story about who is winning the battle.
This simple framework makes your analysis much cleaner. Instead of trying to memorize dozens of patterns with no context, you can group them by the message they're sending. This approach ties in perfectly with understanding the bigger picture of market structure, because these patterns give you specific, actionable clues about potential turning points.
To make this even clearer, here’s a quick breakdown of the two categories.
Forex Chart Pattern Categories at a Glance
This table gives you a quick summary of the two primary types of chart patterns and what they signal to traders.
| Pattern Type | Market Signal | Common Examples |
|---|---|---|
| Reversal | Indicates a potential change in the current trend's direction. | Head and Shoulders, Double Tops/Bottoms, Wedges |
| Continuation | Suggests the current trend will likely resume after a pause. | Flags, Pennants, Triangles, Rectangles |
Think of this table as your starting point. As we dive into specific examples, you’ll see how each pattern fits neatly into one of these two camps, making them much easier to identify and trade.
Spotting When the Trend Is About to Break

If continuation patterns are about riding the wave, reversal patterns are your signal to get out of the water before the tide changes. These formations are some of the most powerful shapes you'll find on a chart because they can tip you off to a major shift in market direction, often before the rest of the crowd catches on.
They don’t just show up out of nowhere; they tell a story of a trend that’s losing its energy.
Think of an uptrend like a car driving uphill. As long as it has fuel (buying pressure), it keeps climbing. But what happens when it starts to sputter? It might try to surge forward one last time, fail, and then start rolling backward. Reversal patterns are the visual evidence of that sputtering engine—the final, failed attempt to keep the trend alive.
The Double Top and Double Bottom
The Double Top and Double Bottom are two of the most classic and visually obvious reversal patterns. They paint a clear picture of a powerful struggle at a key price level, where the dominant market force tries to push prices further and fails for a second time.
A Double Top looks like the letter "M." It forms at the peak of an uptrend when price hits resistance, pulls back, and then rallies to that same resistance level, only to get rejected again. This second failure is the key. It shows that the buyers who were once in control have run out of steam, and sellers are now stepping in with force.
On the flip side, a Double Bottom looks like a "W." It appears at the end of a downtrend when price hits a support level, bounces, and then falls back to test that same support again. This time, it finds strong buying pressure that prevents it from going lower, signaling that sellers are exhausted and buyers are starting to take over.
The Double Top pattern is historically one of the most effective reversal signals. In a comprehensive analysis by Thomas Bulkowski back in 2008, the Double Top had a success rate of roughly 73% in forecasting price drops after the pattern was confirmed.
How to Trade the Double Top Pattern
Trading this pattern requires patience and a clear plan. Just seeing two peaks isn't enough; you absolutely have to wait for confirmation.
- Identify the Two Peaks: Look for two distinct highs at roughly the same price level following a strong uptrend.
- Locate the Neckline: The "neckline" is the support level created by the lowest point of the valley between the two peaks.
- Wait for the Breakout: The pattern is only confirmed when the price breaks below this neckline. This is your cue to act. Our detailed guide on how to trade breakouts offers deeper insights into confirming these crucial moves.
- Entry and Stop-Loss: A common entry is to place a sell order just below the broken neckline. The stop-loss should be placed above the neckline or, for a more conservative approach, above the two peaks to protect against a false breakout.
- Projecting a Target: To set a profit target, measure the vertical distance from the peaks down to the neckline. Then, project that same distance downward from the breakout point.
The neckline in a Double Top or Head and Shoulders pattern is the line in the sand. A decisive break of this level is the market’s way of saying, "The old trend is over."
This methodical approach turns a simple shape on your chart into a high-probability trading setup, complete with clear rules for entry, exit, and managing your risk.
The Head and Shoulders Pattern
The Head and Shoulders is another powerhouse bearish reversal pattern, considered by many traders to be one of the most reliable. It's a bit more complex than a Double Top but tells an even more detailed story about the shifting balance between buyers and sellers.
The pattern is made up of three peaks:
- The Left Shoulder: A peak in the price, followed by a minor dip.
- The Head: A second, higher peak, showing the last major push by the buyers.
- The Right Shoulder: A third peak that is lower than the head and roughly in line with the left shoulder.
The neckline is a line drawn connecting the low points of the two troughs between the three peaks. Just like the Double Top, this pattern is only complete and actionable once the price breaks decisively below the neckline.
This formation is a beautiful illustration of a weakening uptrend. The head is the final climax of buying power. The lower high of the right shoulder shows that buyers no longer have the strength to push prices back to the previous peak. The break of the neckline that follows confirms that sellers have officially taken over.
Its bullish twin, the Inverse Head and Shoulders, is simply a mirror image that forms at the bottom of a downtrend and signals a potential move higher. The trading logic is the same, just inverted: you wait for a breakout above the neckline to confirm the bullish reversal.
Learning to Ride the Prevailing Trend
While reversal patterns are great for spotting when a trend might be hitting a wall, continuation patterns tell you when the market is just taking a breather. Honestly, most of my best trades have come from joining a powerful, existing trend, not trying to be a hero and call the exact top or bottom. Continuation patterns are your roadmap for doing just that.
Think of a strong trend like a long-distance runner. They don't sprint the entire way; they find a strong rhythm, take brief pauses to catch their breath, and then keep going. These chart patterns are how we spot those pauses, helping us tell the difference between a temporary rest stop and the actual finish line.
These formations signal a period of consolidation—a temporary stalemate where buyers and sellers are pretty evenly matched. But once that balance breaks, the dominant trend usually comes roaring back to life. Learning to spot these patterns is key to entering a trend with real confidence.
Decoding the Psychology of Flags
One of the most reliable continuation patterns you'll ever see is the Flag. It’s simple, clean on the chart, and tells a powerful story about what's happening behind the scenes. A Bull Flag forms during a strong uptrend, and its counterpart, the Bear Flag, shows up in a sharp downtrend.
The pattern has two key parts:
- The Flagpole: This is a sharp, almost vertical price move. It’s an explosion of buying (or selling) that establishes the immediate trend.
- The Flag: This is a small, rectangular consolidation that slopes against the trend. For a Bull Flag, it drifts slightly down; for a Bear Flag, it angles slightly up.
This structure tells you the trend is healthy. The flagpole shows massive conviction from one side of the market. The flag itself is just minor profit-taking or some weak counter-trend action, not a real shift in sentiment. Once those traders are out, the big players step back in, and the trend resumes. A core principle of my trading is learning how to effectively trade with the trend, and flag patterns are a perfect signal to get on board.
A Practical Playbook for Trading Bull Flags
Trading a Bull Flag isn't about jumping in blindly; it requires a disciplined, step-by-step approach. Patience is everything here.
- Step 1 Identify the Flagpole: Look for a strong, sharp move up. This isn't a slow grind—it should look like a burst of aggressive buying.
- Step 2 Draw the Flag: Once price starts to consolidate, connect the minor highs and minor lows with two parallel trendlines sloping downward. This channel is your flag. Ideally, you want to see volume dry up during this phase.
- Step 3 Wait for the Breakout: The trade is only on when the price breaks above the upper trendline of the flag. This breakout should, in a perfect world, happen on a surge of volume, confirming the buyers are back in control.
A key clue is that decreasing volume inside the flag. It suggests the sellers are weak and disorganized, making a continuation of the uptrend far more likely.
Once you get that confirmed breakout, your trade plan is straightforward.
- Entry: Go long on the candle that closes decisively above the flag's upper trendline.
- Stop-Loss: Place your stop just below the lowest point of the flag formation. This protects you if the pattern fails.
- Profit Target: A classic technique is to measure the height of the flagpole. Then, project that same distance upward from your breakout point to find a logical target.
Mastering the Symmetrical Triangle
Another classic continuation pattern is the Symmetrical Triangle. This pattern looks like coiling energy—a period of rising indecision where buyers and sellers are in a deadlock before one side finally overpowers the other.
It's formed by two converging trendlines—one connecting a series of lower highs, the other connecting higher lows. As price bounces between these lines, the trading range gets tighter and tighter, building up pressure for a big move. While it can break in either direction, it most often resolves in the direction of the trend that led into it.
Symmetrical triangles are a staple of forex charting. They represent market consolidation, plain and simple. Some studies suggest their success rate in forex can range from 60% to 70%, especially when volume drops off during the formation and then spikes on the breakout.
How to Trade a Triangle Breakout
The whole game with triangles is waiting for a clear, decisive breakout. All that coiled-up price action can lead to an explosive move, so you want to be ready.
- Identify the Preceding Trend: Was the market in a clear uptrend or downtrend before the triangle started forming? This gives you your directional bias.
- Draw the Converging Trendlines: You need at least two touches on the top line (lower highs) and two on the bottom line (higher lows) to draw it properly. The more touches, the stronger the pattern.
- Monitor for a Breakout: Your entry trigger is a candle closing decisively outside one of the trendlines. In an uptrend, you're looking for a break above the upper resistance line. In a downtrend, you're watching for a break below the lower support line.
Your risk management plan flows directly from the pattern's structure.
| Trade Component | Action for a Bullish Breakout | Action for a Bearish Breakout |
|---|---|---|
| Entry | Enter on a candle close above the upper trendline. | Enter on a candle close below the lower trendline. |
| Stop-Loss | Place just below the last swing low inside the triangle. | Place just above the last swing high inside the triangle. |
| Profit Target | Measure the widest part of the triangle and project that distance up from the breakout point. | Measure the widest part of the triangle and project that distance down from the breakout point. |
By using these continuation patterns, you stop trying to predict tops and bottoms and instead focus on high-probability spots to join a move that’s already underway. You're aligning your trades with the path of least resistance—and that’s a fundamental principle for any trader who wants to stay in this game for the long haul.
A Practical Framework For Trading Any Chart Pattern
Spotting a pattern on your chart is one thing. Actually executing a profitable trade from it? That's a completely different ballgame. I’ve seen countless traders get a rush of excitement when they see a familiar shape, only to jump in too early or completely bungle the trade management.
To get past the simple shape-spotting phase, you need a disciplined, repeatable framework.
This isn't some complex, secret formula. In fact, its power is in its simplicity. We're going to boil the entire process down to three distinct, non-negotiable steps. By sticking to this structure, you start replacing emotional, gut-feeling decisions with a logical, rules-based approach. The best part? It works for any of the forex chart patterns we've talked about.
Step 1: Identification
First things first, you have to correctly identify a valid pattern. This is a big one. It means you can't force a pattern onto a chart that isn't really there. A "good enough" Head and Shoulders or a sloppy-looking Flag is usually a trap set by the market. Your identification has to be strict, based on the clear, textbook rules of the pattern's anatomy.
Before you even think about a trade, ask yourself these questions:
- Is the prior trend obvious? A reversal pattern needs a solid trend to reverse, and a continuation pattern needs one to, well, continue. No trend, no trade.
- Are the key levels clean? Can you draw a crisp, undeniable neckline, trendline, or support/resistance boundary? If it's messy, walk away.
- Does the volume tell the same story? Think about a Bull Flag, for instance. You want to see volume dry up during that little consolidation phase. It shows the sellers are running out of steam.
If you get a "no" on any of these, it's not a high-quality setup. The traders who last in this business are patient. They wait for the crystal-clear patterns and happily let the ambiguous ones pass them by.
This simple flow chart shows exactly what we're looking for when trading a continuation pattern.
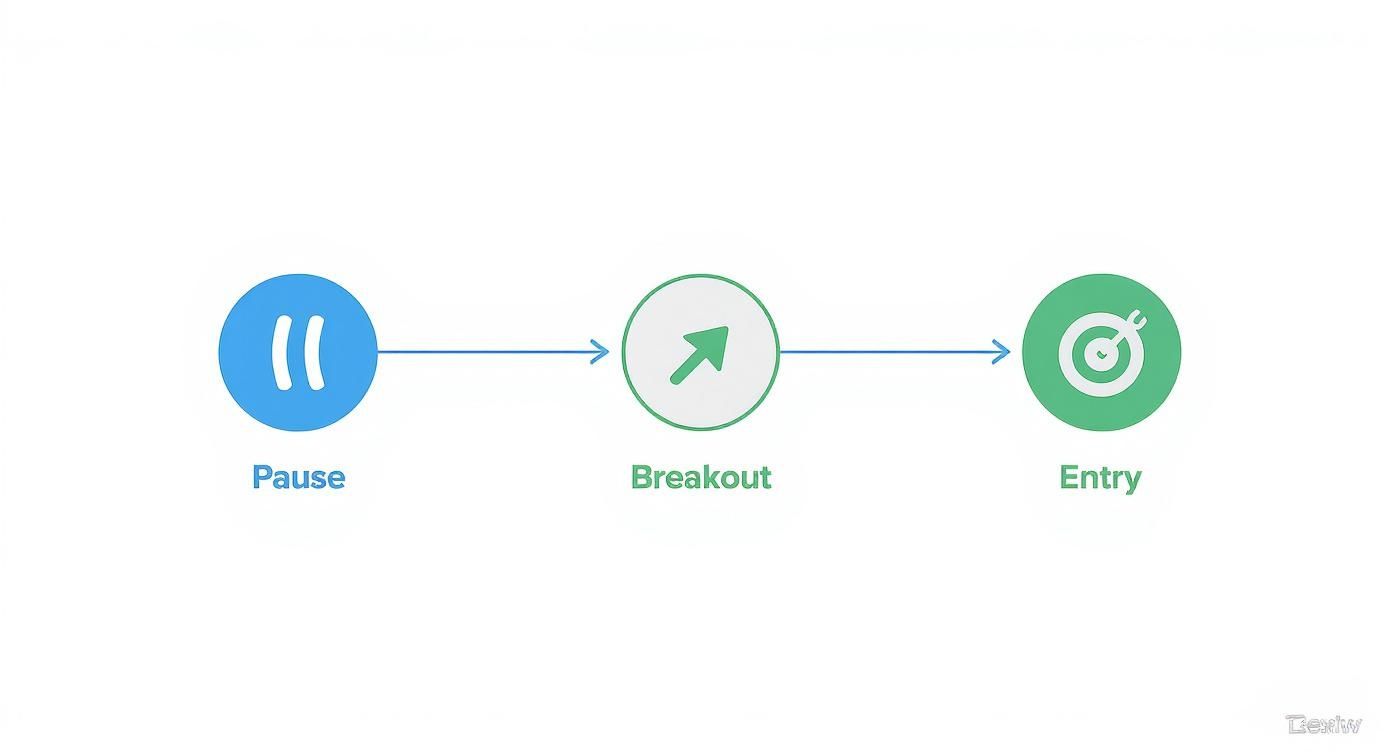
As you can see, that breakout is the critical moment that turns a simple consolidation into a real, actionable trading signal.
Step 2: Confirmation
This is the step that trips up most aspiring traders. They see the pattern forming and dive in before it’s confirmed, hoping to get a head start on the move. That isn’t trading; it's just gambling. A pattern is nothing but a potential setup until price breaks its critical boundary.
Confirmation is your shield against false signals. It’s the market’s way of giving you a nod of agreement before you risk a single penny. Patience here isn't a virtue; it's a requirement.
So, what does confirmation look like? For reversal patterns like the Head and Shoulders or a Double Top, it's a decisive candle close below the neckline. For continuation patterns like a Flag or Triangle, it's a decisive close outside the pattern's trendlines. Don't act just because price touches the line. Wait for that candle to close.
Step 3: Execution
Okay, you've identified a valid pattern and you've got your confirmation. Now it's time to execute, but only with a rock-solid risk management plan in place. Before you even think about clicking that "buy" or "sell" button, you absolutely must know three things: your entry price, your stop-loss, and your profit target.
This allows you to calculate your risk-to-reward ratio before you're in the heat of the moment. As a personal rule, I never take a trade with less than a 1:2 risk-to-reward potential. It just isn't worth it.
As you build out your own framework, getting familiar with these 8 essential day trading chart patterns will give you a massive leg up. To help with that, I've put together a quick-reference table for executing trades on some of the most common patterns you'll encounter.
Entry and Risk Management Rules for Key Chart Patterns
This table breaks down the standard approach for entering, setting your initial stop, and calculating a logical profit target for the major chart patterns. Think of it as a cheat sheet for the "Execution" step.
| Pattern Name | Entry Trigger | Initial Stop-Loss Placement | Profit Target Method |
|---|---|---|---|
| Head & Shoulders | Close below neckline | Above the right shoulder | Measure head-to-neckline distance; project down from breakout |
| Double Top | Close below the support level (neckline) | Above the double peaks | Measure peak-to-support distance; project down from breakout |
| Bull Flag | Close above the upper flag trendline | Below the lowest point of the flag | Measure the flagpole; project up from the breakout point |
| Symmetrical Triangle | Close outside of a trendline (with the trend) | Below the last swing low (for bullish break) | Measure the widest part of the triangle; project from breakout |
By systematically applying this three-step process—Identify, Confirm, Execute—you bring much-needed discipline and structure to your trading. You stop chasing random price wiggles and start trading based on a logical, repeatable plan with risk management at its very core.
Common Mistakes That Wreck Pattern Trading Strategies
Just being able to spot the classic forex chart patterns is a great start, but honestly, that’s only half the battle. So many traders learn to pick out a Head and Shoulders or a Bull Flag, yet they still find themselves losing money. Why? Because they stumble into the same predictable, costly traps over and over again.
These aren't rookie mistakes born from a lack of knowledge. They’re mistakes born from a lack of discipline.
Knowing what these pitfalls are is just as critical as knowing the patterns themselves. In my experience, the ability to sidestep these errors is what truly separates traders who are consistently profitable from those who feel like they're always one bad trade away from disaster. Let's break down the big ones.
Mistake 1: Seeing Patterns That Are Not There
This is, without a doubt, the most common error I see. It’s almost always driven by impatience and that nagging feeling that you need to be in a trade. A trader will stare at a chart, absolutely convinced they can make out the faint shape of a pattern, and then force it to fit their bias.
You see it all the time—trendlines drawn right through the middle of candle bodies, or someone calling a "Head and Shoulders" where the right shoulder is actually higher than the head. This is pure confirmation bias. You want a trade so badly that your brain manufactures a reason to take one, even if the pattern is messy and invalid.
The Rule to Follow: If you have to squint to see it, it’s not there. A genuine, high-probability setup should practically jump off the chart at you. Patience pays; forcing trades costs.
Mistake 2: Trading Before Confirmation
And here's impatience striking again. A trader correctly identifies a picture-perfect Double Top. They see the price moving toward the neckline and, wanting to get in early for a bigger profit, they jump into a short position before the neckline actually breaks.
What happens next is painfully predictable. The price might just kiss the neckline, find support, and rocket back up in its original trend, stopping them out for a loss. That pattern was just a potential setup. It's not real until the breakout confirms it. Waiting for that candle to close below the neckline isn't optional—it's essential.
Mistake 3: Ignoring the Broader Market Context
No chart pattern, no matter how perfect it looks, exists in a vacuum. A beautiful Bull Flag that forms right underneath a major weekly resistance level is a sucker's bet. Similarly, trying to short a bearish Double Top when there's overwhelmingly bullish news driving the market is like trying to swim against a powerful current.
You have to zoom out. Before you even think about placing a trade, ask yourself a few simple questions:
- What's the trend on the higher timeframes? A continuation pattern is far more likely to work out if it's flowing in the same direction as the daily or weekly trend.
- Are there any major support or resistance levels nearby? A pattern’s profit target might look great on paper, but it’s useless if there’s a massive price barrier sitting right in its way.
- Is there big news coming out? A high-impact data release like Non-Farm Payrolls can blow any technical pattern to smithereens.
This bigger-picture view gives you the context you need to decide if a pattern is actually worth the risk. Ignoring it is like trying to navigate a ship while only looking at a map of your own cabin. You might not see any immediate danger, but you could be sailing straight into a hurricane.
Your Questions Answered
Even after getting a good feel for the major patterns, questions always pop up.## Your Questions Answered
Even after getting a good feel for the major patterns, questions always pop up. That’s normal. Trading is a hands-on skill, and the real challenge is bridging the gap between textbook theory and what you see on a live chart.
This section is all about giving you direct, no-nonsense answers to the most common questions I hear about trading forex chart patterns. My goal is to clear up the confusion and reinforce the clean, indicator-free price action approach we live by.
What Timeframes Are Best for Pattern Trading?
This is a big one, and the honest answer is: it really depends on your trading style. However, I can tell you from experience that patterns on higher timeframes (like the 4-Hour, Daily, and Weekly charts) are far more reliable. They filter out the market noise and represent bigger, more meaningful shifts in trader sentiment.
Think about it. A Head and Shoulders pattern playing out over several weeks on a daily chart carries so much more weight than one that forms and fails in ten minutes on a 5-minute chart. While patterns can appear anywhere, beginners should absolutely stick to the higher timeframes. It's the best way to learn the mechanics without the stress of lightning-fast price moves.
How Reliable Are Chart Patterns, Really?
Let's be crystal clear: no chart pattern is 100% accurate. If anyone tells you otherwise, they’re selling snake oil. The power of chart patterns isn’t in winning every single trade; it’s about putting the statistical odds in your favor over a long series of trades.
Well-formed, textbook patterns like a clean Head and Shoulders or a Double Top are often cited as having a reliability rate of over 70%. But that number always hinges on the right market conditions and, most importantly, proper confirmation before you jump in.
The point of using chart patterns isn't to find a magic crystal ball. It’s to identify high-probability setups where the potential reward you stand to gain dwarfs the risk you have to take.
Treat patterns like a weather forecast. They give you a strong heads-up about what’s likely to happen, but you still need your risk management—your umbrella—ready in case the forecast gets it wrong.
Do I Need Other Indicators with Chart Patterns?
In a pure price action methodology, the answer is a firm no. The whole philosophy is built on the idea that price itself tells you everything you need to know. Tacking on lagging indicators like the RSI or MACD usually just clutters your charts and creates "analysis paralysis" with conflicting signals.
Instead of adding indicators, learn to confirm patterns with other raw price action clues:
- Volume Analysis: A big spike in volume as price breaks a neckline is powerful confirmation. It shows conviction.
- Candlestick Formations: A massive bearish engulfing candle breaking the support of a Double Top adds serious weight to the setup.
- Higher-Timeframe Context: Is your 4-Hour bullish flag forming within a larger Daily uptrend? That’s the kind of alignment you want to see.
By keeping your charts clean, you train yourself to read the story the market is telling you directly. And price is always the most honest, immediate source of information you have.
At Colibri Trader, we teach you how to master the art of price action, giving you the skills to trade confidently without relying on messy indicators. Start your journey to consistent profitability today.
Learn more at Colibri Trader