


Trading the Falling Wedge Pattern A Bullish Reversal Guide
The falling wedge pattern is a classic bullish reversal signal that often marks the end of a downtrend. I like to think of it as a tightly coiled spring. As the price grinds lower, it compresses, building up kinetic energy for a powerful upward launch. It’s a sign that sellers are losing their grip, setting the stage for a potential rally.
Unpacking the Psychology of the Falling Wedge

At its heart, the falling wedge tells a story about the changing tide of market sentiment. It’s a visual representation of a battle where the sellers are slowly getting tired, while the buyers quietly start to step in. Grasping this dynamic is absolutely essential if you want to trade this setup with any success.
Picture an asset that's been bleeding value in a steady downtrend. In the beginning, sellers are firmly in the driver's seat, pushing the price down without much of a fight. But as the wedge begins to form, something subtle starts to shift. The downward swings get shorter and the slope of the decline starts to flatten out.
For traders just getting started, here’s a quick rundown of what makes this pattern tick.
Falling Wedge Pattern at a Glance
| Characteristic | Description |
|---|---|
| Pattern Type | Bullish Reversal |
| Prior Trend | Downtrend is required. |
| Structure | Two converging trendlines, both sloped downwards. |
| Volume | Typically decreases as the pattern forms and spikes on the breakout. |
| Breakout | Price breaks upward through the upper resistance trendline. |
| Psychology | Signals seller exhaustion and increasing buyer interest. |
This table gives you the bare bones, but the real magic is in understanding the story the chart is telling.
The Story Behind the Trendlines
The entire pattern is framed by two trendlines that are squeezing closer together, both pointing down. The top line connects the series of lower highs, and the bottom line connects the lower lows. This convergence is the most important clue—it tells you that the price range is tightening up and volatility is drying out.
This tightening action reveals a few crucial psychological insights:
- Seller Exhaustion: The bears are still managing to push the price down to create lower highs, but they just don't have the muscle to force significantly lower lows. Their momentum is clearly fading.
- Early Accumulation: Smart money is starting to nibble. Buyers are beginning to enter the market at slightly higher price points, even while the overall trend is still down. This quiet buying activity is what prevents the price from dropping as sharply as it did before.
- A Tense Standoff: The market eventually finds a temporary balance. Neither side is in control, and the contracting price action is a perfect reflection of this indecision. This consolidation phase often happens on declining volume, which is another great tell that selling interest is drying up.
Essentially, the falling wedge shows a market where sellers are running out of steam and buyers are discreetly building their positions. The narrowing of the pattern is like the final squeeze before all that pent-up pressure is released, usually in an explosive move to the upside.
This visual cue gives us a clear signal that demand is about to overpower supply. For traders looking to understand the bigger picture, you can learn more about different wedge trading patterns and see how they all fit together.
Ultimately, the buying pressure builds until the exhausted sellers can no longer hold the line. The price then breaks decisively through the upper resistance trendline, confirming that the downtrend is likely over and a new bullish chapter is beginning. This breakout is the primary signal that traders are waiting for to go long, anticipating a significant reversal.
How to Identify the Falling Wedge on Any Chart

Spotting a high-quality falling wedge pattern as it forms is a skill that separates reactive traders from the ones who are thinking two steps ahead. It’s like learning to read the market’s body language—certain shapes and sequences give you a heads-up about what could happen next.
A falling wedge isn't just a random shape on your screen; it's a specific story of price action unfolding with a clear anatomy. You need to be able to find its three core components working in harmony. Think of it as a checklist. If even one piece is missing, the pattern is probably a dud, and you're better off waiting for a clearer setup.
This kind of discipline is exactly what keeps traders from seeing ghosts in the charts.
The Essential Anatomy of a Falling Wedge
First things first: a falling wedge needs a clear preceding downtrend. This is non-negotiable. This is a reversal pattern, after all, and you can't have a reversal without something to reverse. That initial downtrend shows that sellers have been firmly in control, setting the stage for a potential shift in power.
Next, you need to draw the two trendlines that give the wedge its shape. Both lines will point downwards, but they won't be parallel. The upper line connects the lower highs, acting as resistance. The lower line connects the lower lows, acting as support.
Here’s the critical detail: the lower trendline (support) must be steeper than the upper one (resistance). This is what creates that classic converging shape and tells you that the bears are losing their grip. The price swings down are becoming less aggressive, hinting that buyers are stepping in earlier and with more conviction each time.
A proper falling wedge needs at least three touches on both the upper and lower trendlines. Some traders get away with two, but the "rule of three" really confirms that these levels are significant and respected by the market—not just a coincidence.
This structure of converging lines and multiple tests is the visual proof of a market coiling up, building energy for its next big move.
Confirming the Pattern with Volume
Price tells a great story, but volume confirms it. One of the most reliable clues you can get for a falling wedge is watching the trading volume dry up as the pattern develops. This is a massive tell that the sellers are getting exhausted.
Think about it: the initial downtrend had high volume, showing strong selling conviction. But as price gets squeezed into the wedge, the volume should ideally fade away. This tells you the players who were pushing the price down are running out of steam or losing interest.
The ideal "volume signature" has two parts:
- Diminishing Volume: As the wedge tightens, you want to see volume trail off. This signals that the selling momentum is dying.
- Volume Spike on Breakout: When price finally punches through the upper resistance line, it absolutely must be on a big spike in volume. This surge is your confirmation that buyers have stormed the field with conviction, giving the breakout real strength.
A breakout on weak volume is a huge red flag. It often means there's no real firepower behind the move, dramatically increasing the odds of a "fakeout" where price slumps right back into the pattern.
Cross-Market and Timeframe Examples
The real beauty of the falling wedge is that it shows up everywhere. It’s a universal pattern you’ll find across forex, crypto, stocks, and commodities. It works on a 15-minute chart for a day trader just as well as it does on a weekly chart for a position trader.
- Forex Example (EUR/USD, 4-Hour Chart): A swing trader might see a falling wedge take shape after a week-long slide. The contracting price and falling volume are classic signs of a potential bottom, setting up a nice long entry.
- Crypto Example (BTC/USD, Daily Chart): After a brutal, multi-month bear market, a massive falling wedge could form. A breakout from a pattern this large, confirmed by a volume explosion, could signal a major trend reversal for the entire market.
- Stock Example (AAPL, 1-Hour Chart): During a single trading day, a strong stock might pull back in a falling wedge. This is a classic continuation setup, allowing traders to jump in before the next leg of the primary uptrend.
Once you train your eye to see these components—the prior downtrend, the converging lines with multiple touches, and the all-important volume signature—you'll start spotting these setups with confidence on any chart you pull up.
A Step-by-Step Guide to Trading the Breakout
Spotting a clean falling wedge pattern is one thing, but actually trading it profitably is a different beast altogether. This is where the rubber meets the road. A solid, repeatable plan is what separates professional traders from gamblers. It strips the emotion out of the equation and gives you a clear roadmap for every step of the trade.
This all comes down to three things: your entry trigger, where you place your stop-loss, and how you set your profit target. Without these three pillars, you're just guessing. Each one works with the others to keep your risk in check while giving the trade room to run. Let’s break down exactly how I build a trading plan for this pattern.
Pinpointing the Entry Trigger
The biggest mistake I see traders make is jumping the gun. They see the price just barely poke its head above the upper trendline and they dive in headfirst. Don't do this. It's a classic recipe for getting chopped up in a "fakeout," where the price teases a breakout only to slump right back inside the pattern.
To avoid that trap, you need confirmation. The gold standard for a real breakout is a decisive candlestick close above the upper resistance trendline. That means you have to be patient enough to wait for the current candle—whether it's a 1-hour, 4-hour, or daily—to fully close outside the wedge.
For me, a great entry signal has two key ingredients:
- A Strong Close: The candle needs to close with authority, well above the trendline. A big, bullish candle like a marubozu or a solid green bar shows real conviction from buyers. It tells you they mean business.
- A Surge in Volume: As we’ve talked about, a real breakout needs fuel. That fuel is volume. A big spike in trading volume confirms that the big players—the institutional money—are behind the move. That’s what gives it the momentum to follow through.
Waiting for a confirmed close with high volume is the single best filter I know for weeding out false signals. It forces you to trade what the market is actually doing, not what you hope it will do. That's the core of disciplined trading.
Once both of those conditions are met, I'll typically look to place my entry just above the high of that powerful breakout candle. This gets me into the trade just as the new momentum is kicking in. Learning to wait for this setup is a game-changer, and you can dive deeper into these kinds of strategies by learning how to trade breakouts effectively.
Setting a Protective Stop-Loss
Every single trade needs an exit plan for when things go wrong. A stop-loss isn’t about being negative; it's about protecting your capital so you can live to trade another day. It’s non-negotiable. Luckily, with the falling wedge, the placement is incredibly logical.
The best spot for your stop-loss is just below the most recent swing low that formed inside the wedge right before the breakout. Think about it—that level was the last stand where buyers stepped up and pushed the price higher.
If the market breaks out, then reverses with enough force to take out that previous low, the entire bullish idea behind the pattern is dead. The breakout has failed, and you don’t want to be in that trade anymore. Placing your stop there gets you out at the exact point the pattern's structure has broken down.
Calculating Your Profit Target
The final piece of the puzzle is knowing where to cash in your chips. While you can always use old-school support and resistance levels, the falling wedge pattern gives you a handy, built-in way to calculate a primary profit target.
It’s a simple and objective method that pros have been using for decades.
The Measurement Technique
- Measure the Height: Find the widest part of the wedge, measuring the vertical distance from the upper resistance line down to the lower support line. This distance represents all the coiled-up energy built during the consolidation.
- Project from the Breakout: Take that exact height and project it upward, starting from the point where the price broke out of the upper trendline.
- Set Your Target: The level at the top of that projected line becomes your minimum profit target.
This technique gives you a logical target based on the pattern’s own volatility and size. The idea is that the energy released in the breakout will be proportional to the energy stored during its formation. I often use this as my first target (T1). If the new trend looks especially strong, I might take some profit off the table and let the rest of the position run.
How Well Does the Falling Wedge Actually Work?
It's one thing to see a pattern on a chart and understand the logic. It's another thing entirely to trust it with real money. So, why should you even bother with the falling wedge pattern? The answer comes down to moving beyond hope and into the world of probabilities—the only place a professional trader can really operate.
A chart pattern is just a picture of market psychology, a recurring footprint left behind by buyers and sellers. Its reliability comes from a statistical edge, plain and simple. By digging into the numbers, we can set realistic expectations and see why this pattern offers a genuine advantage when traded with a solid plan.
A Look at the Historical Data
So, what does the data say? A massive study of 9,147 falling wedge examples across different markets over the past 10 years gives us some pretty clear answers. The pattern has a reported accuracy rate of 48%. Now, that might sound like a coin flip, but that's not the whole story.
The real magic is in the profitability. The average return for winning trades was a powerful 3.5:1 risk-reward ratio. This turns what seems like a 50/50 shot into a net profitable strategy over time. If you want to dive deeper, you can explore the full breakdown of these powerful pattern statistics and see how they compare.
This is a crucial lesson in trading: you don't need to win all the time to make money. A strategy with a modest win rate can be incredibly profitable if your winners are significantly bigger than your losers. The falling wedge is a textbook example of this principle in action.
A pattern’s edge isn't just about how often it works; it's about how much you make when it works versus how much you lose when it doesn't. The falling wedge's strong risk-to-reward profile is what makes it a professional's tool.
Drilling down, the data also shows that performance changes quite a bit depending on the timeframe. The daily chart seems to be the sweet spot, boasting the highest win rate of 59% across 476 trades. On the flip side, jumping down to a 1-second chart shows a shaky 34% success rate, where noise and false signals are rampant. This just reinforces what experienced traders already know: patterns that take longer to form are generally more reliable.
Visualizing the Trading Plan
A good plan for trading a falling wedge breakout is simple. You need a clear entry trigger, a non-negotiable stop-loss, and a logical target. This infographic boils the core strategy down to its essential parts.
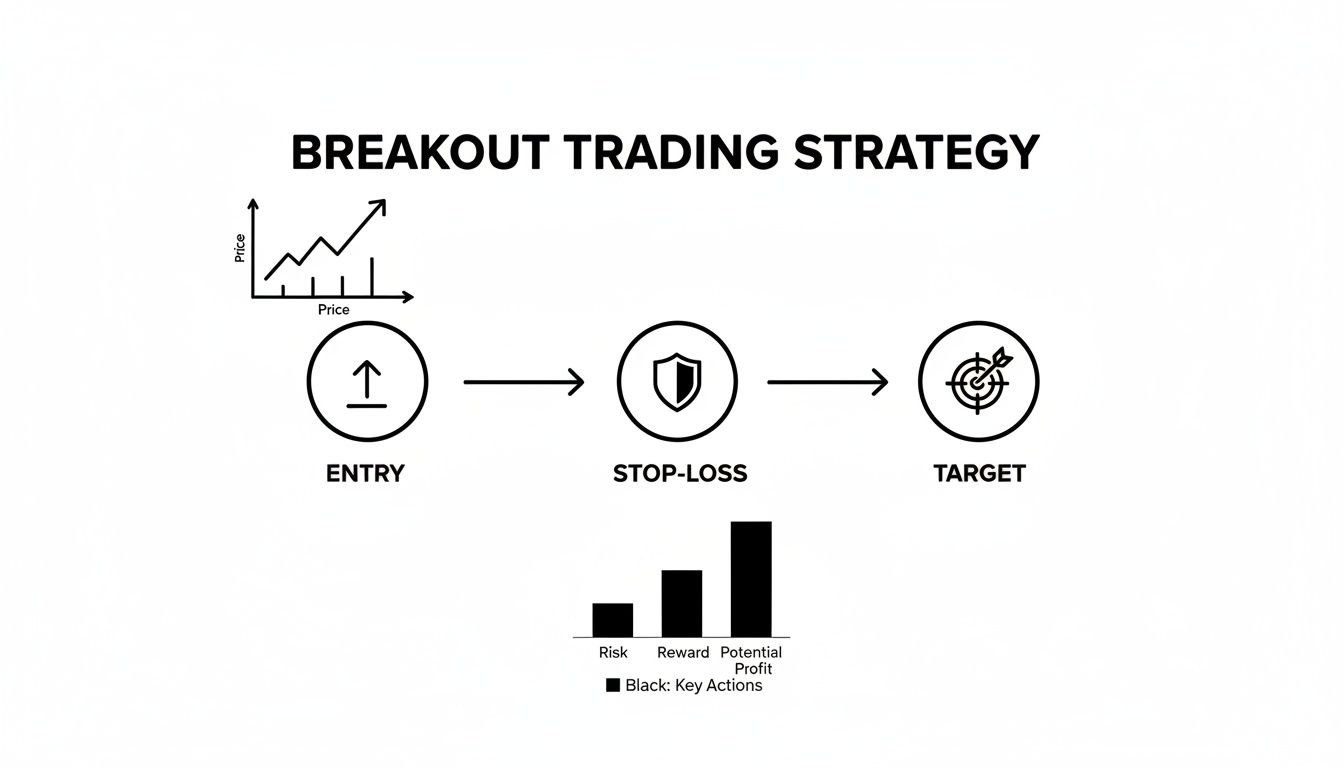
This visual shows exactly how to set up a trade with a positive risk-to-reward ratio. That's the key to making the pattern's statistical edge work for you over the long haul.
Building Real Confidence in Your Strategy
Once you understand these performance numbers, you can trade with a clear head. You know that not every breakout is going to be a home run. But you also know the odds are tilted in your favor if you stick to the plan. This is especially true in a wild market like crypto, where volatility can be your best friend or your worst enemy.
For crypto traders looking to get an extra edge, it's also smart to utilize essential crypto market tools like a blockchain explorer. This can give you another layer of insight into what’s happening behind the price action, like asset flows and network activity.
At the end of the day, the data confirms that the falling wedge isn't just some random shape. It's a statistically significant pattern that signals a high-probability shift from sellers to buyers. When you combine this knowledge with disciplined trading—waiting for confirmation, managing your risk, and setting realistic targets—you can truly tap into its power.
Advanced Techniques to Avoid False Breakouts

Let's be real: not every falling wedge pattern you spot is going to print money. One of the biggest hurdles traders face is the infamous "false breakout"—or fakeout. This is where the price pokes its head above resistance, suckering in eager buyers, only to slam back down inside the wedge. It’s a classic trap.
These fakeouts are designed to prey on emotions and catch undisciplined traders off guard. But you can learn to sidestep most of them by adding a few extra layers of analysis. It’s about more than just seeing the price cross a line; you need to hunt for multiple, independent signals that all point to the same conclusion.
This process of stacking confirmations is a cornerstone of professional trading. To get a better handle on this, I highly recommend digging into the concept of confluence in trading, as it’s what separates flimsy setups from rock-solid ones.
Use Bullish Divergence as a Secret Weapon
One of my favorite confirmation tools is bullish divergence. This little gem appears when the price on your chart keeps grinding out lower lows—just like it should inside a falling wedge—but a momentum oscillator like the RSI starts making higher lows.
Think of it like this: the price is still visibly weak, but underneath the surface, the selling momentum is drying up. It's a massive clue that sellers are running out of steam, often before the price actually breaks out. It’s like feeling the tide shift long before the waves change direction.
When you spot bullish divergence on the RSI or MACD while a falling wedge is taking shape, the probability of a genuine upside breakout skyrockets. It acts as a leading indicator, confirming the story the pattern is trying to tell you.
Finding divergence takes patience and a trained eye, but it’s an incredible way to build conviction in a trade before you even think about hitting the buy button.
Why Volume Is a Non-Negotiable Confirmation
I've mentioned volume before, but it's so critical for dodging traps that it deserves its own spotlight. A breakout that occurs on weak, anemic volume is a huge red flag that experienced traders learn to avoid at all costs. It signals a lack of conviction and, more importantly, a lack of institutional buying power.
A legitimate, powerful breakout should feel explosive, and that energy shows up in the volume bars. You want to see a significant spike in trading activity as the price pushes through resistance. This surge tells you that the "big money" is behind the move, providing the fuel needed to sustain a new rally.
Here’s a simple volume checklist to keep in mind:
- Decreasing Volume: As the wedge forms, volume should ideally be tapering off. This shows that sellers are getting tired.
- Volume Spike: The breakout candle—the one that closes firmly above the upper trendline—must be accompanied by volume that is noticeably higher than the recent average.
- Continued Volume: The next few candles should also show solid volume, proving that buyers are following through and defending the new price level.
A breakout without this volume signature is often just noise. The price might pierce resistance just long enough to hunt the stop-loss orders from short-sellers before reversing hard. Always, always wait for volume to validate the price action. Combine price, momentum, and volume, and you’ll dramatically improve your odds of sidestepping those frustrating fakeouts.
Frequently Asked Questions About the Falling Wedge
Even when you feel you’ve got a handle on the falling wedge pattern, some questions always pop up when you start applying it to live charts. This section is all about tackling those common queries head-on, giving you clear, practical answers to help you trade the pattern with more confidence.
What Is the Difference Between a Falling Wedge and a Descending Triangle?
This is probably one of the most critical distinctions you need to master. Getting these two mixed up is an easy way to end up on the wrong side of a big move.
At first glance, they look similar. Both can show up in a downtrend, and both have a top trendline that slopes downwards. The real difference—the one that changes everything—is the bottom trendline.
A falling wedge has two converging, downward-sloping trendlines. The key here is that both lines are pointing down, but the lower support line is steeper. This tells you that sellers are getting tired; they can't push the price down as far with each attempt. This compression is classic bullish behaviour, signaling a potential reversal.
A descending triangle, on the other hand, has a declining upper trendline but a flat, horizontal lower trendline. That flat support is like a floor price is bouncing off of. Sellers keep hammering away at that same level, and buyers just don't have the strength to make higher highs. This is a bearish setup, and it usually breaks down through that floor.
Think of it like this: a falling wedge is a spring being coiled tighter and tighter, building up energy for a pop to the upside. A descending triangle is someone repeatedly hitting a nail; eventually, it's going to break through to the downside.
How Reliable Is the Falling Wedge Pattern in Crypto Markets?
The falling wedge is a particularly effective pattern in crypto. Why? Because crypto markets are often driven by momentum and high volatility. These periods of consolidation, like a wedge, often act as the launching pad for explosive moves.
The data seems to back this up. Analysis from charting platforms like TradingView suggests that in over 82% of cases, the price exit from a falling wedge on major crypto pairs is to the upside. That makes it one of the more dependable reversal signals out there. Even better, the standard price target (measured from the height of the wedge) is hit in a staggering 63% to 88% of those breakouts.
But here’s the crucial part: crypto's volatility is a double-edged sword. It can also produce some seriously nasty fakeouts. This is why confirmation isn't just a "nice to have"—it's an absolute must. You have to wait for a breakout candle to close with a clear, undeniable surge in trading volume. It’s the best way to know the move is for real.
Can the Falling Wedge Act as a Continuation Pattern?
Yes, absolutely. While we mostly talk about it as a bullish reversal pattern at the bottom of a downtrend, the falling wedge can also show up as a bullish continuation pattern.
Here’s how it happens. During a strong, established uptrend, the market will naturally pull back or consolidate to catch its breath. Sometimes, this little corrective phase takes the shape of a falling wedge. It’s just a temporary pause where some profit-taking is happening before the main uptrend gets going again.
In this context, the pattern is still showing you that selling pressure is fading, but it’s doing so within a bigger bullish picture. The breakout to the upside doesn’t signal a major trend change; it just signals the end of the pullback. This gives you a great, high-probability spot to either add to your long position or jump in on the next leg up.
How Long Does a Falling Wedge Take to Form?
There’s no set time limit. The pattern’s duration is all relative to the timeframe you're trading. A day trader might see a wedge form over a few hours on a 15-minute chart, while a position trader could watch one develop over several months on a daily or weekly chart.
As a general rule, the longer a pattern takes to form, the more significant it is. A longer formation usually leads to a more powerful and sustained breakout. It simply gives the market more time to absorb all the selling pressure, building a much stronger base for the reversal.
Some studies offer good guidelines. For a pattern to be considered really solid, it should follow a prior downtrend of at least three months. The wedge itself often takes anywhere from 3 to 6 months to form on a daily chart. This longer timeframe allows the classic "signature" of the pattern to really take shape:
- Structure: A clean series of lower highs and lower lows with multiple, distinct touches on both trendlines.
- Volume: A clear drop-off in trading volume as the pattern tightens, showing that sellers are running out of steam.
- Breakout: A powerful push through resistance on a big spike in volume, confirming that buyers have taken control.
A well-defined wedge that has had time to mature after a long downtrend will always be more reliable than one that pops up quickly.
At Colibri Trader, we teach traders how to master price action patterns like the falling wedge without relying on confusing indicators. Our action-based programs are designed to build your skills and confidence, transforming your trading performance for consistent results. Take our free Trading Potential Quiz to get started.