


Trading the Evening Star Candlestick Pattern
The evening star pattern is a classic bearish reversal signal made up of three candles. For price action traders, it’s one of the most reliable signs that an uptrend might be running out of steam and getting ready to roll over.
Think of it as a short story playing out on your charts—a story of buyers losing their grip, sentiment shifting on a dime, and sellers finally stepping in to take charge.
The Story of the Evening Star Pattern
Picture this: a market has been climbing, with buyers feeling confident and pushing prices higher and higher. That’s the first part of our story. Then, suddenly, the rally stalls. The upward momentum vanishes, replaced by a moment of quiet uncertainty.
Finally, the story ends with a decisive drop, confirming the bears have wrestled control away from the bulls. This simple three-act narrative is exactly what the evening star candlestick pattern shows us.
For a trader, this isn't just a random formation. It's a massive visual clue that a market top could be forming. Spotting it early can be your cue to take profits on long positions or start hunting for a short entry. It’s a red flag waving, signaling the bullish party is probably over.
Understanding the Three Acts
The pattern’s power comes from the clear psychological drama it reveals over three consecutive candles. Each one plays a critical role in this story of reversal.
Let's break down the anatomy of the evening star pattern. Each candle tells a piece of the story about the shifting balance of power between buyers and sellers.
| Candle | Appearance | Psychological Meaning |
|---|---|---|
| Candle 1 | A strong, long bullish candle. | Confidence: Buyers are in complete control, confidently pushing the price higher and continuing the existing uptrend. |
| Candle 2 | A small-bodied candle (the "star"). | Indecision: Buying pressure has stalled out. The market is hesitating, unable to push higher, signaling equilibrium. |
| Candle 3 | A long, decisive bearish candle. | Takeover: Sellers have overwhelmed the buyers. They push the price down aggressively, often erasing the gains of the first candle. |
This clear progression from bullish strength to indecision, and finally to a bearish takeover, is what makes the evening star such a compelling signal.
This formation is a cornerstone of technical analysis and just one of many signals you'll find in the world of Japanese candlestick patterns.
At its core, the evening star represents a critical transition from market greed to fear. The initial bullish strength gives way to hesitation, which is then resolved by a powerful move from sellers, confirming a shift in market control.
Learning to spot this pattern isn't just about memorizing shapes; it's about reading the market's underlying story. It gives you a structured way to anticipate potential tops, which is a massive edge for timing your trades and managing risk.
Once you understand the simple narrative behind it, you start to see the market's psychology with much greater clarity. That insight is what builds a truly robust price-action trading strategy.
How to Identify the Evening Star Pattern
Spotting a high-probability evening star isn’t about seeing three random candles and hoping for the best. It's more like a pilot running a pre-flight checklist—each item has to be ticked off before the setup is considered valid and ready for takeoff.
This three-candle pattern tells a very specific story: a power shift from buyers to sellers. But for that story to be believable, each character (or candle) has to play its part perfectly. And it all starts with the right setting: a clear, established uptrend. Without that, the pattern is meaningless.
The Three-Candle Checklist
To properly identify an evening star, you need to break down the sequence, candle by candle. Each one has a job to do, and if one fails, the whole signal's potential crumbles. Let's get into the strict rules for each candle.
-
Candle One: The Bullish Confirmation. The first candle needs to be a strong, decisive bullish bar. Think of a long real body with small wicks. This visually confirms that buyers are firmly in control, confidently pushing the price higher. A small, weak-looking bullish candle here just waters down the entire setup.
-
Candle Two: The Star of Indecision. This is the centerpiece, the turning point. The second candle must have a small body, like a spinning top or a doji, signaling that the market has suddenly hit the brakes. Critically, its body should gap up from the close of the first candle. That visible space is key, highlighting the abrupt stall in bullish momentum.
-
Candle Three: The Bearish Takeover. The final candle is what seals the deal. It must be a strong bearish candle that closes deep into the body of the first candle. For a truly powerful signal, you want to see this candle close below the 50% midpoint of the first candle’s body. This is the proof that sellers have wrestled control away from the buyers.
This decision tree gives you a great visual walkthrough of the process, helping you ask the right questions when you think you've found a setup.
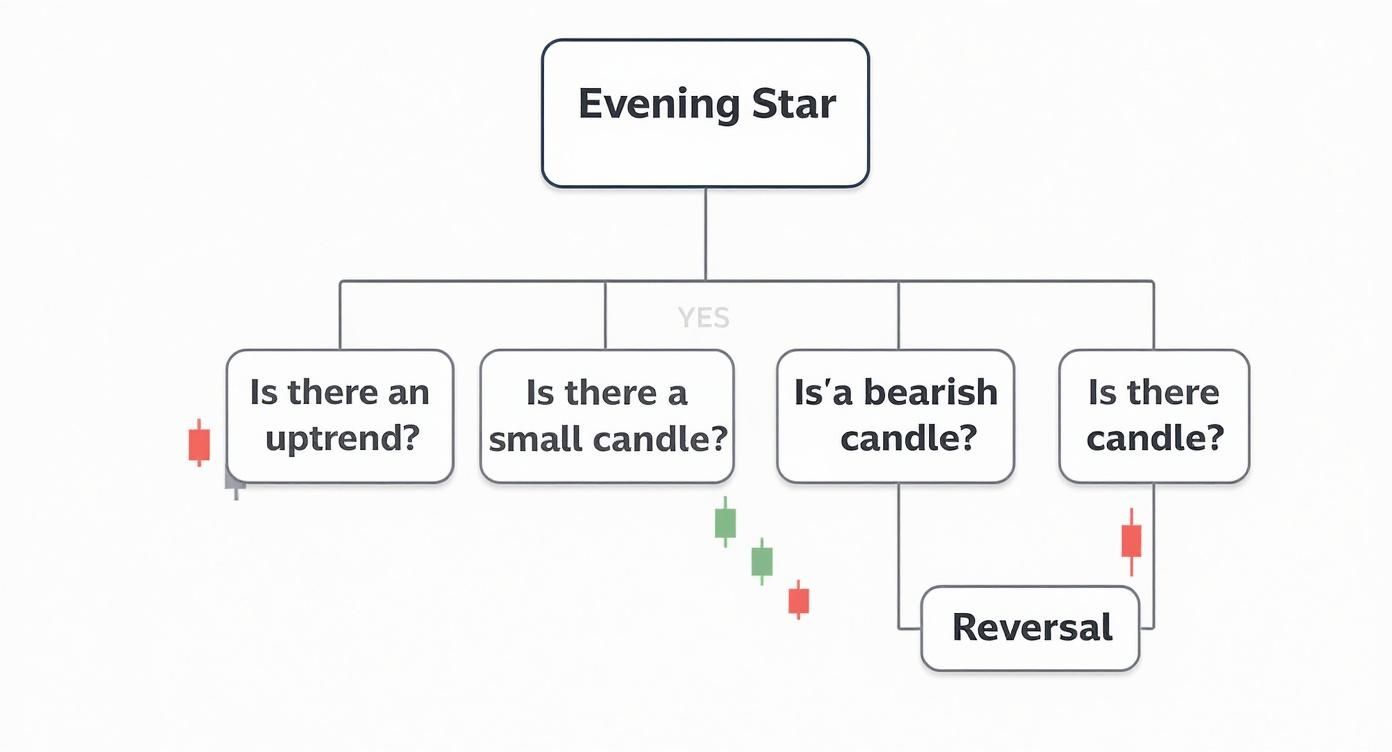
As the guide shows, the pattern's reliability is built on this sequence of events: an existing uptrend, a moment of indecision at the peak, and a strong bearish confirmation.
The Crucial Role of Gaps
While you won't see them every time, gaps supercharge the evening star pattern. They add another layer of conviction to the bearish story. There are two potential gaps to watch for.
-
The Gap Up to the Star: The first gap appears between the close of the bullish candle and the open of the star. This gap represents one last, final gasp of bullish enthusiasm right before it vanishes.
-
The Gap Down from the Star: This is the second and more powerful gap. It forms between the close of the star and the open of the third bearish candle. A gap down like this is a clear sign of seller panic and urgency, confirming the sentiment has flipped.
When both gaps are present, the pattern is known as an Abandoned Baby. This is the most potent version of the evening star you'll find. It visually tells the story of bulls being left stranded and "abandoned" at a high price just before the market crashes down on them.
Spotting Common Variations
Textbook patterns are rare in the wild charts of live trading. To be effective, you have to recognize the common, valid variations of the evening star. This helps you avoid missing good opportunities or, just as importantly, acting on flimsy signals.
Key Variations to Note:
| Variation | Description | What It Means |
|---|---|---|
| Evening Doji Star | The second candle is a Doji, not a spinning top. | Signals even sharper indecision. A perfect equilibrium between buyers and sellers often makes the reversal that follows more explosive. |
| No Gaps | The candles’ bodies touch or overlap, with no clear space. | This is a less powerful signal, but it's still tradable if the context and candle shapes are strong. The close of the third candle becomes absolutely critical here. |
| Overlapping Bodies | The star’s body slightly overlaps with the first candle’s body. | While this weakens the "indecision" signal, it doesn't automatically kill the trade. Put all your focus on the strength of that third candle for confirmation. |
At the end of the day, it all comes down to the story the candles are telling. Is there a clear handoff from bullish control to pure indecision, followed by a decisive bearish takeover? If that narrative is clear and compelling, you're likely looking at a solid evening star.
Reading the Story Behind the Candles
To really trade the evening star candlestick pattern with confidence, you have to look past the simple shape. Every pattern tells a story—a raw, unfiltered account of the battle between buyers and sellers. Getting this is what separates robotic, mechanical trading from truly intuitive price action analysis.
Think of it like a three-act play unfolding right at a market peak. Once you see it this way, the pattern stops being an abstract signal and becomes a logical story of a power shift you can see in real-time.
Act I: The Bullish Climax
The story kicks off with the first candle: a long, powerful bullish bar. This candle is the last hurrah of an established uptrend, the visual proof of peak optimism in the market.
At this point, buyers are completely in charge. They're feeling good, pushing prices to new highs, and the strong volume often confirms that the crowd is all-in on what they think is a never-ending rally. It's the climax of the bullish party.
Act II: The Moment of Indecision
Act two delivers a sharp plot twist with the "star." This is the small-bodied candle—usually a spinning top or a Doji—that signals a sudden, jarring halt to all that bullish momentum. After gapping up, the market just runs out of gas.
This candle represents a critical point of equilibrium. The buying pressure that was so overwhelming in the first candle has all but disappeared, yet sellers haven't managed to take control. It's a moment of pure gridlock and uncertainty. For a trader, this is the first red flag that the trend is in trouble. To dig deeper into this psychology, check out our guide on the Doji candle's meaning.
Act III: The Bearish Takeover
The final act brings the story to its conclusion. The third candle is a strong, decisive bearish bar that closes deep within the body of the first candle. This is the confirmation—the proof that market sentiment has completely flipped.
Sellers have now stormed the field, overwhelming the exhausted buyers and aggressively shoving the price down. This candle often wipes out most, if not all, of the gains from the first bullish candle. The story ends with the bears firmly in control, signaling the likely start of a new downtrend.
The narrative is simple but incredibly powerful: buyers push the price to an unsustainable peak, pause from exhaustion, and are then overwhelmed by a swift and decisive seller-led reversal. This psychological sequence is why the evening star is such a respected signal.
The Evening Star is widely considered by technical analysts to be a highly reliable bearish reversal signal. In fact, aggregated research shows the pattern has a historical success rate of 71% to 72% in predicting downward moves. It’s a significant clue that upward momentum is fading. For more on the data, check out the analysis from Quantified Strategies.
A Practical Framework for Trading the Pattern
Spotting an evening star candlestick pattern is one thing. Actually turning that observation into a profitable trade? That’s a completely different ballgame. A solid framework isn't just about seeing the three candles—it's about having hard-and-fast rules for your entry, stop-loss, and take-profit.
This kind of structure pulls guesswork and emotion out of the equation. It's how you turn a simple pattern into a trading system you can rely on.

Without a plan, even the most textbook-perfect evening star can end up costing you money. Let's build a practical framework you can use every single time.
H3: Defining Your Entry Trigger
Your entry is the first make-or-break decision. Jump in too early, and you might get clipped by one last bullish gasp. Wait too long, and you could miss the meat of the move. You’ve got a few solid options here, each with its own personality.
- Aggressive Entry: The moment that third bearish candle closes, you're in. This gets you the best possible price but comes with the risk that the sellers might not have enough gas in the tank to follow through.
- Conservative Entry: Wait for the next candle after the pattern is complete. If that fourth candle also closes bearish, it’s a powerful confirmation that sellers are now in charge. Your entry price won't be as good, but your odds of a successful trade just went up.
- Retest Entry: Sometimes, after the pattern forms, price will pop back up for a quick retest of the resistance level created by the star. Entering here can offer a phenomenal risk-to-reward ratio, since your entry is much closer to your stop-loss.
The right choice really boils down to your personal trading style and risk tolerance. For a closer look at the mechanics of pulling the trigger, our guide on how to enter a trade offers more detailed strategies.
H3: Setting a Logical Stop-Loss
Think of your stop-loss as your safety net. It’s what defines your maximum acceptable loss and, more importantly, protects your capital from a trade that goes wrong. Luckily, with the evening star, placing it is pretty straightforward.
The most effective place for your stop-loss is just a few pips or cents above the absolute high of the entire three-candle pattern. This is almost always the high of the second candle—the "star" itself.
The logic here is simple: if the price breaks above the highest point of the reversal pattern, the whole bearish idea is wrong. The setup is invalidated. Placing it any tighter risks getting shaken out by market noise, and any wider just adds unnecessary risk to the trade.
H3: Establishing Clear Profit Targets
Knowing when to get out of a winning trade is just as crucial as knowing when to get in. A classic mistake traders make is getting greedy and watching a profitable trade reverse all the way back to their entry. Here are a couple of data-driven ways to set your targets:
- Target Key Support: Look left on your chart. Where’s the nearest major support level? It could be a previous swing low, a demand zone, or a big moving average. These are the logical spots where buyers are likely to show up again.
- Use a Fixed Risk-to-Reward Ratio: This is a pure discipline play. You simply set your target as a multiple of your risk. For example, if your stop-loss is 50 pips from your entry, a 2:1 risk-to-reward ratio means your target is 100 pips away. A 3:1 ratio would be 150 pips away.
To keep your execution sharp and consistent, a simple checklist can make all the difference.
Evening Star Trading Plan Checklist
| Step | Action Required | Key Consideration |
|---|---|---|
| 1. Identify Pattern | Confirm a valid evening star has formed in an uptrend. | Does it meet the strict rules (gaps, body sizes)? |
| 2. Check Context | Is the pattern forming at a key resistance area? | Look for trendlines, prior highs, or supply zones. |
| 3. Seek Confluence | Are other indicators confirming the bearish signal? | Check for RSI divergence or moving average resistance. |
| 4. Choose Entry | Select entry trigger (aggressive, conservative, retest). | Base this on your risk tolerance and the market's volatility. |
| 5. Place Stop-Loss | Set stop-loss just above the high of the star candle. | This invalidates the pattern if hit. Non-negotiable. |
| 6. Set Target(s) | Define your profit target using support or R:R ratio. | Have a clear exit plan before you enter the trade. |
This checklist forces you to verify every critical component of the trade, turning a reactive decision into a proactive, strategic one.
H3: The Power of Confluence
Trading the evening star all by itself can work. But its reliability goes through the roof when other technical signals are pointing in the same direction. We call this confluence—when multiple, independent reasons all agree on a trade idea.
Before you even think about clicking the sell button, scan for these confirming factors:
- Resistance Levels: Did the pattern form right at a major horizontal resistance level or a descending trendline? A rejection from a known barrier adds serious weight to the signal.
- RSI Divergence: Is the Relative Strength Index (RSI) making a lower high while price makes a higher high? This is classic bearish divergence, a powerful leading sign that momentum is fading.
- Moving Averages: Is the pattern bumping its head against a key moving average, like the 50 or 200 EMA, that's acting as dynamic resistance?
When you find an evening star at a major resistance zone with bearish RSI divergence, you're no longer just trading a candlestick pattern. You're trading a high-probability confluence setup, and that’s a game-changer for your odds of success.
Real-World Examples of the Evening Star
Theory is a great starting point, but seeing the evening star candlestick pattern play out on a live chart is where the rubber really meets the road. Let’s move past the textbook diagrams and dig into how this pattern shows up in the wild, across different markets and timeframes. This is how we bridge the gap between knowing what a pattern is and knowing how to trade it.
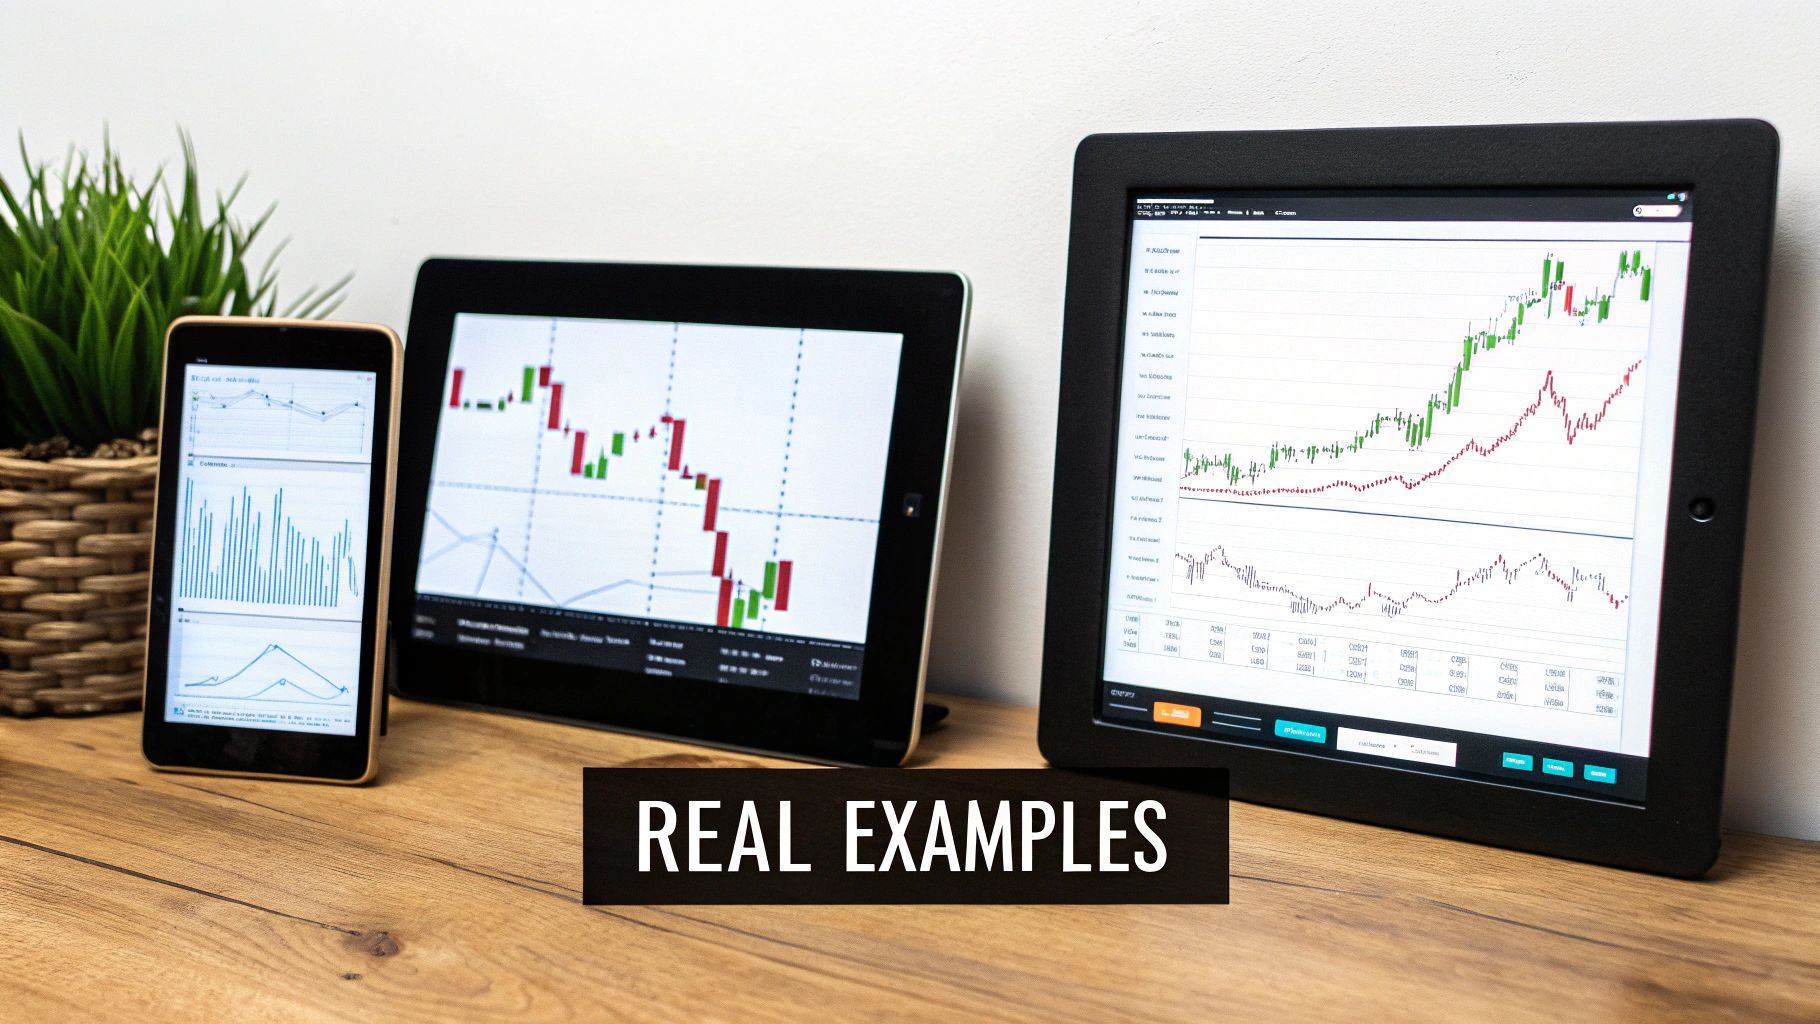
We'll walk through a couple of examples—one that worked beautifully and one that failed miserably—because both have crucial lessons to teach.
A Successful Trade on a Daily Stock Chart
Picture a hot tech stock that's been on a tear for weeks, printing one higher high after another. Swing traders are salivating, but they're also getting nervous about buying the top.
Then, right as it bumps up against a major historical resistance level, a picture-perfect evening star forms on the daily chart.
- Act I: The first candle is a huge green bar. Buyers are still in command, pushing for new highs and feeling confident.
- Act II: The next day, the stock gaps up but immediately stalls out, forming a small-bodied spinning top. This is the star—the first sign of exhaustion and a major red flag for the bulls.
- Act III: Day three is when the floor gives out. Sellers take complete control, opening lower and driving the price down, closing well past the halfway mark of that big green candle from day one.
For a price action trader, this is a textbook A+ setup. You could short the close of that third candle, with a stop-loss tucked just above the high of the star. Your target? The next logical support area, which was a swing low from three weeks back.
In this scenario, the trade worked out perfectly. The stock fell nearly 8% over the next two weeks before hitting that profit target.
An Intraday Example in Forex
This pattern isn't just for the daily charts; it’s a day trader's bread and butter, too. Let's look at the EUR/USD on a 15-minute chart. The pair shoots up after some positive economic news, but as it nears a key resistance level from earlier in the session, the momentum starts to fade.
Right on cue, a classic evening star forms at that resistance. A savvy day trader sees this confluence of signals and jumps on a short trade. The stop goes just a few pips above the star's high, and the target is set for a 2:1 risk-to-reward ratio, aiming for a prior support zone. The pattern held, delivering a quick, clean profit within the hour.
When the Pattern Fails: A Crypto Example
Now for the reality check. Let's examine a failed evening star in the wild west of the crypto markets. A popular altcoin is in a raging uptrend on the 4-hour chart, and what looks like a perfect evening star appears near a resistance level.
A trader shorts it, expecting a reversal. The price dips for a candle or two, but then buyers come roaring back with a vengeance. The price blasts right through the high of the star, taking out the trader's stop-loss for a frustrating loss.
Why did it fail? The context was all wrong. The preceding uptrend was exceptionally powerful, with massive volume bars on every push higher. That third bearish candle in the pattern, while it looked the part, printed on significantly lower volume. It was a bluff—there was no real selling conviction behind it.
This busted setup teaches us the most important lesson of all: confirmation and context are everything. Just spotting the three candles isn't enough. Trading the pattern blindly, without respecting the underlying momentum and volume, is a recipe for disaster. It proves, once again, that a stop-loss isn't optional; it's the only thing protecting your capital when a setup inevitably goes wrong.
Of all the ways to lose money trading, the most frustrating is when a seemingly perfect signal fails. The evening star candlestick pattern can be a powerful tool in your arsenal, but it's not a magic bullet. If you want it to work for you, you have to sidestep the common pitfalls that trap so many aspiring traders.
Honestly, knowing what not to do is just as important as memorizing the pattern's rules. Treating the evening star like an infallible crystal ball, ignoring the market environment, or getting the odds wrong are sure ways to bleed your account dry.
Trading the Pattern in a Vacuum
This is the big one. The single worst mistake you can make is trading the evening star just because you see it. Spotting the three-candle sequence is only step one. Without any supporting context, you’re just flipping a coin.
Think about it: a pattern that shows up in the middle of a choppy, sideways market means next to nothing. Its real power is only unleashed when it appears at a logical, significant place on your chart.
A trader who only sees the pattern is seeing a single tree. A professional who sees the pattern at a major resistance level with RSI divergence is seeing the entire forest. Context is what separates guesswork from a high-probability setup.
Always ask yourself: Why should the reversal happen right here? If you don't have a better answer than "because an evening star formed," it's probably a trade you should skip.
Ignoring the Volume Story
A close second to ignoring context is ignoring volume. Volume is the fuel behind price; it tells you how much conviction is behind a move. A proper evening star should tell a clear story of bulls running out of steam and bears taking control.
Here’s what that story looks like in the volume bars:
- Candle 1 (Bullish): This should ideally print on strong, healthy volume. It confirms that final, exhaustive push of the uptrend.
- Candle 2 (The Star): Look for a significant drop in volume here. This is your clue that buying pressure has all but evaporated, validating the indecision.
- Candle 3 (Bearish): You want to see a spike in volume on this candle. It confirms that sellers have stormed the market with force and are ready to push prices down.
If you spot a textbook-perfect evening star but the volume on that third candle is weak and pathetic, that’s a massive red flag. It often means the sellers don't have the muscle to follow through.
Misunderstanding the Statistical Realities
Let's be clear: no candlestick pattern works 100% of the time. The evening star is no exception. Believing it’s a guaranteed signal for a market top is a dangerous fantasy that leads to blowing up your account with oversized positions and sloppy risk management.
Deep statistical studies on Japanese candlesticks, like the one found in this analysis of candlestick pattern reliability, show they provide an edge, but they aren't perfect. Depending on the market and confirmation criteria, evening stars can fail anywhere from 28% to 35% of the time. This tells us a critical truth: the pattern is better than random, but it's far from infallible.
This is why your stop-loss is non-negotiable. It's not a suggestion; it’s your only defense against the statistical certainty that some of your trades will, and must, fail.
Accepting Weak Variations of the Pattern
Finally, a classic rookie error is getting too lenient with the rules. In the heat of the moment, it’s all too easy to talk yourself into believing a sloppy, poorly formed pattern is "good enough." This is a recipe for disaster.
You have to be disciplined and learn to walk away from weak setups like these:
- The first candle is a small, weak bar, not a powerful bullish candle.
- The third candle can't even manage to close below the midpoint of the first one.
- The second candle has a big body, showing there wasn't much indecision at all.
Being strict about the definition and demanding extra confirmation from other factors is how you filter out the garbage trades. That discipline is what separates the traders who make it from those who don't.
Frequently Asked Questions
When you start trading the evening star candlestick pattern, a few questions always pop up. It's natural, especially when trying to tell it apart from similar setups or figure out where it works best.
Let’s tackle some of the most common questions I hear from traders.
Key Pattern Distinctions
A lot of traders ask about the difference between a standard evening star and an evening doji star. The only change is the second candle. In an evening doji star, that middle candle is a doji, which screams indecision. It shows a powerful standoff between buyers and sellers. Because that stalemate is so sharp, many traders see the doji version as a more potent signal that the bears are about to take over.
Also, remember this: the evening star is only a bearish reversal pattern. The whole story it tells is about an uptrend running out of steam. Never, ever mistake it for a sign that the trend will continue.
Practical Trading Considerations
"Does it work on all timeframes?" That's a big one. You can find this pattern on any chart, but its reliability tends to drop on the lower timeframes, like the 5-minute or 15-minute charts. They're just too noisy, and you'll get faked out a lot. If you're trading on those faster charts, you absolutely need more confirmation.
The best tools to pair with the evening star are ones that confirm momentum is dying or that price has hit a wall. Think volume analysis, an RSI showing bearish divergence, or the pattern forming right at a major resistance level.
By layering these tools on top of the pattern, you can filter out the junk setups and dramatically improve your odds. This is what real trading is about—it's not just spotting shapes on a chart, but understanding the context behind them.
Ready to stop guessing and start trading price action with a proven framework? At Colibri Trader, we teach you the skills to read the market's story, so you can trade with clarity and confidence. Discover your trading potential with our free quiz today!