


Trading The Evening Star Candlestick Formation
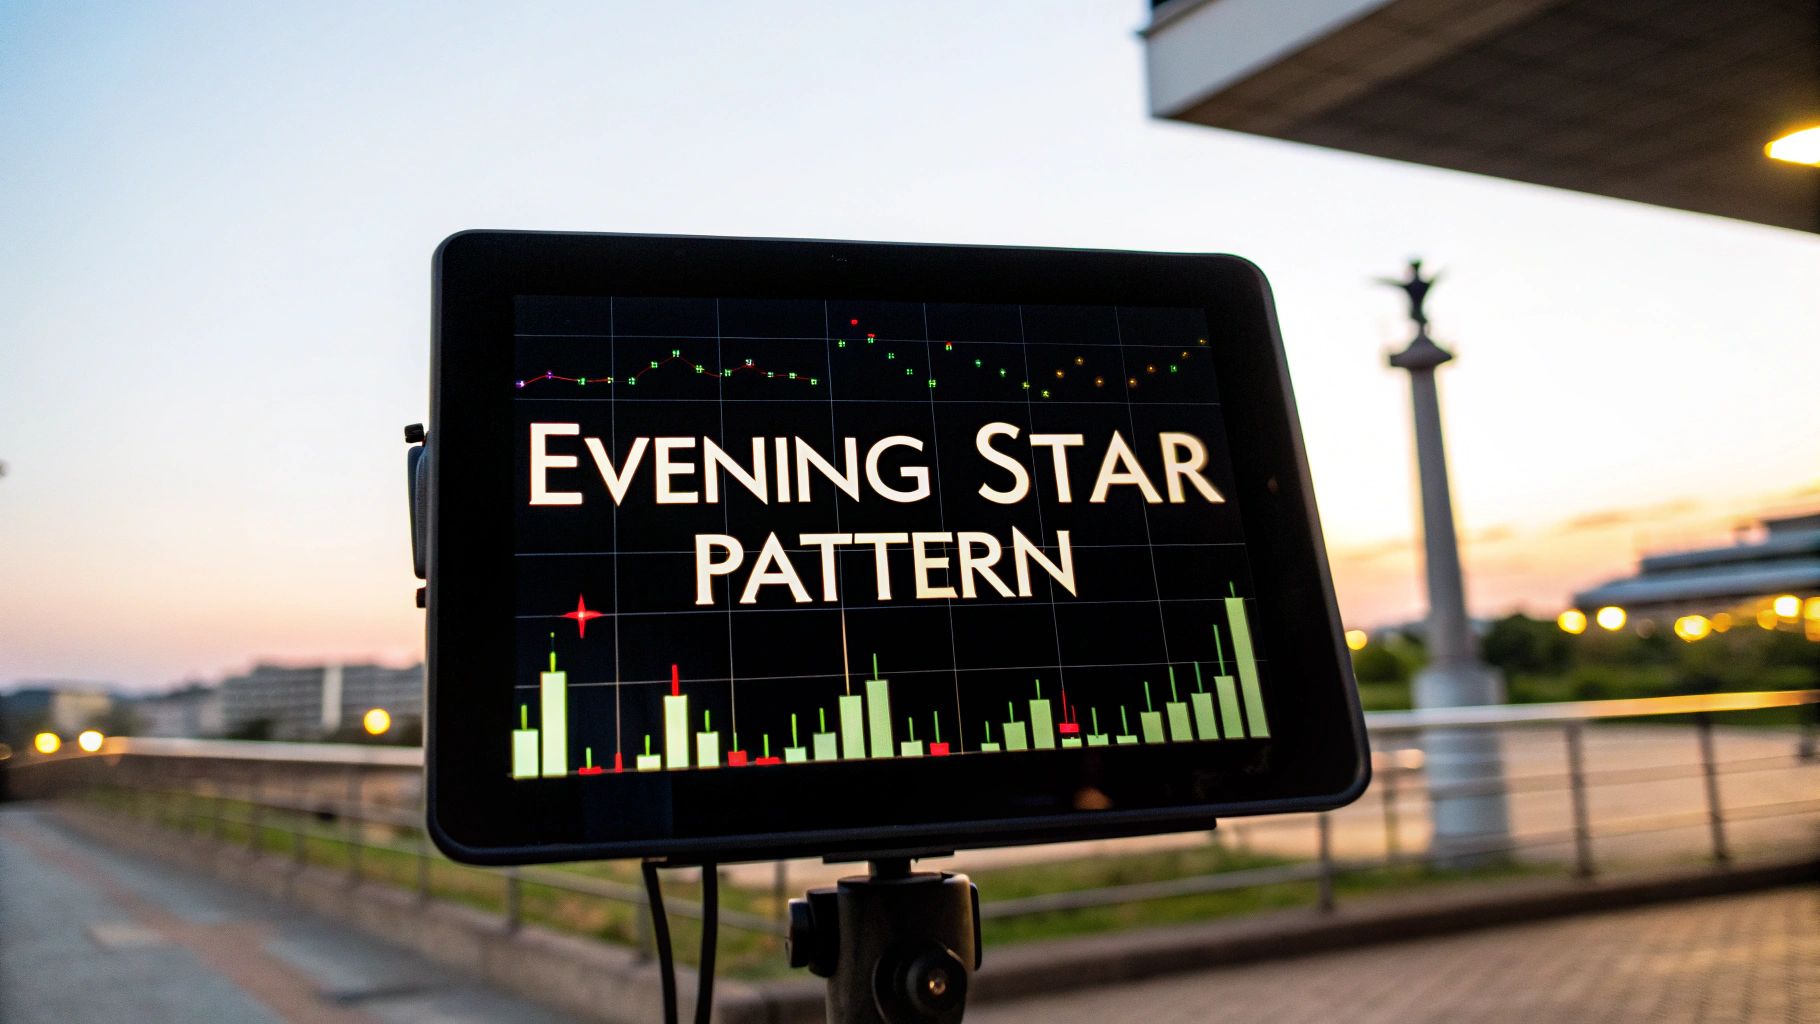
The evening star candlestick formation is a classic three-candle pattern that every price action trader should know. It’s a powerful signal that suggests a potential trend reversal from bullish to bearish.
Think of it as a clear warning light flashing at the peak of an uptrend. It tells you that the buyers are running out of steam and the sellers are starting to muscle their way in.
Understanding This Critical Bearish Signal

Picture a market in a strong, confident rally. Buyers are in complete control, pushing prices higher and higher. Then, right at the top, things start to look a bit shaky. That moment of hesitation and the subsequent power shift is exactly what the evening star captures.
It’s a visual story of the market’s psychology. You see the bullish fatigue set in, followed by a decisive bearish takeover.
For traders like us who focus on price action, this pattern is an essential piece of the puzzle. It's one of the most reliable bearish signals in the entire library of Japanese candlestick patterns.
Instead of waiting for a lagging indicator to catch up, the evening star gives you a real-time glimpse into the battle between bulls and bears. This helps you get ahead of major market shifts before they fully play out.
The Anatomy Of The Evening Star Pattern
To really use this pattern effectively, you have to understand its DNA. The formation is always built from three specific candles, and each one tells a part of the reversal story.
Knowing what each component means is the first step to spotting and trading this setup with confidence.
The evening star pattern represents a clear transition: from the final burst of bullish optimism to a moment of sharp indecision, and finally, to the confirmation of bearish control. It’s a complete story told in just three candles.
Let's break down each candle's role. The table below gives you a quick-reference guide to the characteristics and market implication of each piece of the pattern. Think of it as your blueprint for identifying the evening star in the wild.
Anatomy Of The Evening Star Pattern
| Candle | Type | Key Characteristic | Market Implication |
|---|---|---|---|
| First | Strong Bullish | A long green (or white) body continuing the uptrend. | Bullish confidence is high; buyers are still in control. |
| Second | Small Body | A small-bodied candle (or doji) that gaps up. | A moment of indecision; bullish momentum is stalling. |
| Third | Strong Bearish | A long red (or black) body that closes deep into the first candle. | Bearish takeover is confirmed; sellers have seized control. |
Once you get used to seeing these three candles together, you'll start to spot these potential turning points all over your charts. The key is recognizing the story they tell: the bulls are tired, and the bears are waking up.
Reading The Story Behind Each Candle
To really get a handle on the evening star candlestick formation, you have to see past the simple shapes on your chart. You need to understand the psychology driving the price action. Each of the three candles tells one part of a bigger story—a narrative of power shifting from the confident bulls to the dominant bears. When you learn to read this story, you stop just spotting a pattern and start interpreting what the market is truly thinking.
Picture the first candle as the grand finale of a raging bullish party. It's a big, strong green candle, often pushing to a new high. This is peak optimism. Buyers are fully in charge, driving prices up with conviction, and everyone feels like the uptrend will go on forever. This candle is that last big surge of buying before exhaustion kicks in.
The Peak Of Indecision
Next up is the second candle—the "star" of the show. This small-bodied candle, which could be green, red, or even a doji, signals a sudden halt in the market's momentum. It often gaps up from the first candle, which at first glance looks like the bulls are still running things. But that small body tells a very different story.
The star represents a critical moment of balance. The fierce buying pressure has suddenly vanished, and sellers are starting to test the waters. Neither side can take control. This is the moment of maximum uncertainty and the first real crack in the uptrend's foundation.
This indecision is the absolute heart of the evening star pattern. It’s a clear warning that the one-sided bullish sentiment is now being seriously challenged. The market is hesitating, taking a breath before its next big move.
The Bearish Confirmation
Finally, the third candle delivers the climax. This is a large, powerful red candle confirming the bears have decisively won the battle. This candle often opens lower than the star and, crucially, closes deep into the body of that first big green candle, wiping out a huge chunk of the previous gains.
This candle is the confirmation traders are waiting for. It shows that the indecision of the second candle has been resolved, and the sellers are now in control. The key things to look for in this final candle are:
- A Strong Bearish Body: It shows sellers have taken over with force.
- A Deep Close: It absolutely must close below the 50% midpoint of the first candle’s body. Any less, and the signal is weak.
- Increased Volume (Ideally): A spike in volume on this candle gives the reversal signal a lot more credibility.
When you see this three-act play unfold—bullish euphoria, followed by sharp indecision, and ending with a bearish takeover—you are witnessing a classic evening star candlestick formation. You're not just seeing shapes; you're reading the market’s mind.
How To Identify A Valid Evening Star Pattern
Spotting a potential evening star candlestick formation is one thing, but confirming its validity is what separates disciplined traders from those who chase false signals. Let’s be clear: not every three-candle sequence that looks like an evening star is a genuine reversal signal.
The single most critical factor is context. A true evening star must appear at the top of a clear, established uptrend. Without that, the pattern loses almost all of its predictive power.
Think of it like seeing storm clouds on the horizon. If it’s been sunny for days (a solid uptrend), those clouds are a credible warning. But if the weather is already choppy and uncertain (a sideways market), those same clouds just don't carry the same weight. The pattern’s location is everything.
This infographic breaks down the narrative of a classic evening star, showing the story from bullish confidence to a complete bearish takeover.
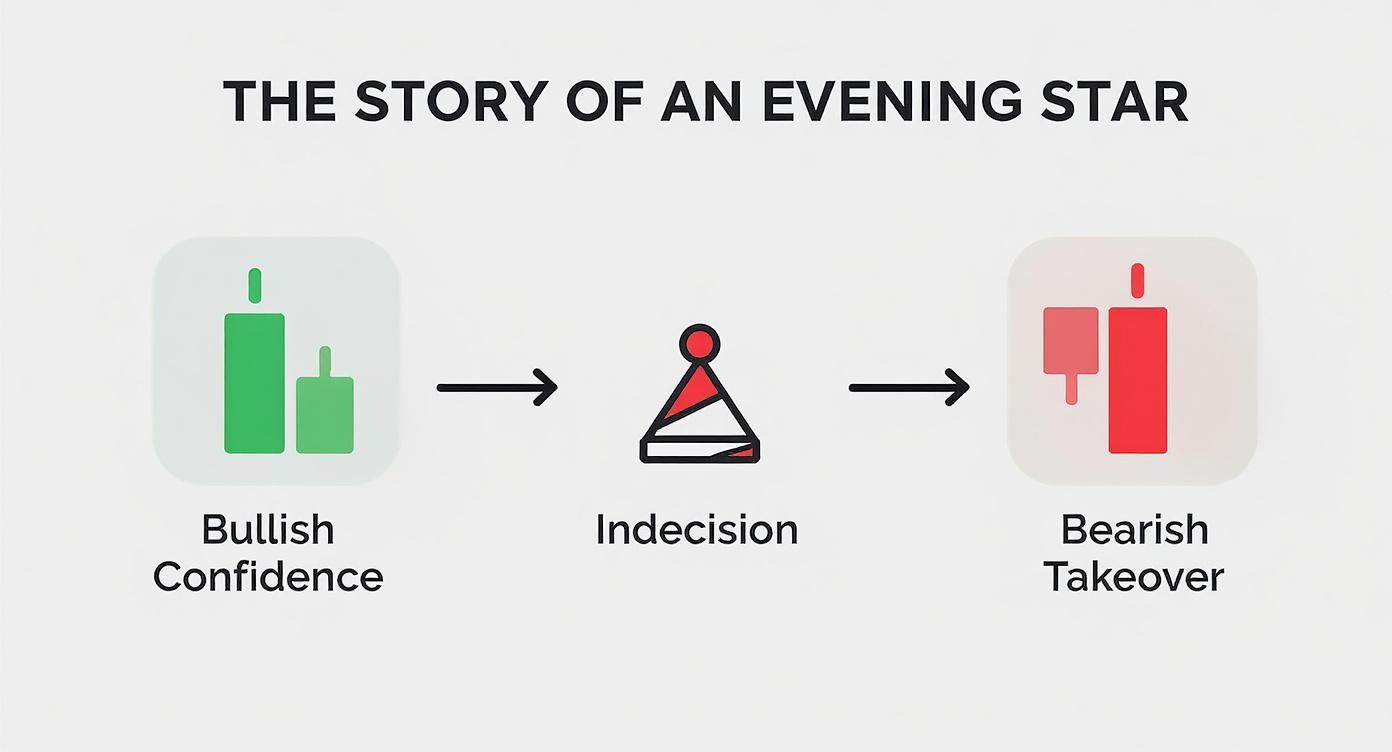
As you can see, the story is simple: bullish momentum stalls, indecision creeps in, and then sellers seize control. That's the bearish reversal in a nutshell.
A Checklist For Validation
To confidently identify a high-probability evening star, I run through a mental checklist. Each point adds another layer of confirmation, helping to filter out market noise and focus only on the strongest setups.
Here’s what I look for:
-
Established Uptrend: The pattern absolutely must form after a series of higher highs and higher lows. The longer and more extended the uptrend, the more significant the potential reversal.
-
Strong Bullish First Candle: The first candle should be a big, healthy green candle with a long body. This confirms the uptrend was in full swing right before the pattern formed. No weak candles allowed.
-
The "Star" Candle: The second candle needs to be small-bodied. Its color doesn't matter nearly as much as its size, which screams indecision. Ideally, it gaps up from the first candle's close, showing a final, failed burst of bullish energy. This candle can be a spinning top or, even better, a Doji. If you want to dive deeper, you can check out our guide on what is a Doji candlestick.
-
Decisive Bearish Third Candle: This is the confirmation. The third candle must be a strong red candle that closes well into the body of the first candle. A crucial rule of thumb is that it must close below the 50% midpoint of the first candle's body. The deeper it closes, the stronger the signal that sellers are now completely in charge.
By systematically applying these criteria, you shift from simply recognizing a shape to validating a high-probability trading signal. It’s this disciplined approach that is essential for avoiding costly false positives and trading with much greater confidence.
A Practical Strategy For Trading The Evening Star
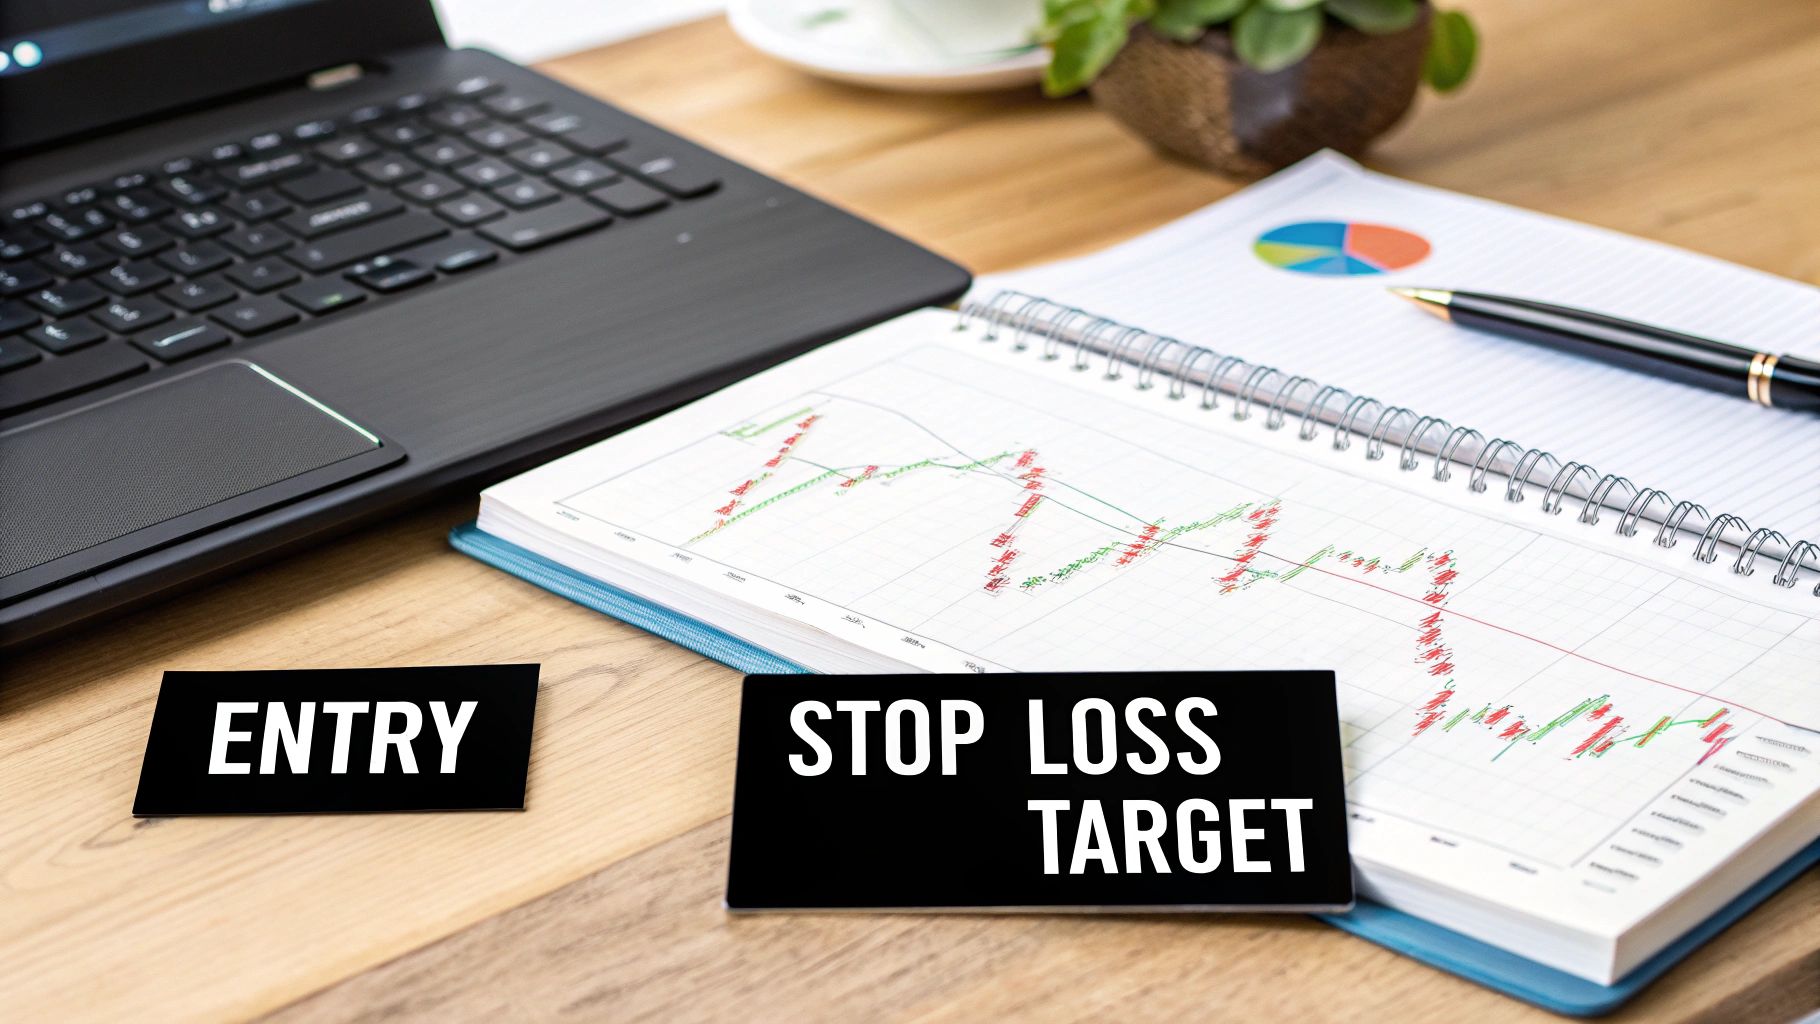
Spotting an evening star on your charts is a great start. But turning that pattern into a profitable trade? That requires a clear, disciplined plan.
A solid strategy is what separates consistent traders from gamblers. It takes the emotion and guesswork out of the equation, giving you a repeatable process for entering, managing risk, and taking profits. Without a plan, even the most textbook-perfect pattern can end in a loss.
This section lays out a complete price action trading strategy built around this powerful bearish signal. We’ll break down the entire trade into three simple, actionable steps: defining your entry, setting your stop-loss, and picking your targets. This framework is designed to help you trade the evening star with confidence and precision.
Step 1: Define Your Entry Trigger
The single biggest mistake traders make is jumping the gun. An evening star is a three-candle pattern, and it isn't truly formed until that third candle closes. Acting before you have that confirmation is just asking to get caught in a false signal.
Your entry trigger needs to be black and white. No grey areas.
- Wait For The Close: Do not even think about shorting until the third bearish candle has fully closed. The stronger, the better. Ideally, this close should be well below the 50% midpoint of the first bullish candle's body.
- Execute The Trade: Once the pattern is confirmed, the entry point is the open of the next candle (the fourth one). This ensures the bearish reversal has been validated by the market before you put any money on the line.
By waiting for that third candle to close, you're letting the market prove the reversal is real. Patience is your greatest ally here; it filters out weak setups and keeps you focused only on the high-probability opportunities.
It’s a small detail, but this kind of discipline makes a huge difference to your bottom line over the long run.
Step 2: Set A Protective Stop-Loss
Good risk management is the foundation of any successful trading career. Your stop-loss isn't just a safety net; it's the specific price point where your trade idea is proven wrong.
For the evening star, the placement is simple and logical, based entirely on the pattern's own structure.
The rule is simple: place your stop-loss just a few pips above the high of the second candle (the "star").
From a price action perspective, this makes perfect sense. The high of that star represents the absolute peak of buying pressure before it fizzled out. If the price manages to break above that level, the whole bearish signal is invalid, and you want to be out of that trade immediately to keep your loss small.
Step 3: Identify Logical Profit Targets
Okay, you're in the trade and your risk is defined. The final piece of the puzzle is knowing where to get out and bank your profits. A great approach is to use the market's existing structure to find areas where the price is likely to react.
Here are two effective methods for setting your profit targets:
- Target Previous Support Levels: Look to the left on your chart. Find the most recent, significant support level where buyers previously stepped in. This is a natural magnet for price and a logical spot to take your profits.
- Use a Measured Move: For a more technical target, measure the total height of the evening star formation itself—from the low of the first candle to the absolute high of the star. Project that same distance downwards from your entry point to calculate a potential target.
By combining these three steps—a confirmed entry, a structural stop-loss, and a logical profit target—you create a complete trading plan. This is how you transform the evening star from just another pattern into a robust, actionable, and manageable trading strategy.
Using Confirmation To Improve Your Odds
Trading any candlestick pattern in isolation, even a powerful one like the evening star, is like sailing with only half a map. You might see the signal, but you're missing the crucial context that keeps you out of trouble. While the pattern itself is a strong hint, stacking the odds in your favor with a little extra confirmation is what really separates the consistently profitable traders from everyone else.
Think of it as gathering evidence for a case. The evening star is your first major clue that a reversal might be on the cards. But before committing to a trade, a true price action trader always looks for a few more facts to back up their theory. This disciplined patience is what keeps you from jumping on false signals.
The evening star candlestick formation is one of the most well-known bearish reversal signals out there, and for good reason. Digging into the data across major global markets, research shows the evening star pattern has a historical success rate somewhere between 71% and 72% when it comes to predicting a move down.
Stacking The Odds With Confluence
Confluence is the magic word in my trading book. It’s that sweet spot on the chart where multiple, independent signals all line up and point in the same direction. When you spot an evening star taking shape, your very next move should be to scan the chart for these confirming factors.
Here are the three big ones I always look for:
-
Volume Spike on the Third Candle: A big jump in volume on that final, bearish candle is a massive vote of confidence from the market. It tells you that a lot of sellers are piling in, adding some serious fuel to the reversal. It's a great idea to pair this with other volume analysis techniques to get the full picture.
-
Formation at a Key Resistance Level: Context is everything in trading. An evening star that pops up right at a major, pre-existing resistance level is infinitely more powerful than one that just appears in the middle of nowhere. It shows the market is hitting a historical ceiling, which adds some serious weight to the bearish signal. Check out our guide on how to identify support and resistance if you need a refresher.
-
Bearish Divergence on an Oscillator: Take a glance at a momentum indicator like the Relative Strength Index (RSI). I’m looking for bearish divergence, which happens when the price pokes up to make a new high (the "star" candle), but the RSI fails to do the same and actually makes a lower high.
This divergence is a classic tell. It’s a sign that the bullish momentum is running out of steam. Even though price is making one last gasp higher, the underlying strength of the uptrend is fading, setting the perfect stage for the evening star to come in and flip the market.
Common Mistakes To Avoid When Trading This Pattern
Look, even the most textbook-perfect patterns can burn you if you get careless. The evening star candlestick formation is no different, and I've seen a few common pitfalls trap otherwise good traders. Knowing what these traps are is the first step to playing better defense and keeping your capital safe.
One of the biggest mistakes I see is jumping the gun. An evening star is a three-candle pattern, period. It is not complete, and it is not a valid signal, until that third bearish candle closes. If you enter before that confirmation, you're not trading—you're gambling on an incomplete setup.
Another massive error is ignoring the bigger picture. A pattern without context is just noise. Research backs this up, showing that reversal patterns work far better when they show up at the end of a real, established trend. You can even read the full statistical breakdown of candlestick patterns to see the data for yourself.
An evening star that pops up in a messy, sideways market just doesn’t have the same bearish firepower as one that forms at the peak of a long, stretched-out uptrend.
Fine-Tuning Your Execution
To protect your account, you have to actively avoid these common but costly mistakes. Here are a few simple rules I live by:
- Never Front-Run the Signal: Always—and I mean always—wait for that third candle to close. A proper evening star will see this candle close below the midpoint of the first candle. Patience is your biggest edge here.
- Confirm the Uptrend: Before you even think about shorting, make sure the pattern actually formed after a legitimate move up. No uptrend, no valid reversal signal. It's that simple.
- Don't Mistake a Pullback for a Reversal: A tiny, weak-looking evening star might just be a sign of a minor pause or pullback, not a full-blown trend change. Pay close attention to the size and conviction of that third candle; it tells you a lot about what the bears are thinking.
By consciously side-stepping these blunders, you'll dramatically improve the quality of your trades and start using the evening star pattern much more effectively.
Even after getting a handle on the evening star, a few questions always seem to pop up. Let's tackle them head-on to clear up any lingering confusion you might have.
What Is The Success Rate Of The Evening Star Pattern?
You’ll see a lot of numbers thrown around, but a realistic success rate hovers between 55% and 72%. But that number is almost meaningless without context.
Its reliability shoots up when it forms after a clean, obvious uptrend. Even better if it’s backed by other clues, like a spike in volume or some bearish divergence on your favourite oscillator. Like any pattern, it's a game of probabilities, not certainties. Always pair it with solid risk management.
How Is An Evening Star Different From An Evening Doji Star?
Great question. The two patterns are practically twins, with just one key difference: the middle candle. A standard evening star has a small-bodied candle (a spinning top) for its second candle.
An evening doji star, however, has a doji as its second candle. This means the open and close prices are nearly identical. Many traders, myself included, see the evening doji star as a more powerful signal. That doji screams of intense indecision right at the peak, just before the sellers take complete control.
It’s a subtle tweak, but it can signal a much more dramatic shift in market sentiment.
Can You Use The Evening Star Pattern In Forex And Crypto Markets?
Yes, absolutely. The evening star is a universal pattern because it’s based on pure human psychology—the story of bulls running out of steam and bears taking over. This dynamic plays out in every market you can chart with candlesticks.
So whether you’re trading forex, stocks, crypto, or commodities, the pattern is relevant. The story it tells is the same. That said, it’s always a smart move to backtest its effectiveness on the specific chart and timeframe you're planning to trade.
At Colibri Trader, my entire focus is on helping you master price action with clear, practical strategies that actually work. It's about learning the techniques that build real, consistent results, no matter what market you trade.