


Evening Star Candle Pattern: Complete Guide to the Reversal Signal
The Evening Star is one of those classic three-candle patterns that can stop you in your tracks. Think of it as a bright warning flare shot up at a market peak. It's the market's way of telling you that the buyers are getting tired and the sellers are starting to circle overhead.
Essentially, this pattern tells a visual story of a power shift, moving from bullish confidence to bearish control.
The Story Behind The Evening Star Pattern
At its heart, the evening star candle pattern is a bearish reversal signal that pops up after a good, strong run-up in price. It captures that precise moment when the market's optimism starts to fizzle out, a bit of indecision hangs in the air, and then the bears finally step in and take over.
For traders who live and breathe price action, it’s a critical formation. It helps you anticipate a downturn without having to rely on a bunch of complicated or lagging indicators.
This pattern isn't just a random set of candles; it’s a short story about market psychology unfolding over three trading sessions.
Imagine this: a stock has been climbing steadily, pushed higher by a crowd of enthusiastic buyers. Then, all of a sudden, that upward march stalls out. It’s a moment of doubt. Finally, the sellers show up with real force, confirming the reversal and kicking off a potential new downtrend.
Its Role As A Bearish Indicator
The Evening Star’s main job is to give you a heads-up that an uptrend is losing its mojo. When you see it form, it suggests the balance of power is tipping away from the bulls and into the hands of the bears.
This makes it a go-to signal for traders looking to:
- Spot potential short-selling opportunities right at the top of a move.
- Figure out the best time to cash out of long positions before those profits vanish.
- Get confirmation that a resistance level is holding strong and capping further price gains.
Let's break down what each candle in the Evening Star pattern is telling us.
Evening Star Pattern at a Glance
This table sums up the three-part story of the Evening Star.
| Candle | Appearance | Market Psychology |
|---|---|---|
| Candle 1 | A large, bullish green candle. | Bulls are in complete control, confidently pushing the price higher. |
| Candle 2 | A small-bodied candle (Doji, spinning top, etc.). | Indecision. The buying pressure has stalled, and bulls and bears are in a standoff. |
| Candle 3 | A large, bearish red candle. | The bears have won. Sellers step in with force, confirming the reversal. |
By learning to read this simple three-candle sequence, you’re essentially tapping into the market's collective mood. It tells a much richer story than a single candlestick ever could, giving you a stronger signal that the trend might be about to change.
The Evening Star is just one of many formations that make up the language of technical analysis. To get the bigger picture, it helps to explore other powerful Japanese candlestick patterns and see how they all fit together.
Now, let's get into the nitty-gritty and dissect the anatomy of each candle in this pattern.
Anatomy of a Market Reversal: The Three Candles
To really get a feel for the evening star candle pattern, you have to see the story it’s telling about what traders are thinking. It's like a three-act play signaling a major plot twist. Each candle has a specific part to play, building up the narrative of a powerful reversal from bullish optimism to bearish control.
This pattern isn't just a random shape on your chart. It's a crystal-clear picture of a power struggle at a market peak. Think of it like a climbing expedition that hits the summit, loses its nerve, and is forced into a rapid, unexpected descent.
Act One: The Bullish Surge
The first candle of the Evening Star is a big, strong bullish candle (usually green or white). This candle is the last confident push from the buyers. At this point, everyone's feeling good, and the uptrend looks solid. Buyers are firmly in the driver's seat, pushing the price way up.
This first candle is key because it sets up the uptrend that the pattern is about to reverse. Its long body shows strong buying momentum and sets the stage for the battle that's about to unfold.
Act Two: The Peak of Indecision
Next up is the "star" of the show—a small-bodied candle that gaps up from where the first candle closed. This second candle can be bullish, bearish, or even a Doji, and it represents a critical moment of hesitation. The market just hit a new high, but suddenly, the buying pressure has vanished.
The star candle is the market pausing to catch its breath. Buyers are no longer strong enough to push prices significantly higher, and sellers aren't yet in control. This stalemate creates a palpable sense of indecision and is the first warning sign that the trend is weakening.
Act Three: The Bearish Takeover
The final candle is what confirms the reversal, and it does so with authority. This third candle is a large, decisive bearish bar (usually red or black) that opens below the star and closes deep inside the body of the first candle. Ideally, you want to see it close below the midpoint of that first candle's body.
This candle is the signal that sellers have wrestled back control, overpowering the remaining buyers and aggressively shoving the price down. The stronger and longer this bearish candle is, the more serious the reversal signal. Historical backtests have shown this pattern to be a pretty reliable indicator. For instance, data from 1960 to 2023 showed a 72% success rate in predicting downturns, with the third candle often wiping out over 60% of the first candle’s body. You can find more insights on these historical findings over at Colibri Trader. This powerful confirmation is what separates a true Evening Star from just market noise.
A Step-By-Step Framework for Trading the Pattern
Spotting an Evening Star is one thing. Actually trading it with discipline is something else entirely—and it's where the money is made. Having a structured framework is crucial because it takes the emotion and guesswork out of the equation. It gives you a clear, repeatable process for getting in, managing the trade, and getting out.
The absolute core of this framework is patience. A classic mistake traders make is jumping the gun. They see the first two candles forming and immediately short the market, trying to anticipate the reversal before the third candle has even closed. This is a huge error. The pattern isn't valid until that final bearish candle slams the door shut on the bulls. Waiting for that confirmation is non-negotiable.
This diagram breaks down the three distinct phases of the Evening Star pattern. You can see how a strong uptrend fades into indecision, and finally, flips into a confirmed bearish reversal.
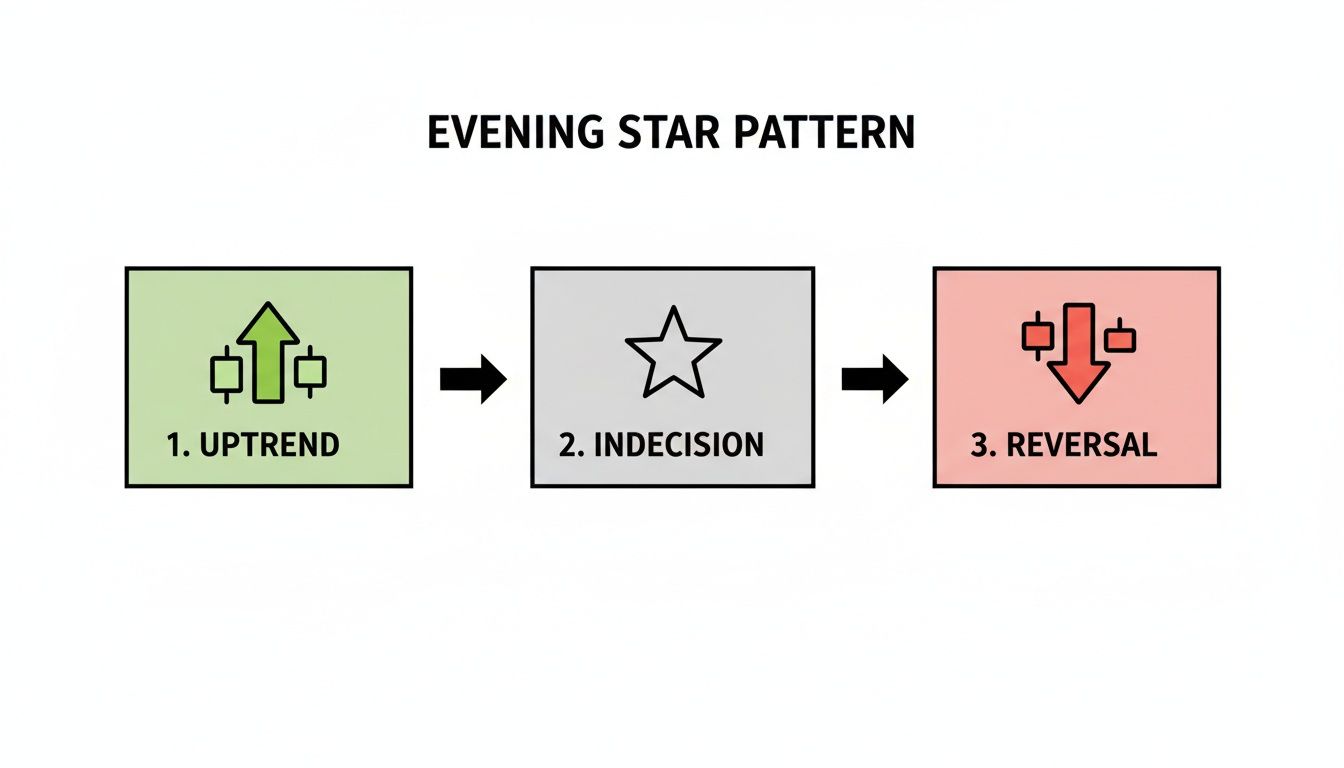
The visual perfectly captures the story: bullish momentum (the big green candle) runs out of steam (the star), and then the sellers wrestle back control (the big red candle). That's your signal.
Defining Your Entry Point
The most common and prudent way to enter is to place a short (sell) order right after the third bearish candle closes. This tells you the reversal has real momentum behind it. Some traders prefer extra confirmation and wait for the price to break below the low of this third candle, but be warned—this can sometimes mean you get a worse entry price.
Key Takeaway: Your entry trigger must be a reaction to a completed pattern, not a prediction. The close of that third candle is what turns a potential setup into an actionable trade.
Nailing down a consistent entry method is fundamental. To get more granular on the mechanics of execution, our guide on how to enter a trade offers detailed strategies that fit right into this framework.
Setting Your Stop-Loss and Profit Targets
Once your trade is live, risk management is everything. A smart stop-loss and realistic profit targets are what separate winning trades from losing ones over the long haul.
-
Stop-Loss Placement: The most logical spot for your stop-loss is just above the high of the second candle—the "star" itself. This level marks the absolute peak of bullish exhaustion. If the price manages to break above it, your entire bearish thesis is invalidated, and it's time to get out.
-
Profit Target Strategy: To set a profit target, you need to look left on your chart. Find the nearest significant support level. This could be a previous swing low, a clear demand zone, or even a major moving average. This is a high-probability area where buyers might step back in, making it the perfect place to cash out. Always aim for a risk-to-reward ratio of at least 1:2. That means your potential profit should be at least double your potential loss, ensuring your strategy can stay profitable even if you don't win every single trade.
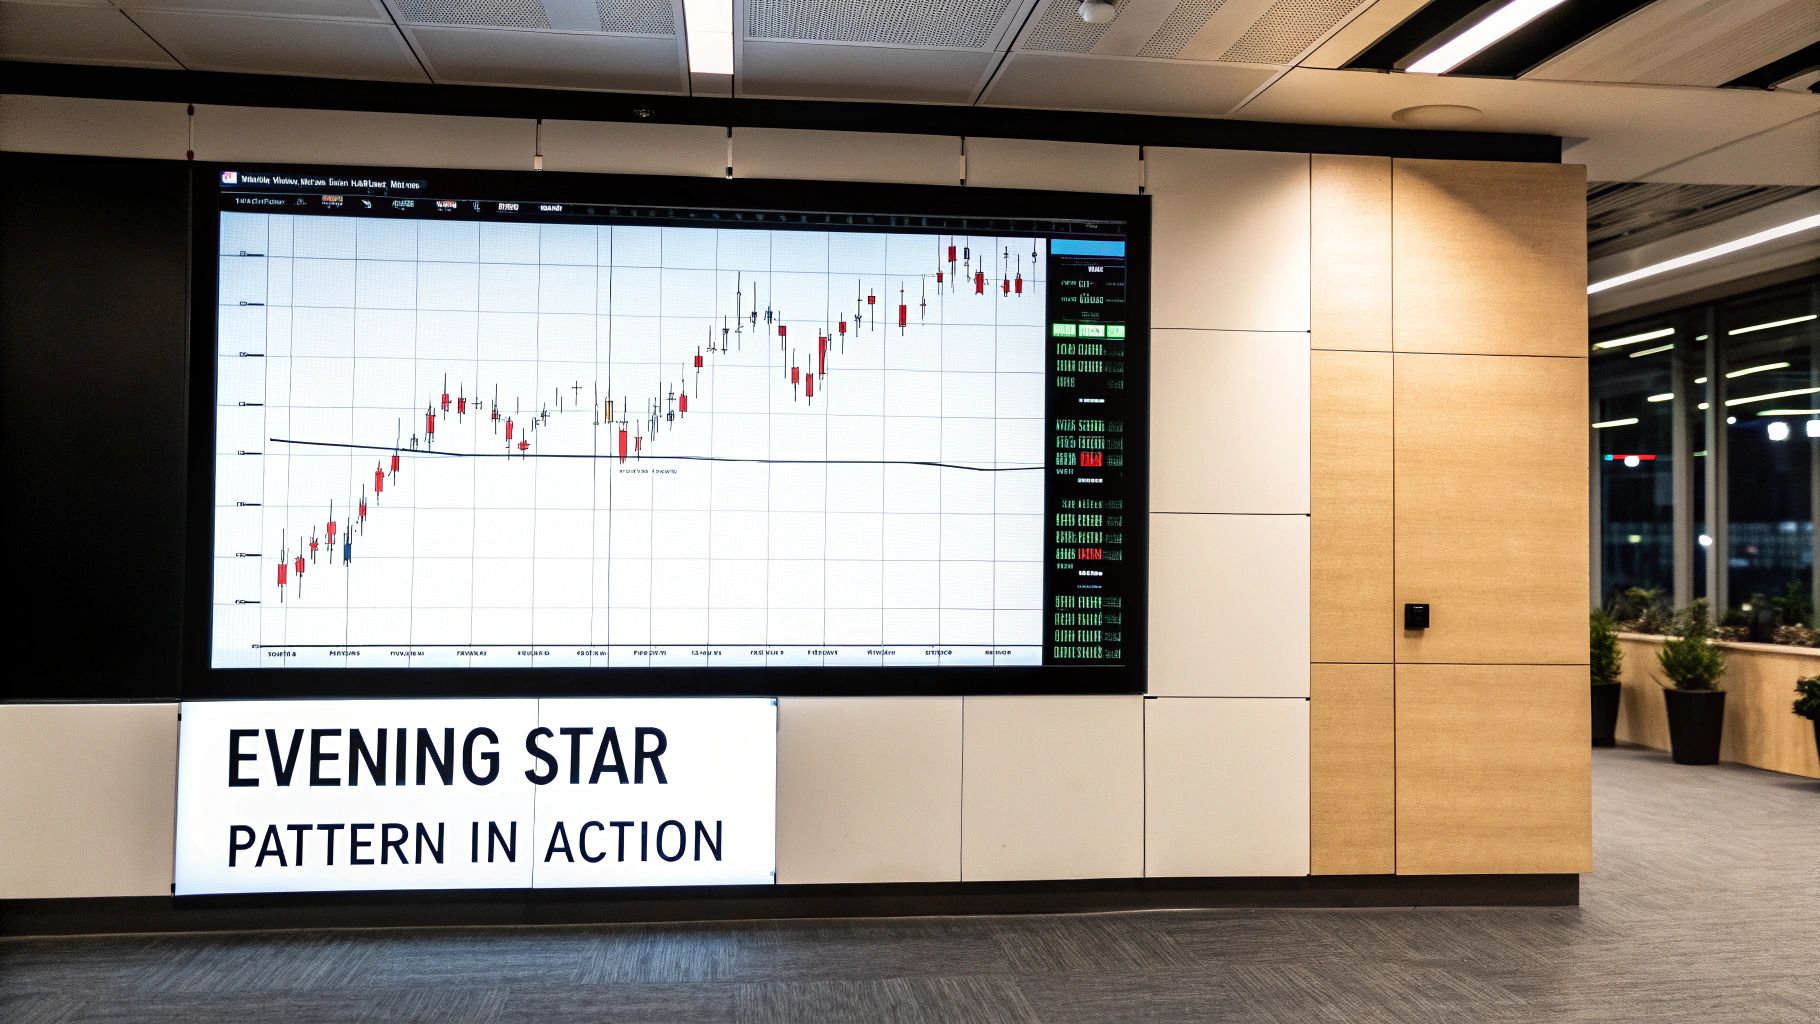
Seeing the Evening Star Pattern in Action
Theory is one thing, but seeing the evening star candle pattern actually play out on a chart is where the rubber meets the road. It’s one thing to look at a clean textbook diagram, but it’s another thing entirely to spot one forming in a live market with money on the line.
By looking at real historical examples, we can train our eyes to spot these setups as they develop. This is how abstract knowledge becomes a practical, sharp trading skill. Let's step away from the diagrams and see how this pattern performs in the wild.
Case Study: Alphabet Inc (GOOG)
A perfect, textbook example of an Evening Star showed up on the daily chart for Alphabet (GOOG) back in October 2021. At the time, the stock was in a nice, clear uptrend, cruising confidently above its 50-day moving average. This context is key—it made the reversal signal that followed even more powerful.
Here’s how the three-candle story unfolded:
- The Bullish Candle: First, a strong green candle pushed higher, continuing the uptrend. Buyers were clearly feeling good.
- The Star: Next, a tiny-bodied candle gapped up. This was the first sign of trouble. That powerful buying momentum just hit a brick wall, and suddenly, nobody was sure what to do next. Indecision crept in.
- The Bearish Candle: The third candle was the knockout punch. A big red bar opened lower and closed deep inside the body of that first green candle. Sellers had wrestled back control, and it wasn't even a contest.
This formation was a loud and clear warning that the rally was running out of gas. For any trader who spotted this, it was a prime opportunity to short the stock right at a major turning point.
This visual story—from confidence to hesitation to a full-blown bearish takeover—is the core narrative of the Evening Star. Seeing it play out on a chart like GOOG’s is how you build the pattern recognition skills you need for live trading.
And it's not just a pretty picture; the stats back it up. On October 20, 2021, GOOG printed that exact Evening Star. Digging into the data from over 11,440 instances shows this pattern has a real edge, with an average drop of -0.765% over the next five days.
In this specific GOOG trade, the move was much bigger. A trader who went short at the next day's open, with a stop just above the high of the pattern, could have ridden the stock down for a 12% gain over two weeks as it tumbled from around $2,800 to $2,450. If you're interested in diving deeper into these kinds of performance metrics, you can find more at Analyzing Alpha. It’s a great example of how a clean pattern, backed by solid statistics, can signal a truly significant move in the market.
How to Increase Your Trade Accuracy
Let's be real: not every evening star candle pattern you spot will turn into a winning trade. Not even close. While the pattern itself is a solid bearish signal, its true power only shows up when it appears in the right place at the right time.
Think of the pattern as a credible witness in a courtroom. Its testimony is interesting, but it becomes a slam-dunk case when supported by other pieces of evidence.
Filtering for these A-grade setups is how you graduate from just spotting patterns to actually trading them for profit. The secret is finding spots on the chart where multiple technical clues all point in the same direction. This strategy, known as confluence, is a game-changer for your odds of success. If you're new to this idea, our guide on confluence in trading is a must-read.
Layering Context for Stronger Signals
The best Evening Star patterns never show up in a vacuum. Their reliability goes through the roof when they form exactly where you'd expect sellers to be lurking anyway. This is the confirmation that separates a good setup from a great one.
Here are the key contextual clues I always look for:
- Key Resistance Levels: An Evening Star printing right up against a historical resistance level—a price ceiling that has held firm in the past—is a powerful sign. It tells you the sellers who defended that level before are back in business.
- Major Moving Averages: When the pattern forms as price smacks into and rejects a major moving average (like the 50-day or 200-day), that moving average is acting as dynamic resistance. This adds serious weight to the bearish signal.
- Supply Zones: If the pattern appears inside a well-defined supply zone, it's a strong hint that a new wave of sell orders is hitting the market, ready to fuel the reversal.
The Decisive Role of Volume
But context isn't just about price levels; it's also about who's participating. To really stack the odds in your favor, you need to look at the volume. A great tool for this is volume analysis.
What you want to see is a big spike in trading volume on that third bearish candle. This is the market giving you powerful proof that sellers have shown up with force and conviction.
This jump in volume confirms the reversal isn't just a weak pullback. It’s a genuine shift in market sentiment backed by serious selling pressure. The market isn't whispering a change is coming; it's shouting it.
The numbers back this up. Deep performance metrics show the Evening Star pattern has a 72% success rate in producing bearish reversals across major markets. And in a 20-year scan of EUR/USD, it successfully flagged 43% of major tops when the third candle's body pushed at least 60% into the first candle's body.
By layering these contextual clues, you can learn to sidestep the mediocre setups and focus only on the high-probability trades that really count.
Common Trading Mistakes to Avoid
Even a picture-perfect evening star candle pattern can turn into a losing trade if you stumble into a few common traps. A great setup doesn't guarantee profit—disciplined execution does. Learning to sidestep a few key errors can make all the difference in your long-term success and, more importantly, protect your trading capital.
The most frequent and costly mistake is simple impatience. A lot of traders see the first two candles taking shape and jump the gun, immediately shorting the market to front-run the signal. This is a massive error. The pattern is incomplete and totally invalid until that third bearish candle closes. Acting early isn't a strategy; it's just a guess.
Another huge pitfall is ignoring the bigger picture. An Evening Star that pops up in the middle of a choppy, sideways market is far less reliable than one that appears at the absolute peak of a clean, extended uptrend. Context is king. The pattern needs a clear trend to reverse in the first place.
Protecting Your Trade from Unforced Errors
Beyond impatience and poor context, flawed risk management is a classic way to sabotage a potentially great trade. Setting a stop-loss that’s way too tight is a surefire way to get knocked out by normal market noise, only to then watch the price fall exactly as you predicted. Frustrating, right?
To keep yourself out of trouble, just follow a simple checklist of what not to do:
- Never enter before the third candle closes. Your signal is the close, not the formation in progress. Be patient.
- Do not trade the pattern in a sideways market. It's a reversal pattern, and it needs an existing trend to actually reverse.
- Avoid setting your stop-loss too close. Give the trade room to breathe. Place it logically above the high of the star candle.
- Don't mistake simple consolidation for a valid pattern. A real Evening Star needs to cap off an uptrend with some real substance behind it.
Remember, the goal isn't just to spot a pattern; it's to trade it correctly. Avoiding these preventable mistakes is just as crucial as your entry strategy. It ensures that when a high-quality setup does appear, you're ready to take full advantage of it without shooting yourself in the foot.
A Few Final Questions
Even with a solid game plan, you're bound to have questions when adding a new pattern to your trading arsenal. Let's tackle some of the most common ones that pop up when traders start working with the Evening Star.
How Reliable Is the Evening Star Pattern?
The Evening Star is widely considered one of the more dependable bearish reversal signals out there. In fact, some studies have clocked its success rate at around 72%.
That reliability gets a serious boost when the pattern forms right at a major resistance level and the final candle is backed by a spike in trading volume. That's a powerful combination. But remember, no pattern is a crystal ball. Always protect your capital with sound risk management, just in case you run into a false signal.
What Is the Difference Between an Evening Star and a Shooting Star?
Great question. A Shooting Star is a single-candle pattern. Think of it as a quick, one-day warning sign that a rally might be losing steam.
The Evening Star, on the other hand, is a three-candle formation. It tells a more complete story, showing a clear, developing power shift from the buyers to the sellers over three trading periods. Because it's a more drawn-out battle, the Evening Star is generally seen as a stronger and more reliable signal that a downturn is coming.
Can I Use This Pattern on Any Timeframe?
Absolutely. You'll spot the Evening Star on everything from one-minute charts all the way up to the weekly and monthly charts.
A quick pro tip: Patterns that form on higher timeframes (like the daily or weekly) are a bigger deal. They often signal larger, more sustained market moves. If you're day trading, you'll get much better results using the Evening Star when it aligns with the dominant trend on a higher timeframe.
Ready to stop guessing and start trading with confidence? At Colibri Trader, we teach you how to read the market's story through pure price action—no complex indicators needed. It's the no-nonsense education you need to succeed in any market condition.