


Mastering the engulfing bullish pattern for smarter trades
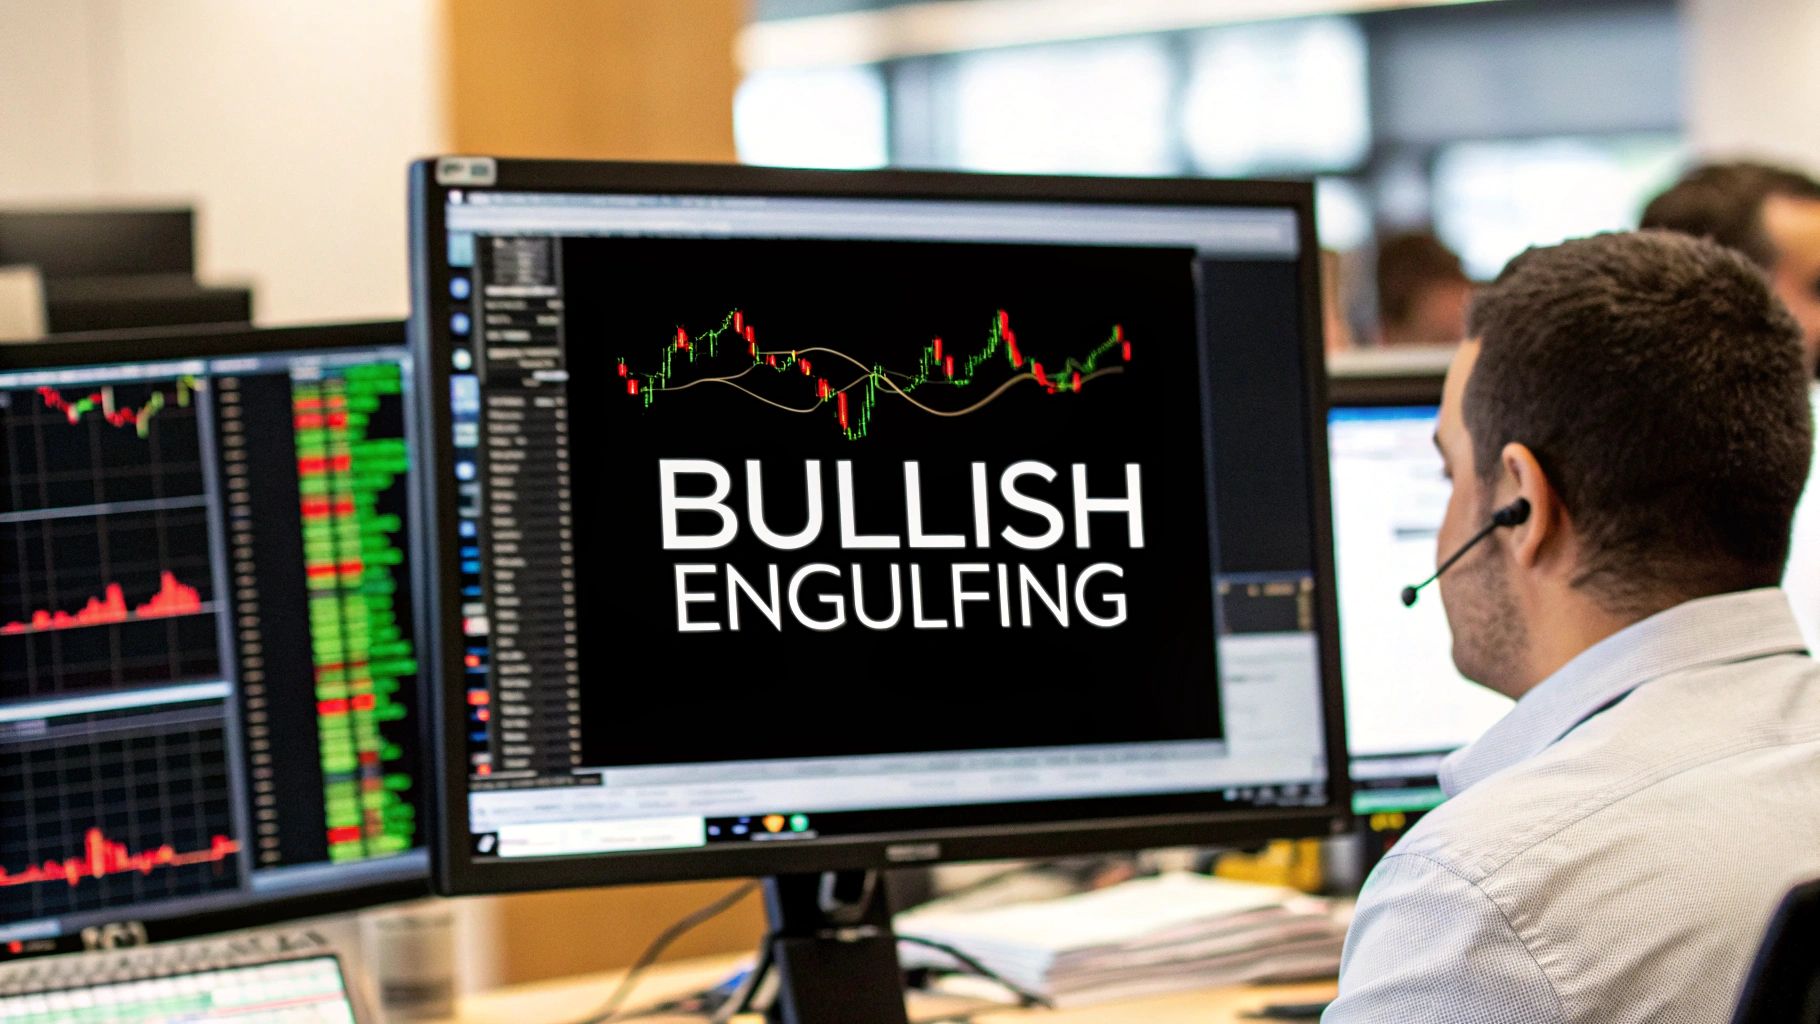
The engulfing bullish pattern is one of the most powerful two-candlestick signals you'll find, often flagging a potential reversal from a downtrend to an uptrend. It pops up on a chart when a large bullish (green) candle completely overshadows, or "engulfs," the body of the smaller bearish (red) candle right before it.
This is a crystal-clear sign of a dramatic shift in momentum from selling to buying.
Decoding the Bullish Reversal Signal

Think of it like watching the tide suddenly change course. A small, weak wave recedes (that's our bearish candle), only to be completely overwhelmed by a much larger, powerful wave pushing forward (the bullish candle). That's the exact story this pattern tells on a price chart.
It's a cornerstone of price action trading for a reason. It visually captures a decisive victory for the buyers. The first candle shows sellers are still around, but they're losing steam. Then, the second candle opens lower but rallies with so much force that it closes above the high of the previous candle, completely wiping out the sellers' efforts.
It’s a signal that a new wave of optimism is taking over.
The Anatomy of the Pattern
To spot this pattern correctly, you have to know its two distinct parts. It's simple, really.
- Candle One: A small bearish candle that is part of the existing downtrend. Its size hints that the sellers are running out of gas.
- Candle Two: A large bullish candle whose body completely engulfs the entire body of the first candle. This shows a sudden and aggressive takeover by the buyers.
This formation isn't just a couple of lines on a chart; it represents a major psychological shift. It tells observant traders that the bears have lost their grip, and the bulls are now in the driver's seat. If you're looking for more patterns, this handy candlestick patterns cheat sheet is a great resource to have bookmarked.
Key Takeaway: The engulfing bullish pattern is a visual representation of a power struggle where buyers decisively defeat sellers, suggesting that a price bottom is in and an uptrend may be starting.
Bullish Engulfing Pattern at a Glance
The table below gives you a quick summary of this pattern's core traits, where you want to see it, and the powerful message it sends to traders. Getting these fundamentals down is the first step to using this signal effectively.
| Characteristic | Description | What It Means for Traders |
|---|---|---|
| Pattern Type | Two-Candle Bullish Reversal | Signals a potential end to a downtrend and the start of an uptrend. |
| Location | Appears at the bottom of a downtrend. | Its reliability increases when found near key support levels. |
| Structure | A large bullish candle engulfs a small bearish candle. | Shows a complete shift from selling pressure to buying dominance. |
| Psychology | From bearish exhaustion to bullish conviction. | Indicates that market sentiment has turned positive, creating a buying opportunity. |
Knowing what to look for—a downtrend, the small red candle, and the big green one swallowing it—is your ticket to spotting these high-probability setups before the crowd.
Identifying High-Probability Bullish Engulfing Signals
Spotting a bullish engulfing pattern is a great start, but the real skill is learning to tell the difference between a random flicker on the chart and a genuinely powerful, high-probability setup.
Not all patterns are created equal. Learning to filter the good from the bad is what separates traders who get lucky once in a while from those who are consistently profitable. Think of yourself as a detective. The pattern is your first clue, but you need more evidence to build a strong case before you risk your capital.
The most critical piece of evidence is always context. A bullish engulfing pattern that pops up in the middle of choppy, sideways price action is usually just noise. It’s meaningless. Its true power is only unlocked when it appears at a significant location on your chart.
You should be actively hunting for this pattern in two specific scenarios:
- After a sustained downtrend: Remember, it's a reversal signal. For a reversal to happen, there has to be an existing trend to reverse.
- At a key support level: When the pattern forms right where buyers have jumped in before, it’s like getting a second opinion that confirms your initial idea.
The Importance of Candle Size and Shape
Beyond just where it appears, the anatomy of the engulfing candle itself tells you a lot about the strength behind the move. A massive green candle that completely dwarfs the previous little red one tells a dramatic story of a sudden shift in power.
Imagine a small group of sellers easily pushing the price down. Then, out of nowhere, a huge wave of buyers storms in, not just halting the decline but aggressively shoving prices much, much higher. A larger bullish candle signifies a more decisive and confident takeover by the bulls. It screams that this reversal has real force behind it.
On the other hand, if the bullish candle barely manages to cover the prior one, the signal is weak. It suggests a timid shift in sentiment, one that could easily fizzle out.
Volume: The Ultimate Confirmation Tool
If location and candle size are your primary clues, trading volume is the final piece of evidence that seals the deal. Volume tells you how many shares or contracts were traded. It’s the ultimate lie detector—it reveals the conviction behind a price move.
A true, high-quality engulfing bullish pattern will almost always happen on a spike in trading volume. That surge in activity confirms that a significant number of market participants are powering the reversal. It’s the market shouting that this change of heart is real and backed by serious buying pressure.
Key Insight: A bullish engulfing pattern on low volume is a major red flag. It suggests there isn't broad participation in the move, raising the risk that the reversal attempt will fail. Always look for volume to validate the price action.
Studies on liquid assets and major indexes show the engulfing bullish pattern can have a surprisingly high success rate when the right conditions are met. Some analysis suggests this rate can climb above 70% when the pattern forms after three or more consecutive bearish candles, which points to an exhausted downtrend. The pattern’s reliability gets a massive boost when that big bullish candle forms on elevated trading volume. If you want to dive deeper, you can explore a full guide on the bullish engulfing candlestick pattern.
By layering these three elements—location, candle size, and volume—you stop being a pattern-spotter and become a trader who qualifies high-probability setups. This methodical approach is the key to trading with confidence and dodging the common traps.
Reading the Market Environment for Confirmation
A bullish engulfing pattern on its own is like a single clue at a crime scene—interesting, but not enough to solve the case. To trade it with any real confidence, you need to see how it fits into the bigger picture. The surrounding market environment provides the essential context that can turn a simple pattern into a high-probability trade.
Think of the pattern as a whisper. A whisper in a quiet room is easy to hear, but a whisper in a noisy stadium just gets lost. The market context is what tells you whether the signal is clear and actionable or if it's just more noise. By learning to read this environment, you can start filtering out the weak signals and focus only on the ones with the highest potential.
A pattern showing up in the middle of random, choppy price action is usually a trap. But when that same pattern forms at a strategic location, backed by other market forces, its reliability shoots up. This is where professional traders separate themselves from the amateurs; they don't just see the pattern, they understand its significance within the broader market narrative.
Support and Resistance: The Battlegrounds of Price
The most potent bullish engulfing patterns materialize at established support levels. Support is simply a price zone where buyers have historically stepped in and stopped prices from falling further. It acts as a floor for the market.
When a bullish engulfing forms right on top of a major support level, you're looking at a powerful confluence of signals. The pattern itself shows a sudden, aggressive shift to buying pressure, and its location confirms this is happening exactly where you'd expect buyers to show up. It’s like two trusted sources telling you the same story.
To spot these zones, look for:
- Previous swing lows: Areas where the price bounced higher in the past.
- Horizontal price shelves: Price levels that have been tested multiple times without breaking.
- Round numbers: Big psychological levels like $50 or $100 often act as informal support.
A bullish engulfing pattern at a strong support level isn't just a reversal signal; it's a defense of a critical price territory by buyers, adding immense weight to its predictive power.
Aligning with the Broader Market Trend
Context also means understanding the dominant, long-term trend. While the bullish engulfing pattern signals a reversal of a short-term downtrend (a pullback), its best use is often as a trigger to rejoin a long-term uptrend.
Picture this: a stock has been climbing for months (the primary uptrend). It then pulls back for a few weeks as traders take profits (the short-term downtrend). A bullish engulfing pattern right at the bottom of this pullback is an ideal entry signal. It suggests the correction is over and the primary uptrend is ready to resume.
Trading with the dominant trend is like swimming with the current instead of fighting it. It dramatically improves your odds. Trying to trade an engulfing pattern against a powerful, long-term bear market, on the other hand, is a much riskier game where these signals often fail.
Gauging Supply and Demand Dynamics
At its core, all price movement is a story of supply and demand. Supply zones are areas packed with sellers, pushing prices down. Demand zones are areas where buyers are concentrated, ready to push prices up. A bullish engulfing pattern is the visual proof that demand has just overwhelmed supply at a specific price point.
The most reliable patterns form at or near clear demand zones. These are often areas where sharp price rallies originated in the past. When price returns to that zone and prints a bullish engulfing candle, it’s a strong hint that the institutional buyers who created the initial rally are likely still there, defending their positions.
This deepens your understanding of what market sentiment is by showing you exactly where the big players are placing their bets. When you see this pattern in a demand zone, you're not just trading a candlestick shape; you're aligning your trade with powerful market forces. This strategic approach helps you avoid weak signals and focus on trades backed by genuine buying interest, giving you a much more solid foundation for your trade plan.
How to Build a Complete Bullish Engulfing Trade Plan
Spotting a perfect bullish engulfing pattern feels good, but that's just the starting line. Turning that pattern into actual profit requires a rock-solid, repeatable trade plan. Think of it as your trading blueprint—it tells you exactly when to get in, where to get out if you're wrong, and where to take your profits.
A good plan takes the emotion and guesswork out of the equation. It forces you to think through every detail before a single dollar is at risk, shifting your mindset from a reactive pattern-spotter to a methodical trader. Without one, even the best signals can end in frustrating losses from sloppy execution.
Let's break down how to build that plan. We'll cover the three pillars of any successful trade: the entry, the stop-loss, and the profit target. Nail these, and you can approach every bullish engulfing setup with discipline and confidence.
Choosing Your Entry Trigger
Once you’ve confirmed a valid bullish engulfing pattern, your first decision is how to enter the trade. This really comes down to your personal risk tolerance. Most traders fall into one of two camps.
The first is the aggressive entry. This is simple: you buy the moment the engulfing candle closes. The big upside here is getting in right at the start, potentially catching the entire reversal move. The risk? It could be a fake-out. The initial burst of buying pressure might fizzle out, leading to a quick dip.
The second is the conservative entry. Instead of jumping in immediately, you patiently wait for a small pullback. You might wait for the price to drift back to the midpoint of the engulfing candle or test the high of the previous red candle. This often gives you a better risk-to-reward ratio and confirms the buyers are still in control, but you always run the risk of the price taking off without you.
Setting Your Stop-Loss for Protection
Your stop-loss isn't optional. It's the single most important tool you have for protecting your capital. Fortunately, with the bullish engulfing pattern, placing it is logical and straightforward.
The rule is simple: your stop-loss always goes a few pips or cents below the low of the big green engulfing candle.
This spot is critical. The low of that candle is the line in the sand where buyers stepped in with force. If the price breaks below that point, the entire bullish argument for the pattern is dead. It means sellers have wrestled back control, and you need to be out of that trade immediately to cut your loss.
Key Takeaway: Placing your stop loss below the low of the engulfing candle is a non-negotiable rule. If that level breaks, the reason you entered the trade is gone.
Defining Your Profit Targets
Knowing when to exit a winning trade is just as crucial as knowing when to enter. If you don't have a clear target, you're just gambling, hoping for more. You risk watching a great trade turn into a small gain or even a loss.
But before we even think about exits, remember that a trade plan is only as good as the setup itself. This is where confirmation comes in.
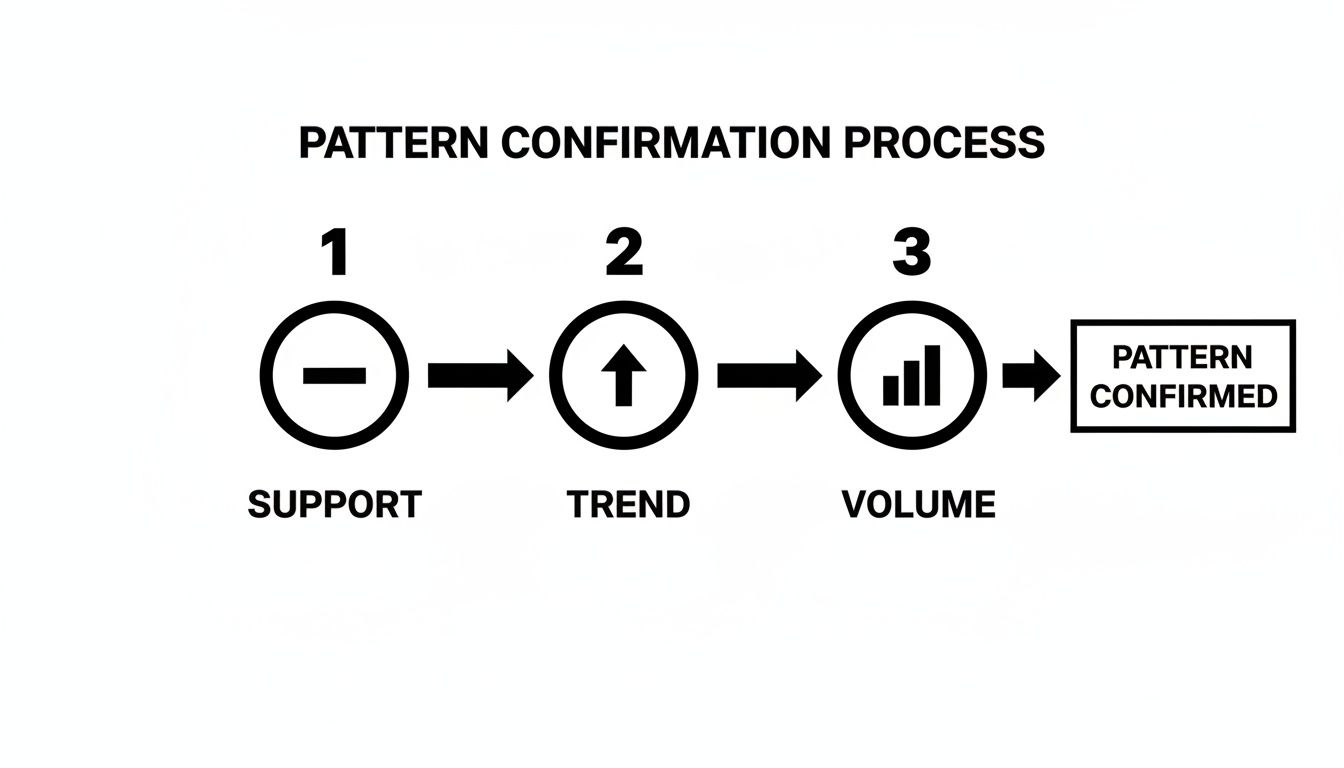
Running through these checks—support, trend, volume—ensures you're only building a plan around a high-probability signal. This makes your exit strategy that much more effective.
Here are three popular ways to set your profit targets:
- Targeting Key Resistance: Look left on your chart. Where did the price struggle before? Find the next significant resistance level, like a previous swing high or a supply zone where sellers previously showed up. That’s a logical place for the rally to stall.
- Using a Fixed Risk-to-Reward Ratio: This is a purely mathematical approach. You set your target as a multiple of your risk. For example, if your stop-loss is 50 pips from your entry, a 2:1 risk-to-reward ratio means your profit target is 100 pips away. This method ensures your wins are always bigger than your losses.
- Trailing Stop: If you think you've caught the start of a major trend, a trailing stop is perfect. It lets you lock in profits as the price moves up while still giving the trade room to run. You can do this by manually moving your stop up below each new swing low that forms.
Understanding the mechanics of how to set your stop-loss and take-profit orders is fundamental to executing this plan correctly.
To help you visualize these choices, here’s a quick comparison of the aggressive versus conservative mindset when building your trade plan.
Entry and Exit Strategies for the Bullish Engulfing Pattern
| Strategy Component | Aggressive Approach | Conservative Approach | Rationale |
|---|---|---|---|
| Entry Trigger | Enter immediately on the close of the engulfing candle. | Wait for a pullback to the midpoint of the engulfing candle. | Aggressive aims to catch the full move early. Conservative seeks confirmation and a better price. |
| Stop-Loss | Place a few pips below the low of the engulfing candle. | Place a few pips below the low of the engulfing candle. | This is the logical invalidation point for both styles; it's the pattern's structural low. |
| Profit Target | Aim for a higher R:R (e.g., 3:1), or use a trailing stop. | Target the nearest major resistance level for a quicker exit. | Aggressive traders may aim for larger moves, while conservative traders prefer securing profits at logical hurdles. |
Ultimately, the right approach depends on what you've backtested and what fits your trading personality. The key is to pick a method, write it down, and stick to it with discipline. By combining a precise entry with a logical stop and a strategic target, you create a complete trading machine that can be tested, refined, and trusted.
Common Mistakes to Avoid with This Pattern
Even the sharpest trading signals can backfire if you misread the field or just plain trade them badly. The bullish engulfing pattern is a powerful tool, no doubt, but plenty of traders—even seasoned ones—fall into the same old traps when using it. Getting profitable isn't just about spotting A+ setups; it's about learning to walk away from the bad ones.
Think of this section as your defensive playbook. Knowing these common errors will give you the discipline to sidestep low-probability trades and wait for the high-conviction setups that really matter.
Trading the Pattern in a Vacuum
This is, without a doubt, the single biggest mistake: seeing the bullish engulfing pattern and treating it like a magic bullet. A trader spots the two-candle formation, gets a rush of adrenaline, and jumps in headfirst, completely blind to what the rest of the chart is saying. That’s just gambling.
A pattern that shows up in the middle of a choppy, sideways market is probably just noise. It means nothing. Its real power is only unlocked when it appears at a meaningful location—like a major support level, a long-term trendline, or a fresh demand zone. Without that confluence of factors, you're not trading, you're just guessing.
Key takeaway: The pattern is just one clue. Never, ever trade it without confirming its importance through market structure, trend, and location.
Forgetting to Check the Volume
Price action tells you what happened, but volume tells you the story behind what happened. A bullish engulfing pattern that forms on weak or dying volume is a huge red flag. It’s a sign that the move has no real muscle behind it.
Think of it like this: a few buyers might have enough strength to push the price up for a single candle, but if there isn't a whole army of buyers right behind them, that little push is going to fizzle out fast. A big spike in volume on the engulfing candle is the confirmation you need—it tells you the big players have shown up. Ignoring volume is like buying a muscle car without checking if it has an engine.
Messing Up Your Stop-Loss
Another classic mistake is botching the stop-loss, and it usually happens in one of two ways. First, traders set their stop way too tight, maybe somewhere inside the engulfing candle's body. This is a rookie move. The market needs room to breathe, and a tight stop like that will get you knocked out by normal price wiggles before the real move even has a chance to start.
The second mistake is the polar opposite: trading with no stop-loss at all. This is pure fear—the fear of taking a small, defined loss. But it's a guaranteed way to suffer a catastrophic loss when the pattern inevitably fails. The only logical place for your stop is just below the low of the engulfing candle. If the price breaks that level, your entire reason for being in the trade is gone. Get out, protect your capital, and live to trade another day.
Forcing Trades That Aren't Really There
Finally, there’s the psychological trap of impatience. After learning about the bullish engulfing pattern, it’s easy to start seeing it everywhere, even on setups that are sloppy and incomplete. This "fear of missing out" (FOMO) is an account killer, pushing you to take trades on patterns that don't tick all the boxes.
Great trading is about discipline. It’s about having the patience to wait for the perfect pitch instead of swinging at everything that comes your way. If the candle isn’t strong and decisive, if the volume isn’t there, or if it’s not at a key level, then the best trade is no trade at all.
While the pattern is a solid signal, statistics show it has a reversal success rate of 63%. But here's the catch: its overall performance rank is surprisingly low. This suggests that while it often signals a reversal, the follow-through move can be weaker than you'd expect. You can dig into more of these valuable candlestick pattern statistics to manage your expectations. This data drives home the point: you have to be selective and only trade the absolute best setups confirmed by other factors.
A Few Final Questions on the Bullish Engulfing Pattern
As we wrap up, it's totally normal to have a few questions rattling around. Honestly, mastering any pattern is a process of asking questions, clearing up confusion, and building a solid foundation. This last section is here to tackle the most common things traders ask about the bullish engulfing pattern, making sure you leave with clarity and confidence.
We'll look at how the pattern acts on different charts, how it stacks up against its bearish twin, and the smartest ways to get your reps in without risking a single dollar. Think of it as the final polish on your new price action skills.
How Reliable Is the Bullish Engulfing Pattern on Different Timeframes?
One of the coolest things about the bullish engulfing pattern is that it’s fractal. That's just a fancy way of saying it shows up everywhere—from the noisy one-minute charts all the way up to the slow-and-steady monthly charts. But, and this is a big but, the timeframe massively changes its significance.
A bullish engulfing on a daily or weekly chart? That's a major market event. It’s the result of a prolonged battle where buyers didn’t just win, they scored a knockout. For swing and position traders, these are the signals that can define a major trading opportunity, often pointing to a much more durable shift in the trend.
Drop down to a 5-minute or 15-minute chart, and you'll see them pop up all the time. While they're still useful for day traders, they're much more prone to market noise and fail more often. An intraday pattern isn't something you trade blindly; it absolutely needs backup from other factors—like forming at a key support level or a sudden spike in volume—to be worth your time.
Is the Bearish Engulfing Pattern Just the Opposite?
Yes, exactly. The bearish engulfing is the perfect mirror image of the bullish one. It’s a powerful sign that an uptrend might be over, signaling a potential reversal into a new downtrend. It happens when a small green candle gets completely swamped by a much larger red candle.
What’s really interesting, though, is that statistics often show the bearish version is actually a more reliable reversal signal. This is a critical insight for any serious price action trader.
Research from technical analyst Thomas Bulkowski reveals a fascinating difference. His work found the bearish engulfing pattern has a 79% reversal rate, a good bit higher than the bullish pattern's 63% rate.
This doesn't mean the bullish pattern is weak. Not at all. It just suggests that in certain market conditions, those sharp, aggressive downward reversals can be more statistically probable. Knowing the relative strengths of both patterns gives you a more nuanced and powerful view of the market's story.
What Is the Best Way to Practice Trading This Pattern?
Without a doubt, the best way to build real skill and confidence with the engulfing bullish pattern is to practice without any financial risk. Practice isn't about making money—it's about building skill. The two most effective ways to do this are backtesting and demo trading.
Here’s a simple process to get you started:
- Manual Backtesting: Open your charts and scroll back in time. Go forward one candle at a time, hunting for patterns that tick all the boxes we've talked about: a clear downtrend, a form-up at support, and a big, decisive engulfing candle.
- Paper Trade the Setup: When you find one, stop. Grab a trading journal and write down your plan. Note the exact entry price, where your stop-loss would go (just below the pattern's low), and your profit target.
- Analyze the Outcome: Now, move the chart forward and see what happened. Did it hit your target? Did you get stopped out? Win or lose, log the result and any notes on what you saw in the price action that followed.
Do this hundreds of times. It might sound tedious, but it will sharpen your pattern recognition skills faster than anything else. You'll start to develop a real gut feel for what a quality setup looks and feels like.
Once you’re consistently spotting winners on paper, you can move to a demo account. This lets you practice the mechanics of live trading—placing orders, managing stops, taking profits—in a real-time environment before you ever put your hard-earned capital to work.
At Colibri Trader, we believe that true trading mastery comes from a deep understanding of price action, not from complicated indicators. Our action-based programs are designed to give you the skills and discipline to trade patterns like the bullish engulfing with confidence. To see if our approach fits your goals, visit us at https://www.colibritrader.com and start your journey today.