


Double Top and Double Bottom: Master Reversal Patterns

The double top and double bottom are classic reversal patterns, and for good reason. They're some of the clearest signals the market can give you that a trend might be running out of gas.
Think of a double top as looking like the letter 'M'. It tells you an uptrend could be on its last legs. The double bottom, on the other hand, forms a 'W' shape, suggesting a downtrend is losing steam.
Reading the Market's Story in Double Tops and Bottoms

Technical patterns aren't just squiggly lines on a chart. They're visual stories of the constant tug-of-war between buyers and sellers. The double top and double bottom patterns are two of the most powerful narratives in price action, showing us exactly where a market tried—and failed—to push its trend further.
Imagine an army trying to take a hill. The first push (the first peak) is powerful, but they get beaten back. After regrouping, they try again, but their second assault fails at the very same high ground. That failure is a massive blow to morale, and it triggers a full-blown retreat. That’s the story of a double top: a clear picture of bullish exhaustion.
The double bottom tells the opposite tale. This time, an army is defending a critical valley. Sellers attack once (the first trough) but are repelled. Their second assault also fails to break through that same support level, showing they've run out of firepower. This successful defense breathes new life into the buyers, who launch a powerful counter-attack, turning the whole trend around.
The Anatomy of the M and W Patterns
To trade these patterns effectively, you have to know their core components. The "M" of a double top warns of a bearish reversal, while the "W" of a double bottom points to a bullish one. At the heart of each pattern is a critical price level that serves as the battle line.
- For a double top, this line is the support level sitting between the two peaks. We call this the neckline. When price breaks below this level, it confirms the sellers have taken control.
- For a double bottom, the neckline is the resistance level between the two troughs. A decisive break above it signals the buyers have finally won the fight.
These patterns are fundamentally tied to the concepts of support and resistance. If you want to get better at spotting these crucial levels, our guide on resistance and support in stocks provides the essential context you'll need.
The real key to trading these patterns isn't just spotting the M or W shape. It's about understanding the psychology driving the price action. Every peak and trough represents a powerful shift in market sentiment.
Before we dive deeper into that psychology, let’s quickly break down the key differences between these two powerful patterns.
Double Top vs Double Bottom At a Glance
Here’s a simple table to help you quickly distinguish between the two patterns. It’s a handy reference for comparing their shape, what they imply for the market, and the psychology behind them.
| Characteristic | Double Top (Bearish) | Double Bottom (Bullish) |
|---|---|---|
| Shape | Resembles the letter "M" | Resembles the letter "W" |
| Prior Trend | Forms after a clear uptrend | Forms after a clear downtrend |
| Market Signal | Potential trend reversal from bullish to bearish | Potential trend reversal from bearish to bullish |
| Key Level | Neckline (support) between the two peaks | Neckline (resistance) between the two troughs |
| Psychology | Bullish exhaustion and failure to make new highs | Bearish exhaustion and failure to make new lows |
As you can see, they are mirror images of each other, both in their structure and in the market story they tell. Now, let's get into the specifics of how to identify and trade them.
The Psychology Driving Reversal Patterns
To really get a grip on the double top and double bottom, you need to see more than just "M" and "W" shapes on a chart. What you're actually seeing is the raw emotion of the market—a battle between hope, greed, and fear playing out in real-time. These patterns tell the story of a failed campaign, where one side runs out of steam and the other takes over.
Once you start seeing this story, you stop memorizing shapes and start reading the market's mind. Every peak and trough is a critical psychological moment where sentiment is shifting, giving you clues for your next move.
The Story of a Double Top: Bullish Hope to Bearish Fear
A double top always kicks off after a solid uptrend. Buyers are feeling confident, maybe a little greedy, and they've been in control for a while. This bullish energy pushes the price to the first peak. At this point, some early sellers or profit-takers decide it's a good time to cash out, causing a natural dip down to a support level we call the neckline.
This pullback doesn't scare anyone at first. In fact, it looks like a classic buying opportunity. Bulls who missed the first leg of the rally see their chance and jump in. Others who were already long might even add to their positions, fully expecting the uptrend to continue. All this fresh buying pushes the price right back up toward that first high.
But this is where the mood changes. As the price gets close to that first peak, you can feel the buying pressure just isn't the same. It stalls out. The second peak forms at or near the same level as the first, sending a clear signal: the bulls don't have the muscle to make a new high. Psychologically, this is a massive blow.
Key Psychological Shift: The moment that second peak fails, hope evaporates and turns into anxiety. The market just proved it can't go higher, and every single trader who bought that "dip" is now sitting on a potential loser.
This anxiety quickly morphs into outright fear. As the price tumbles from the second peak and slices through the neckline, it's like a dam breaking. A flood of sell orders hits the market as late buyers scramble to cut their losses. At the same time, sharp sellers who saw the weakness are now jumping in short, hammering the price down. And just like that, a confident uptrend unravels into a new downtrend.
The Narrative of a Double Bottom: Seller Exhaustion to Buyer Confidence
The double bottom is the exact opposite story. It's about sellers finally running out of gas and buyers slowly but surely regaining their nerve. This pattern shows up during a persistent downtrend where sellers have been firmly in the driver's seat. They push the price down to a new low, which becomes the first trough of our pattern.
At this low, the selling starts to dry up. The most aggressive bears have already sold, and some bargain-hunting buyers start to tiptoe in, causing a bounce up to a resistance level (the neckline). This first rally is usually pretty weak because most people still believe the downtrend is intact.
Sellers see this rally as a chance to get short again at a better price. They make one more big push to drive the market lower, aiming to take out that previous trough. But this time, they falter. The selling pressure evaporates at or right around the same support level, forming the second bottom. Their failure to make a new low is a huge red flag that the bears are exhausted.
This successful defense of support is all the encouragement buyers need. They see that the sellers are spent and start entering the market with real conviction. The rally that follows has much more power behind it, eventually breaking through the neckline and confirming that the balance of power has officially shifted. Understanding this emotional tug-of-war is a huge part of your development as a trader. For a deeper dive, exploring the essentials of mastering trading psychology is well worth your time.
That breakout above the neckline is the final confirmation. It's the signal that buyers are now in control. This triggers a wave of new long positions and forces any remaining short-sellers to buy back their positions to cover, adding even more fuel to the new uptrend.
How to Identify a Valid Double Top Formation

Spotting a potential double top is one thing; confirming it's a high-probability setup is something else entirely. A real double top isn't just any old "M" shape you find on the chart. It's a specific sequence of events—a story the market is telling you about a potential shift from bullish control to bearish dominance.
If you don't learn to read this story correctly, you'll get caught in false signals. Think of it like a detective building a case. You need more than one clue. For a solid double top, there are four critical pieces of evidence you have to find before you can even think about acting. Without all four, you're just gambling.
The Four Pillars of a Double Top
A valid double top formation stands on four key pillars. Each one has to be there. Miss even one, and the probability of the trade working out plummets, leading to some pretty painful mistakes.
-
A Clear Preceding Uptrend: First things first, a double top is a reversal pattern. That means it needs something to reverse. The chart must show a clear uptrend leading into the pattern, with a series of higher highs and higher lows. Without that prior upward momentum, it's not reversing anything—it's likely just sideways chop.
-
The First Peak: After a solid run-up, the price hits a high point and pulls back. This first peak is huge because it establishes the resistance level we'll be watching. It marks the spot where all that buying pressure finally ran into a wall of sellers, causing the first rejection.
-
The Second Peak (The Test): After a brief pullback, the buyers regroup and try to push the price higher again. The second peak forms at or very close to the level of the first peak. This is the moment of truth. If the price fails to break above that first high, it's a massive sign of bullish weakness. The buyers are losing steam.
-
The Neckline (The Trigger): The lowest point the price hits between the two peaks forms a support level we call the neckline. This is the most important line in the entire formation. The double top pattern isn't confirmed until the price breaks decisively below this neckline.
The neckline break is your confirmation. It’s the market screaming that the sellers have officially taken control. Trading before this break is pure speculation; trading after it is strategic. It’s the market’s way of showing you that the old floor of support has just become the new ceiling of resistance.
Putting It All Together Visually
Let's make this real. Imagine a stock has been on a tear for weeks, climbing from $50 to $70. At $70, it hits a wall and drops back to $65. That $70 mark is your first peak, and the $65 level is now your neckline. Hopeful buyers jump in at $65, pushing the price back up for another shot at new highs.
But the rally fizzles out right around $70 again, forming the second peak. This failure is a huge psychological blow to anyone who bought in. The move down from here is often fast and aggressive. When the price finally smashes below the $65 neckline, it confirms the double top. This breakdown triggers a cascade of stop-loss orders from trapped buyers and attracts fresh short-sellers, pouring fuel on the fire.
Performance and Reliability
Understanding these components isn't just theory; the pattern has a well-documented history. Backtesting the double top and double bottom patterns gives us some valuable context. One detailed study of major U.S. stock markets found 454 double top formations. Of those, 341 acted as true reversals, flipping the trend from up to down.
The average price decline after these patterns was 20%, though the most common drop was in the 10% to 15% range. What's really interesting is how close the peaks were—they often differed by just 1%. You can dig deeper and explore more data on the double top strategy to see just how these formations tend to play out over time.
How to Confirm a Genuine Double Bottom Pattern
Where the double top shows us a market running out of buying power, its bullish cousin, the double bottom, tells the story of sellers hitting a wall. Getting good at spotting this "W" shape can be a game-changer, helping you catch trend reversals just as they're starting to turn from bearish to bullish. But here's the catch: not every "W" you see is the real deal.
To truly confirm a double bottom, you need to see a specific story unfold in the price action. It's not just a shape; it's a narrative of sellers trying to push the market down, failing, and finally giving up as buyers step back in with confidence. Think of it like a last-ditch defensive stand at a key support level that finally breaks the attackers' will and opens the door for a powerful counter-offensive.
The Four Essential Components of a Double Bottom
Just like its bearish twin, a high-probability double bottom needs four distinct, verifiable parts. If even one piece is missing, the pattern's reliability plummets, and you risk buying into a false breakout that quickly fizzles out.
-
A Clear Preceding Downtrend: For any pattern to be a reversal, there has to be something to reverse. The double bottom can only appear after a sustained downtrend, marked by a clear series of lower lows and lower highs.
-
The First Trough (The Capitulation): In the middle of the downtrend, price hits a major low point where the selling pressure finally lets up for a moment. This first bottom is often the result of panic selling, and it sets a critical support level on the chart.
-
The Second Trough (The Test): After a short-lived rally, sellers give it one more shot, trying to push the price to new lows. The second trough forms at or very close to the same level as the first. This failure to break support is a huge red flag for the bears—it shows they're losing their conviction.
-
The Neckline (The Confirmation Line): The peak of the rally between the two troughs creates a resistance level we call the neckline. The entire "W" formation is just a potential setup until the price breaks cleanly and decisively above this line.
Volume: The Ultimate Confirmation Signal
Price action tells you most of the story, but volume gives you the inside scoop. It confirms the narrative. Professional traders live and die by volume because it reveals the conviction—or lack thereof—behind the price moves. For a textbook double bottom, the volume should follow a very specific pattern.
The first bottom often happens on high volume as the panic selling hits its peak. But the second bottom? Ideally, it should form on lighter volume. This is a critical clue. It tells you the selling pressure is evaporating; the bears are running out of steam.
The final, and most powerful, confirmation comes with the breakout.
A significant surge in volume as the price breaks above the neckline is the market’s definitive stamp of approval. It shows that buyers are now entering the market with force, ready to take control and drive the new uptrend.
This one-two punch of price and volume gives you a much stronger signal than relying on price alone.
Real-World Performance and Statistics
This isn't just chart theory; the pattern's effectiveness is well-documented. Double bottoms show strong potential to reverse downtrends. The role of volume is absolutely critical here. The first low typically forms on a spike in panic selling, while the second happens on lighter volume, signaling that the sellers are exhausted. When a breakout above the neckline is accompanied by a rise in volume, studies show it provides 80-90% confirmation strength.
Patterns that take several weeks or even months to form, especially with a wide gap between the two troughs, tend to be more reliable. These larger patterns often lead to significant moves, pushing prices up by 20-35% on average after the breakout. You can dig deeper into the statistical reliability of these W-shaped patterns on TrendSpider.com.
By meticulously checking for each of these components—the prior downtrend, the two troughs, the neckline, and the all-important volume signature—you can dramatically improve your odds. You move from just spotting shapes to truly reading the market's story and avoiding those costly false signals.
A Practical Trading Plan for These Patterns
Spotting a double top or double bottom is one thing. Actually trading it for consistent profit is another game entirely. To get there, you need a rock-solid, repeatable trading plan.
This means defining your entry, your stop-loss, and your profit target before you even think about clicking the buy or sell button. A structured approach takes the emotion and guesswork out of the equation. What you're left with is a professional, rules-based strategy.
Without a plan, even the most textbook-perfect pattern can turn into a losing trade. Why? Because of indecision, second-guessing, and poor risk management. Your goal is to build a blueprint that tells you exactly what to do, ensuring you trade the pattern—not your feelings. This is how you bridge the gap between seeing an "M" or a "W" and trading it like a pro.
Choosing Your Entry Strategy
When it comes to trading a double top and double bottom, you have two main ways to get into the trade. Each carries its own risk profile, and the best one for you will come down to your personal risk tolerance and trading style.
-
The Aggressive Entry: This is where you enter the trade before the neckline breaks. For a double top, a trader might go short as the price starts rolling over from that second peak. The upside? A potentially better entry price and a bigger profit margin. The major downside is that the pattern isn't confirmed yet. You're betting that the neckline will break. It's a riskier play.
-
The Conservative Entry: This is the safer, more common approach. You wait patiently for the price to close decisively through the neckline, and then you enter. This confirmation dramatically reduces the chance of a false signal because you’re trading with proven market momentum. An even more patient variation is to wait for the breakout and then a retest of the neckline (which now acts as new resistance for a double top or new support for a double bottom) before pulling the trigger.
For traders looking to bring more advanced tools into their analysis, it's worth exploring methods for leveraging AI for financial analysis to sharpen pattern recognition and decision-making.
This infographic breaks down the confirmation process for a double bottom, showing the critical stages from the initial downtrend to the final breakout.
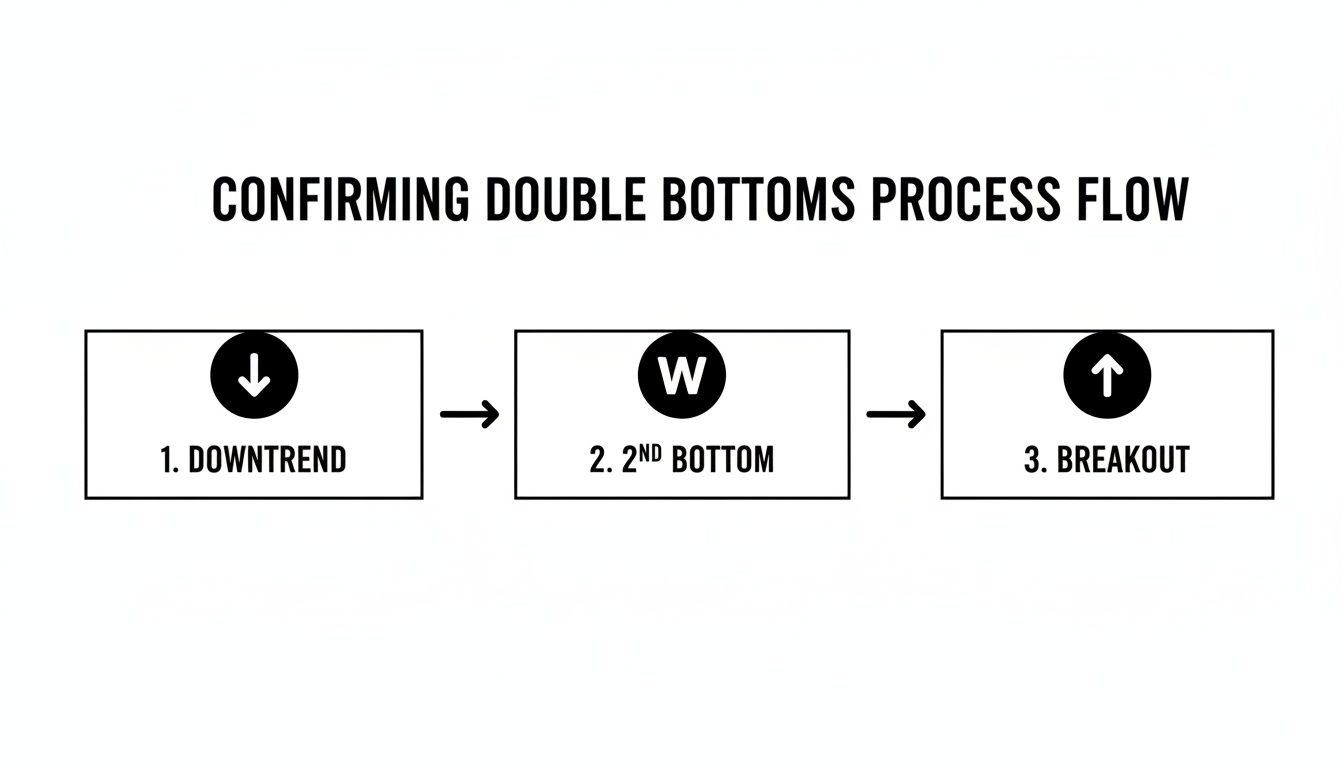
As you can see, that breakout above the neckline is the final, crucial step that validates the pattern and signals a potential bullish reversal.
Setting Your Stop-Loss and Profit Targets
Proper risk management is what separates traders who stay in the game from those who don't. Your stop-loss and profit targets are the most critical parts of your plan because they define your risk-to-reward on every single trade.
A well-defined plan is the cornerstone of disciplined trading. If you're looking to build out your own framework, our comprehensive trading plan template is an excellent place to start outlining your rules.
Stop-Loss Placement:
Think of your stop-loss as your safety net. It’s the predetermined point where you accept the trade idea was wrong and get out to protect your capital. The placement rules are straightforward and based on pure market logic.
- For a Double Top (Short Trade): Place your stop-loss just a bit above the highest high of the two peaks. This makes perfect sense—if the market pushes to a new high, the bearish pattern is invalidated, and you need to exit with a small, manageable loss.
- For a Double Bottom (Long Trade): The stop-loss goes just below the lowest low of the two troughs. If the support level fails and the original downtrend kicks back in, this protects your account.
Crucial Insight: Whatever you do, don't place your stop right at the peak or trough. Give the trade some breathing room. Setting it slightly above or below the extreme price helps you avoid getting knocked out by random market noise or the classic "stop hunt."
Calculating Your Profit Target:
The classic way to set a profit target is simple, logical, and effective. It uses the size of the pattern itself to project a measured move.
-
Measure the Height: Calculate the vertical distance in price from the pattern's highest peak (for a double top) or lowest trough (for a double bottom) down to the neckline. For example, if a double top forms with peaks at $110 and the neckline sits at $100, the pattern's height is $10.
-
Project the Target: From the breakout point of the neckline, project that same distance in the direction of the trade.
- Double Top Example: With a $10 height and a neckline at $100, you would project down from the break. Your profit target would be $90 ($100 – $10).
- Double Bottom Example: If a double bottom has troughs at $50 and a neckline at $55, the height is $5. After the breakout, the profit target would be $60 ($55 + $5).
This method gives you a logical target based on the pattern's own volatility and ensures you have a clear exit plan from the start. By combining these entry, stop, and target rules, you create a complete system for trading the powerful double top and double bottom patterns with confidence.
Common Mistakes and Advanced Trading Insights

Spotting a potential double top or double bottom is one thing, but knowing the common traps that snag most traders is what separates the pros from the rest. Honestly, real trading mastery isn't just about what you do; it's about what you don't do.
The classic rookie mistake? Jumping the gun. So many traders see the first hints of an "M" or "W" and dive in, terrified of missing the move.
This is probably the single biggest reason traders fail with these patterns. Until that neckline breaks, you don't have a confirmed pattern—you have a guess. Trading before confirmation isn't strategy; it's gambling.
Another critical error is misdrawing the neckline. This line isn't just some random line you sketch on a chart. It's the exact support (for a double top) or resistance (for a double bottom) that connects the swing points. A sloppy neckline means false signals and terrible stop placement. Period.
Finally, ignoring volume is like trying to navigate without a compass. A breakout on flimsy, low volume is a massive red flag. It screams that the big players aren't backing the move, and it's likely to fail.
Beyond the Textbook Patterns
As you clock more hours staring at charts, you'll start to see that the market rarely serves up perfect, symmetrical patterns. It's messy and dynamic. The real edge comes from learning to spot the subtle variations.
One of the most powerful is the "Adam & Eve" formation. This is a special type of double top or double bottom that tells a much richer story about the battle between buyers and sellers.
- Adam: This is a sharp, spiky, V-shaped top or bottom. Think of it as a violent, immediate rejection of a price level.
- Eve: This is a wider, rounded, U-shaped top or bottom. It shows a much slower, more grinding momentum shift as one side gradually loses control.
An Adam & Eve double top, for instance, shows an aggressive "Adam" spike followed by a rounded "Eve" top. This combination is incredibly potent. It signals an initial sharp rejection, followed by a slow, agonizing failure by the bulls to push prices higher.
A trader who only hunts for perfect textbook patterns will miss most of the market's best opportunities. Understanding variations like Adam & Eve lets you read the nuances of price action. You adapt to what the market is actually doing, not what a book from 30 years ago says it should do.
By side-stepping common blunders like premature entries and learning to read these more advanced formations, you can trade these classic reversals with a whole new level of precision.
Even after you’ve nailed down a trading plan, real-time markets always throw a few curveballs. When you're trying to apply chart patterns on the fly, questions are bound to pop up. Here are some straight-up answers to the most common things traders ask about the double top and double bottom.
How Reliable Are These Patterns?
Look, no pattern is a crystal ball, but these are pretty darn reliable. One study found that 78.55% of double top and double bottom setups lead to a reversal. That's a strong edge, but it's not a guarantee. False breakouts are just part of the game.
So how do you stack the odds in your favor? You wait for confirmation. Never trade a pattern in isolation. You need other clues from the market to back up what you're seeing.
- Volume: A breakout that happens on a huge surge of volume is telling you something. It shows conviction. A breakout on weak, pathetic volume? That's a red flag.
- Trendlines: If the neckline breaks and a major, long-standing trendline gives way at the same time, that's a powerful one-two punch for a reversal.
- Retests: This is a pro move. Instead of jumping in right at the break, wait for the price to pull back and retest the broken neckline. This simple act of patience filters out a ton of fake-outs.
Can I Use These Patterns on Any Timeframe?
Absolutely. Double tops and bottoms are fractal, which is just a fancy way of saying they show up everywhere—from the frenetic 1-minute charts all the way up to the weekly charts.
But here’s the key: the timeframe changes the significance of the pattern.
A double bottom taking shape on a daily chart carries a lot more weight than one on a 5-minute chart. The longer-term patterns reflect a major shift in market psychology involving a lot more money and time.
What Is the Most Common Mistake to Avoid?
Easy. Jumping the gun. This is the single biggest mistake traders make with these patterns, and it’s a costly one.
You see that "M" or "W" shape starting to form, your heart starts pounding, and you enter the trade before the neckline breaks. That’s not trading; that's gambling.
The pattern is just a potential setup until the price closes decisively beyond that neckline. Patience is your greatest weapon here. Wait for the market to prove you right before you put a single dollar at risk.
Ready to stop guessing and start trading with a proven, price-action based strategy? Colibri Trader provides the clear, no-nonsense education you need to master patterns like the double top and double bottom. Find your trading potential today. Learn more at https://www.colibritrader.com.