


A Trader’s Guide to the Double Bottom Pattern

When you see a 'W' shape emerge on your price chart after a downtrend, you're looking at a double bottom. This isn't just a random squiggle; it's a powerful signal that the bears are losing their grip and the bulls are getting ready to charge. Think of it as a potential turning point where a bearish market might flip to bullish.
Understanding the Battle Behind the W Shape
To really get a feel for the double bottom, you have to see it for what it is: a story of a battle playing out on your screen. It’s more than just a 'W'. It’s a tug-of-war between the sellers who’ve been running the show and the buyers who are digging in their heels for a comeback.
The story starts in a clear downtrend. Sellers are in complete control, pushing the price lower and lower. The mood is pessimistic, and that constant selling pressure eventually drives the price down to form the first trough of the 'W'.
The Bears Make Their First Stand
That first low marks the peak of the sellers' power. They've pushed the price down so far that it finally hits a level where the "smart money"—the early, savvy buyers—starts to see value. They begin to buy, soaking up the selling pressure and causing the price to bounce.
This bounce creates the middle peak of the 'W', and it’s a critical moment. It’s the first real sign of life from the bulls, a hint that the sellers' dominance might be ending. This peak carves out a temporary resistance level, what we call the neckline, which becomes the line in the sand for the fight ahead.
The Sellers' Final Exhausted Push
After getting rejected at the neckline, the sellers try one last time to shove the price back down. They’re running on fumes, but they manage to push the price toward the previous low. This is where the plot thickens.
The second low forms right around the same level as the first. This is the key moment. The sellers' failure to make a new, lower low is a massive tell. It shows they've run out of steam; their attack has been exhausted. The buyers who stepped in at the first low are still there, defending that price with even more determination.
This second failed push is the market shouting that the bearish momentum is dead. The buyers have absorbed everything the sellers could throw at them, setting the stage for a reversal.
Understanding this psychological shift is everything. It’s not just a pattern on a chart; it’s the visual evidence of market sentiment swinging from fear back to optimism. To really grasp how these turning points shape price action, it’s worth exploring the basics of what is market structure.
The double bottom pattern is finally confirmed when the buyers, full of new confidence, punch the price right through that neckline. That breakout is the victory flag. The bulls have won, and a new uptrend is likely beginning. When you can read this story of seller exhaustion and buyer resurgence, you can trade the double bottom with a whole lot more conviction.
How to Spot a Genuine Double Bottom Pattern
Spotting a 'W' on a chart is the easy part. The real skill is knowing if you're looking at a genuine double bottom or just random market noise.
Not every W-shape is a green light for a profitable reversal. To sidestep costly mistakes, you need a clear, rule-based framework to validate the pattern. This isn't about guesswork; it's about systematically checking off boxes to confirm the pattern's structural integrity.
A true double bottom tells a story of sellers running out of steam, and every piece of the pattern has to back up that story. It all starts with one non-negotiable precondition: there must be a clear, significant downtrend to reverse in the first place. A double bottom popping up in a sideways, choppy market is usually a trap, not a real opportunity.
This powerful visual breaks down the shift in market psychology that underpins a real double bottom.
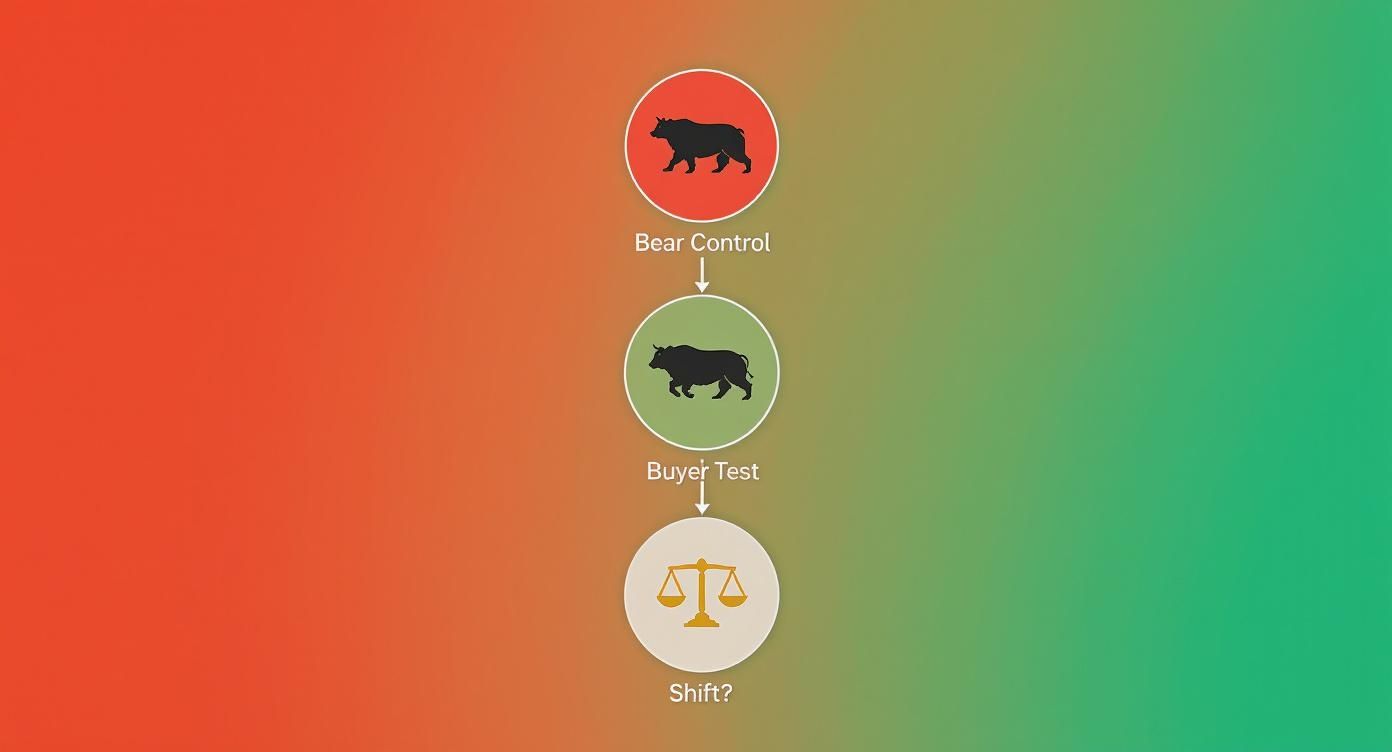
As you can see, the pattern marks that critical transition from sellers being in complete control to buyers stepping in to mount a decisive test, which can ultimately lead to a major shift in the trend.
The Anatomy of a Valid Pattern
Once you've confirmed a prior downtrend, the next job is to dissect the 'W' itself. Each part has to meet specific criteria to qualify as a high-probability setup. Think of these as the ground rules for identification.
Here are the core components you need to scrutinize:
- First Trough: This is the initial low, marking what appears to be the bottom of the downtrend. It sets the critical price level that sellers are going to try—and fail—to break later on.
- Intermediate Peak (The Neckline): After hitting that first low, the price rallies, forming a temporary peak. This peak is massively important because it creates the neckline, a crucial resistance level. The breakout above this line is what ultimately confirms the pattern.
- Second Trough: The price then rolls over from the neckline to retest the previous low. For a valid pattern, this second trough must form at or very near the same price level as the first. If the second low slices significantly lower, the pattern is busted—it's just a continuation of the downtrend.
- Time Between Troughs: The distance between the two lows matters, too. If they form too close together, it might just be minor price chatter. Ideally, you want to see at least a few weeks between the troughs on a daily chart to give the pattern time to mature.
A key feature of a high-probability double bottom is that the two lows are roughly equal, but they are almost never perfect to the penny. Think of this area as a zone of support, not a single, exact price point.
The double bottom is a classic bullish reversal pattern known for that characteristic 'W' shape. Looking at the data, it typically forms after a prior downtrend of at least 10-20% and takes a minimum of around 7 weeks to form, making it a solid mid-term pattern.
Double Bottom Pattern Identification Checklist
To make this process foolproof, use this checklist to quickly validate any potential double bottom. It helps you focus on the key structural and volume characteristics that separate real signals from noise.
| Component | Criteria for a Valid Signal | What to Avoid |
|---|---|---|
| Prior Trend | A clear, established downtrend must exist. At least a 10-20% drop. | Formations appearing in a sideways range or during a strong uptrend. |
| Two Troughs | Two distinct lows at roughly the same price level. The second low can be slightly higher or lower. | A second low that is significantly lower than the first (trend continuation). |
| Neckline | A clear peak between the two troughs, forming a horizontal or slightly sloped resistance line. | A messy, poorly defined peak that doesn't offer a clear breakout level. |
| Time Separation | At least 4-7 weeks between the troughs on a daily chart. | Troughs that are too close together (e.g., just a few days apart). |
| Volume Pattern | Volume is often heavier on the first low, lighter on the second, and expands significantly on breakout. | Heavy volume on the second low, suggesting strong selling pressure still exists. |
| Breakout Confirmation | A decisive close above the neckline on strong volume. | A weak move above the neckline with low volume, which often fails (a "fakeout"). |
By running every potential setup through this list, you can dramatically improve your odds and filter out the weak signals that trap so many traders.
Validating the Key Levels
The relationship between the lows and the neckline is what gives the pattern its power. The two troughs work together to establish a strong floor of support. Of course, a solid grasp of how to properly identify support and resistance levels is fundamental to trading this pattern well.
The neckline represents the ceiling that buyers absolutely must shatter to prove they're back in control. The distance from the lows up to this neckline isn't just a structural quirk; it's a key ingredient we use to project a potential price target once the breakout happens.
By systematically checking each of these criteria—prior trend, two solid lows, a clean neckline, and enough time between them—you can stop chasing shadows and focus only on the most promising double bottom formations.
Executing Your Trade Entry, Stop Loss, and Targets
Spotting a high-probability double bottom is a great start, but it's only half the battle. A perfect pattern is pretty much useless if you don’t have a crystal-clear, repeatable plan to actually trade it. This is where the rubber meets the road—translating your chart analysis into a concrete plan of action.
This means defining exactly how you'll enter, where you'll cut your losses, and how you'll take profits.

Without a rock-solid plan for these three key elements, you’re not trading; you’re gambling. By figuring out your entry trigger, stop loss, and profit targets before you even think about clicking the buy button, you yank emotion out of the driver's seat and replace it with discipline. And that, right there, is the cornerstone of consistent trading.
Choosing Your Entry Strategy
There’s no single "best" way to get into a double bottom trade. Instead, you have a few different options that cater to various risk tolerances and trading styles. Each approach offers its own unique balance between risk and potential reward.
Here are three battle-tested entry techniques you can put to work:
-
The Aggressive Entry (Highest Risk): This is for the traders who like to get in early. It involves buying near the second low as it’s still taking shape. The big plus here is a fantastic risk-to-reward ratio because your entry point is just a stone's throw from your potential stop loss. But make no mistake, this is the riskiest way to play it. The pattern isn't confirmed yet, and you're essentially trying to catch a falling knife.
-
The Standard Entry (Balanced Risk): This is the most common and, for many, the most reliable method. You simply wait for the price to break out and close decisively above the neckline, ideally on a spike in volume. That breakout is the market screaming that the buyers have officially wrestled back control, giving you solid confirmation that the double bottom is valid.
-
The Conservative Entry (Lowest Risk): Sometimes, after the initial breakout, the price will dip back down to retest the old neckline, which should now act as a new floor of support. Entering on a successful retest of this level gives you another layer of confirmation that the trend has turned. It often leads to a higher-probability trade, but there's a catch: you might miss the move entirely if the price never pulls back for a retest.
Whichever entry you choose, consistency is king. Pick one method that clicks with your trading personality and work on mastering it. Hopping between strategies just leads to inconsistent results and a whole lot of second-guessing.
Setting Your Protective Stop Loss
Let's be clear: no trading strategy is foolproof. The double bottom pattern can and will fail sometimes. Your stop loss is your non-negotiable safety net. It’s the order that gets you out of the trade automatically if the market proves you wrong. Honestly, it's the most critical piece of your entire risk management puzzle.
For the double bottom, the most logical spot for your stop loss is just a tick below the lowest low of the two troughs. This level is your ultimate line in the sand. If the price breaks below this area, the whole bullish idea behind the pattern is shot. Placing your stop here makes sure that if the sellers regain control, you get out with a small, manageable loss.
Calculating Your Profit Targets
Okay, your trade is live and your stop is in place. The final piece is knowing where to cash out. Having a clear target stops you from bailing on a winning trade too early out of fear or, just as bad, holding on too long out of greed.
There are two main ways to set profit targets for a double bottom:
-
Method 1: The Measured Move: This is the classic textbook technique. You measure the vertical price distance from the pattern's lowest trough all the way up to the neckline. Then, you project that same distance upward from the neckline breakout point. This gives you a logical, minimum price target based purely on the height of the pattern itself.
-
Method 2: Key Resistance Levels: This requires you to look to the left on your chart. Find previous significant resistance levels—areas where the price has stalled or reversed in the past. These old price zones often act like magnets and are natural places where a new rally might run out of steam.
By combining a clear entry signal with a pre-defined stop loss and profit target, you build a complete trading plan. This structured approach is what allows you to effectively calculate your risk to reward ratio for every single setup, ensuring your potential gains are worth the capital you're putting on the line. This disciplined process is what separates the pros from the amateurs.
Why Trading Volume Can Make or Break Your Trade
Price action shows you what is happening in the market, but volume reveals the story behind why it’s happening. Think of volume as the fuel in the engine. A sports car might look fast, but without gas in the tank, it's not going anywhere meaningful. In the same way, a price pattern without convincing volume is usually just market noise.
When you're trading a double bottom, looking at volume isn't just a "nice-to-have" — it's a critical confirmation tool. It gives you a peek into the conviction of both buyers and sellers, helping you sort the high-probability reversals from the deceptive fakeouts that are destined to fail.

This relationship between price and volume tells the true story of the battle between bulls and bears. By learning to read this story, you can dramatically improve the reliability of your trades.
Reading the Volume Signature of a Strong Reversal
A genuine double bottom has a distinct volume "signature" that unfolds in a few key stages. Each stage gives you another clue about the shifting balance of power from sellers to buyers. Ideally, you want to see a very specific sequence play out.
The ideal volume progression looks like this:
- First Low: Volume is typically moderate to heavy as sellers shove the price down to the first bottom. This shows the final, forceful push of the existing downtrend.
- Second Low: As price drops to form the second bottom, volume should be noticeably lighter than it was on the first low. This is a crucial sign of seller exhaustion. It suggests the selling pressure is drying up and there's very little conviction behind this last gasp downward.
A decline in volume on the second low is one of the most powerful tells in technical analysis. It signals that sellers are running out of ammunition, making it much easier for buyers to step in and take control.
This dwindling participation from sellers is exactly what you want to see. It sets the stage for the most important part of the volume story: the breakout.
The Breakout: The Market's Stamp of Approval
The final, and most decisive, piece of the puzzle is the volume on the breakout. As the price pushes up and closes above the neckline, you absolutely must see a significant surge in trading volume.
This spike in volume is the market’s stamp of approval. It’s confirmation that institutional buyers and other big players are stepping in with force, committing real capital to the new upward direction. A breakout on low volume is a massive red flag. It often points to a lack of genuine buying interest and a high probability of failure.
Think about these two scenarios to see the difference:
| Scenario | Volume Signature | Market Implication |
|---|---|---|
| Confirmed Breakout | A sharp, undeniable increase in volume. | Strong institutional buying pressure confirms the reversal. High probability of follow-through. |
| Potential Fakeout | Low or average volume, barely above the recent norm. | Lack of conviction from buyers. The move is weak and likely to roll over and head back down. |
In short, a double bottom pattern tells a story of seller fatigue followed by buyer dominance. The price action sketches the outline, but it’s the volume that fills in the crucial details and confirms the plot twist is real. Ignore it at your own peril.
Real World Examples of Double Bottom Patterns
Reading about chart patterns is one thing. Seeing them play out in the wild, on a real price chart, is where the lessons truly sink in.
Let's bridge that gap between theory and what you’ll actually see on your screen. We're going to dissect a few historical examples of the double bottom across different markets. This is how you sharpen your eye and start spotting the key components in a live environment.
Each example is a mini case study. We won't just look at the "W" shape, but also the crucial context of volume and what happened next. By looking at what worked and what didn't, we can build a much smarter approach to trading this classic reversal signal.
Successful Reversal in a Major Stock
Let's walk through a classic example in the stock market. Picture a well-known tech company that's been in a steady downtrend for months, with its stock price bleeding out over 25%. The mood is grim, and sellers are firmly in control.
Then, things start to change. The selling pressure eases up, and the stock hammers out its first significant low on heavy volume. This is the first anchor point—a critical support level is now on the map. After a brief rally of about 10%, the price bumps its head on resistance and rolls over. That peak just created the neckline of our potential pattern.
Now comes the moment of truth. The stock drifts back down toward that first low, but here's the key: this time, the volume is noticeably lighter. This is a huge clue pointing to seller exhaustion. The price finds its footing at almost the exact same level as the first low and begins to turn back up.
The pattern is officially confirmed when the stock surges through the neckline on a massive spike in volume. This isn't a gentle move; it's an explosion of buying pressure that kicks off a powerful new uptrend, ultimately rallying over 30% in the following months.
A Forex Pair Reversal Example
The Forex market is a fantastic hunting ground for this pattern, thanks to its deep liquidity and clear trend cycles. History is littered with examples of the double bottom's power, especially in volatile times. One of the most famous instances was in the S&P 500 index in the late 1990s, where the pattern kicked off a massive bull run. In Forex, it's a go-to reversal setup in heavily traded pairs like the New Zealand Dollar vs. US Dollar (NZD/USD). You can explore more about the history of this pattern at Strike.money.
Imagine the NZD/USD pair after a long, grinding downtrend. The pair carves out its first low, bounces to form an intermediate peak (our neckline), and then sells off to retest that initial low. The two troughs land at nearly identical prices, building a solid floor of support.
When the price finally breaks decisively above the neckline, it’s a clear signal that momentum has shifted from sellers to buyers. This kind of breakout often kicks off a multi-week uptrend.
Learning from a Failed Pattern
It's just as important to study the patterns that fall apart. In fact, analyzing failures is one of the best ways to learn, as it hammers home the importance of waiting for confirmation signals—especially volume.
Picture a cryptocurrency that looks like it's forming a perfect "W" after a sharp sell-off. It has all the right ingredients: a clear prior trend, two distinct lows at the same level, and a well-defined neckline. Everything looks textbook. The price then pushes above the neckline, and you can almost hear the buy orders getting triggered.
However, there’s a critical piece missing: the volume on the breakout is weak and uninspired. This lack of participation is a huge red flag.
Instead of accelerating higher, the price just sort of hovers above the neckline for a few candles before crashing right back below it. This "fakeout" traps all the eager buyers, and the downtrend resumes with a vengeance.
This kind of scenario powerfully illustrates that a breakout without a convincing surge in volume is often a trap, not a genuine reversal. By patiently waiting for that volume confirmation, you can sidestep these costly mistakes.
Common Questions About the Double Bottom Pattern
Even when you feel like you've got the rules down, a few questions about the double bottom pattern always seem to pop up. It's totally normal. Getting these common sticking points cleared up is what builds the confidence to actually pull the trigger in a live market.
Let's walk through the most frequent questions I hear from traders. Tackling these head-on will help you move from knowing the theory to applying it correctly when your money is on the line.
Is the Double Bottom Pattern Reliable?
This is usually the first thing traders ask, and the honest answer is: it depends. No chart pattern is a crystal ball, and the double bottom is no exception. Its reliability hangs on a few critical factors—how well it's formed, whether volume confirms the move, and what the bigger market picture looks like. A clean, textbook pattern is always going to have a better shot than a sloppy, ambiguous one.
So, what do the numbers say? Statistical studies show a mixed bag. One analysis of over 1,300 patterns found that about 34% correctly signaled a bullish reversal. In plain English, that means a valid double bottom leads to a real, sustained price rise roughly one-third of the time. You can dig into those findings on Bapital.com if you want to see the data for yourself.
The key takeaway here is that the double bottom pattern offers a statistical edge, not a guarantee. Real success comes from pairing the pattern with rock-solid risk management, ensuring your winners make you more than your losers cost you.
This is exactly why you can't trade any pattern in a vacuum. You absolutely must use volume to confirm your read on the market's intention and have a disciplined stop-loss in place for when the pattern inevitably fails.
What Is the Difference Between a Double and Triple Bottom?
Think of a triple bottom as the double bottom's more stubborn cousin. Both are bullish reversal patterns that show up after a downtrend, but their structure tells a slightly different story.
- Double Bottom: You get two distinct lows at roughly the same price level, creating that classic "W" shape. It tells you sellers tried to push prices lower a second time and failed.
- Triple Bottom: This pattern has three distinct lows at nearly the same price level. Here, sellers have been rejected on three separate occasions, which signals even greater resilience from buyers.
Because that support level has been tested and held one extra time, the triple bottom is generally seen as a stronger, more reliable reversal signal. The trade-off? It doesn't show up nearly as often as the double bottom. For both patterns, though, the trading mechanics are pretty much the same: you're still looking at the neckline for an entry and using the lows to set your stop-loss.
Can You Trade This Pattern on Smaller Timeframes?
Absolutely. The double bottom is what we call a fractal pattern. That's just a fancy way of saying it appears on all timeframes, whether you're looking at a 1-minute chart or a monthly one. A day trader might play a double bottom that forms over a couple of hours on a 15-minute chart. A long-term investor, on the other hand, might use a massive double bottom that took months to form on a weekly chart as a signal that a major market bottom is in.
But trading it on lower timeframes comes with a few warnings:
- More Noise: Smaller timeframes are full of random price wiggles, or "noise." This can create a lot more false signals and failed patterns that look good at first but go nowhere.
- Faster Pace: Things happen fast. The patterns form and play out much more quickly, which means you have to make decisions and execute trades in a fraction of the time.
- Context is King: A double bottom on a 5-minute chart becomes a much higher-probability setup if it's forming at a major support level you've identified on the hourly or daily chart. Always check the higher timeframe context.
While the rules for spotting and trading the pattern are the same no matter the chart, success on the lower timeframes demands more skill and discipline. The faster pace and increased noise leave very little room for error.
At Colibri Trader, we teach you how to master price action patterns like the double bottom without relying on confusing indicators. Our action-based programs provide the clear, practical skills you need to trade with confidence and achieve consistent results. Discover your trading potential with us today.