


Difference Between Ask Price and Bid Price: How It Affects Your Trades
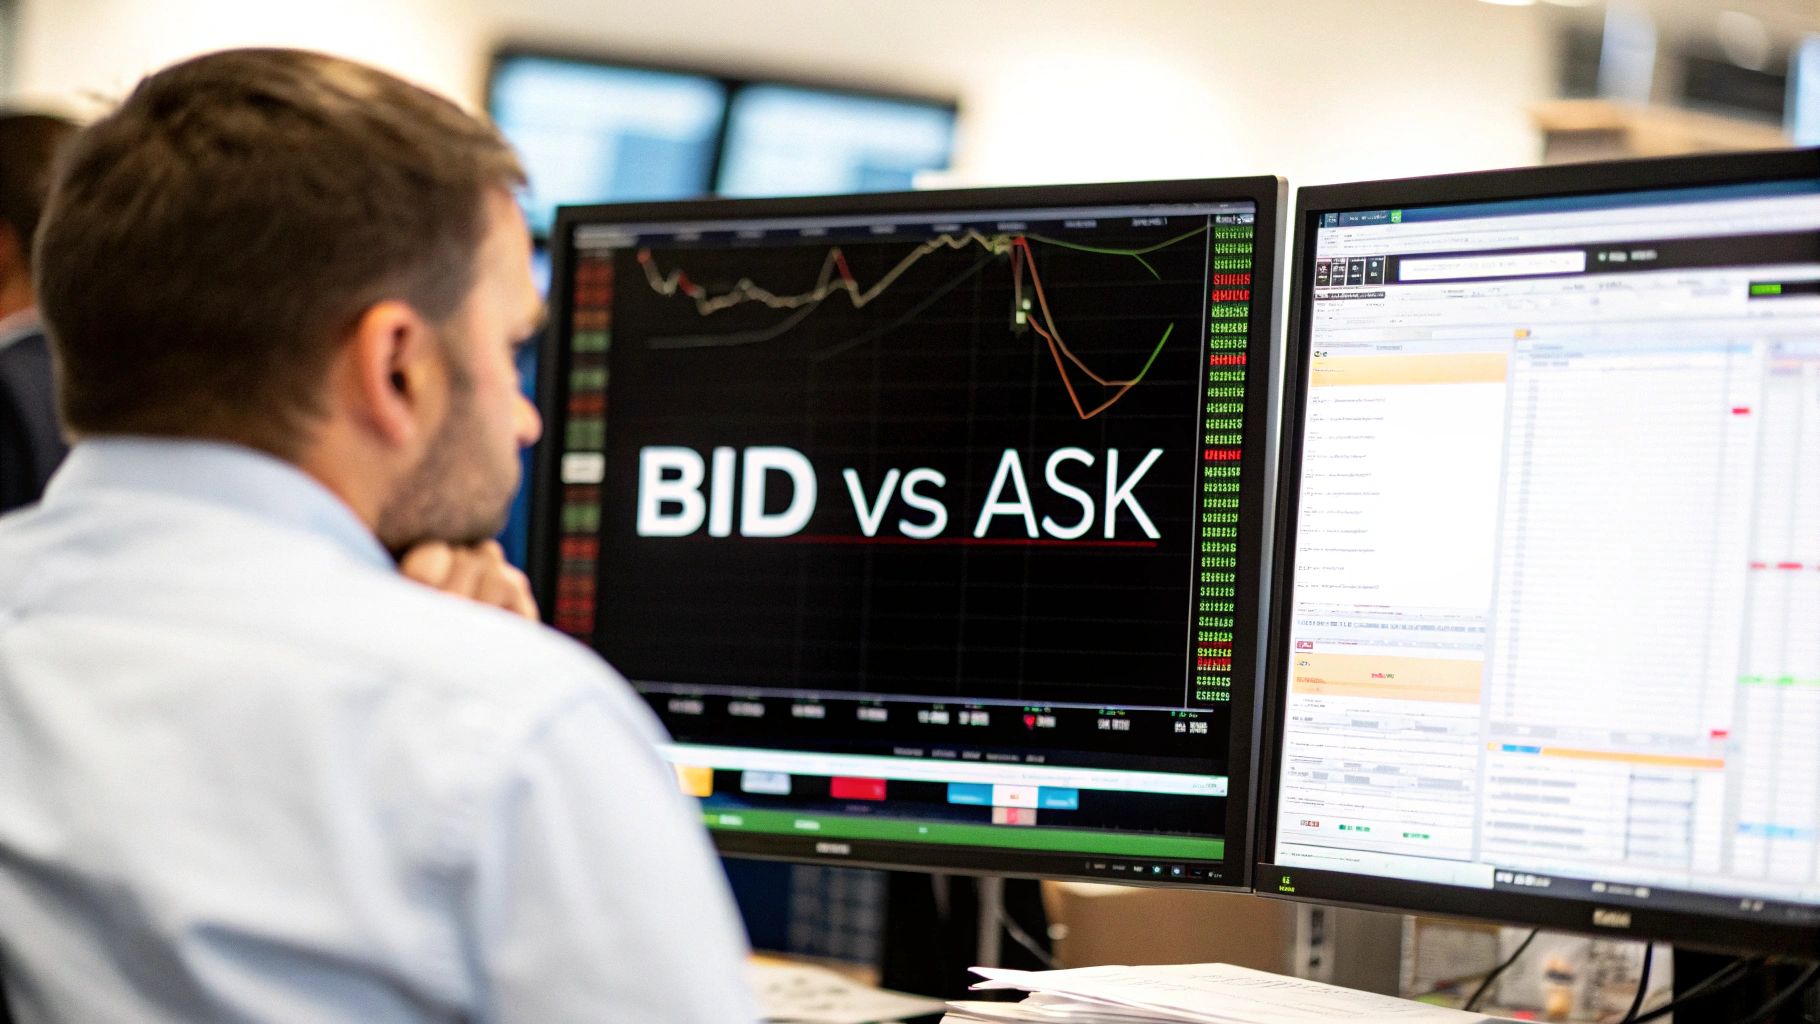
At its heart, the difference between the ask price and bid price is pretty simple. The ask price represents the lowest price a seller is willing to take for an asset, while the bid price is the highest price a buyer is willing to pay for it.
This means you will always buy at the ask price and sell at the bid price.
Your Quick Guide to Bid Price vs Ask Price

Let's use a real-world example most of us can relate to: buying a used car.
Imagine you're selling your car and you list it for $10,000. That's your ask price—the absolute minimum you'll accept. A potential buyer comes along and offers $9,500. That's their bid price—the maximum they're willing to pay.
The $500 difference between your asking price and their bid is what traders call the bid-ask spread. This exact same principle applies to every financial market out there, whether you're trading stocks, forex, or crypto.
The Two Sides of Every Trade
Every single transaction needs a buyer and a seller. Their competing goals are what create the market's two-sided pricing structure. Sellers naturally want to get the highest price they can, while buyers are always hunting for the lowest price possible. This constant push and pull is the very engine that drives price discovery.
If you want to go deeper into the market mechanics behind this pricing tug-of-war, this resource offers a great breakdown: A Trader's Guide to Auction Market Theory.
Key Takeaway: As a retail trader, you always buy from a seller at their higher ask price and sell to a buyer at their lower bid price. The broker or market maker pockets the small difference—the spread—as their fee for facilitating the trade.
Understanding this is your first step toward seeing how markets really work. The spread isn't just some trivial detail; it’s a direct transaction cost you pay on every single trade. Before we dig into why managing this gap is so crucial for your profitability, let's break it down with a simple comparison.
Bid vs Ask Price at a Glance
This table offers a quick side-by-side look at the two prices that define every market transaction.
| Characteristic | Bid Price | Ask Price |
|---|---|---|
| Perspective | Buyer's Price | Seller's Price |
| Action | The price you receive when you sell an asset. | The price you pay when you buy an asset. |
| Value | Always lower than the ask price. | Always higher than the bid price. |
| Represents | Demand for the asset. | Supply of the asset. |
In short, the bid shows what the market is willing to pay right now, while the ask shows what it's willing to sell for. The space between them is where the trading happens.
The Bid-Ask Spread Explained: A Trader's First Hurdle
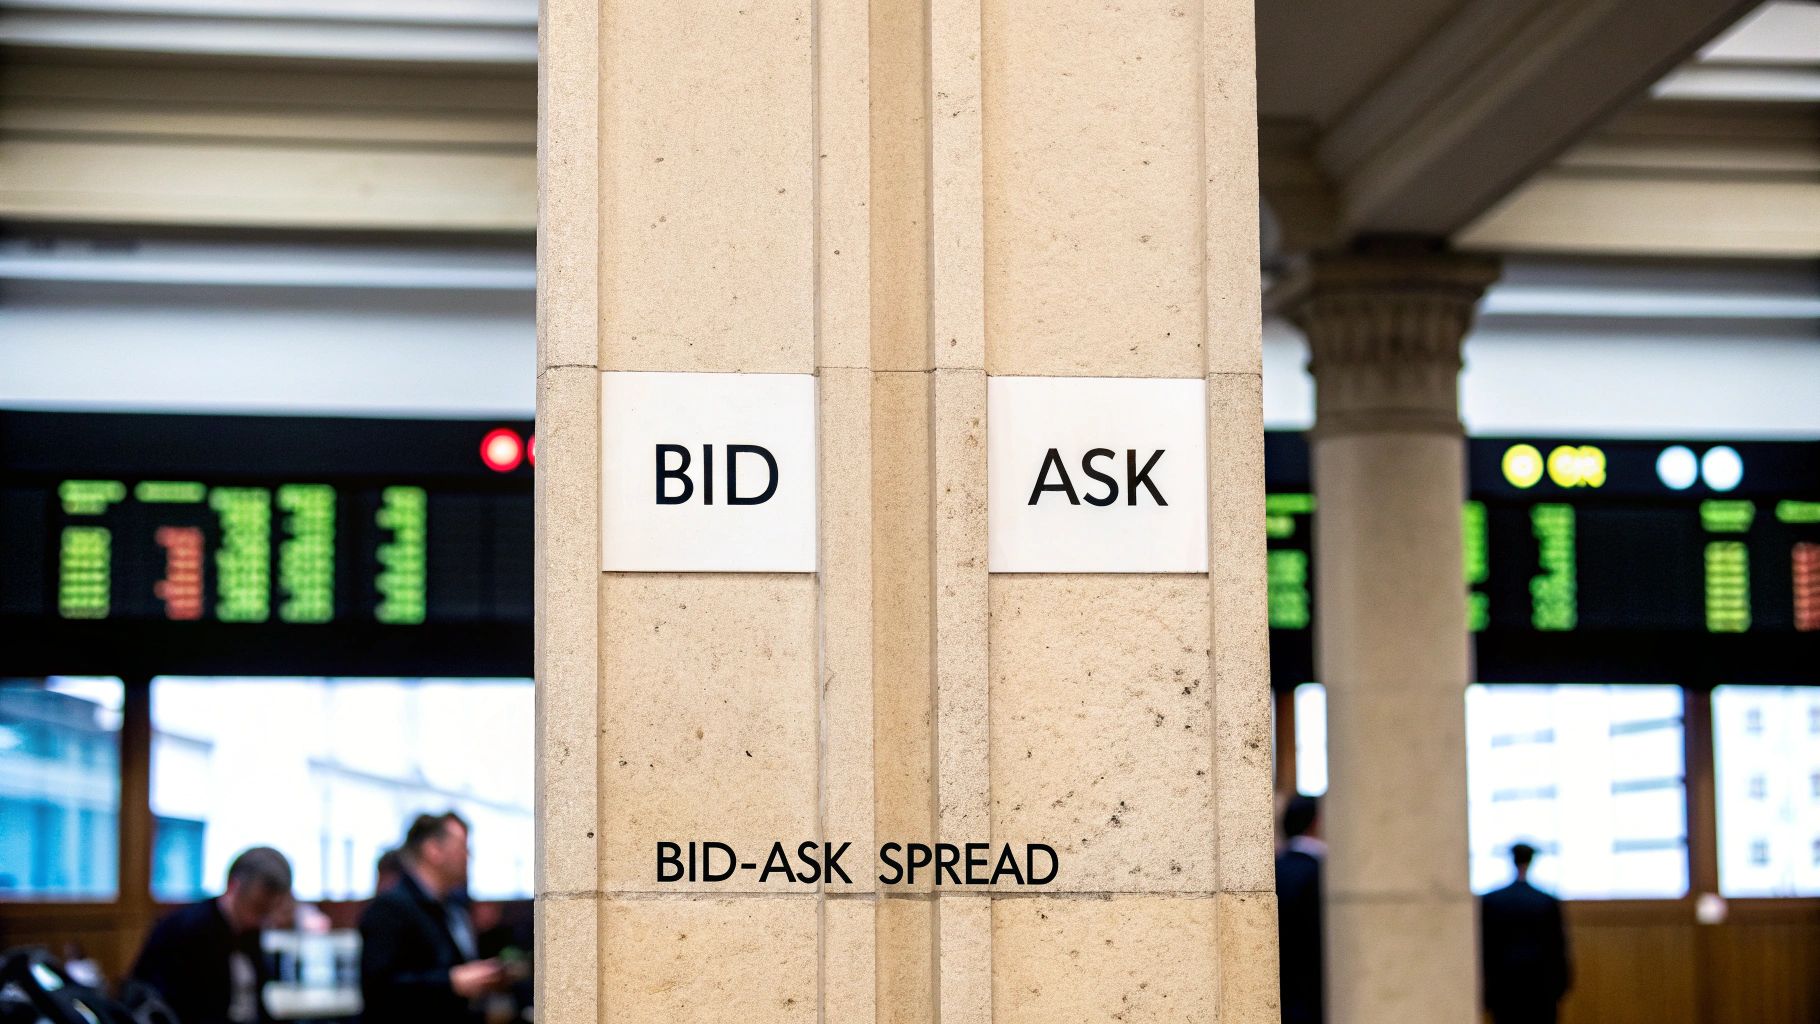
Alright, now that we've nailed down the difference between ask price and bid price, let's talk about the space that lives between them. This gap is called the bid-ask spread, and for any trader, getting a handle on it is absolutely fundamental.
Think of the spread like the built-in fee at a currency exchange counter in an airport. When you swap your dollars for euros, the rate they sell to you (their ask) is always higher than the rate they'll buy them back at (their bid). That small difference is their profit.
The financial markets work the same way. The spread is how market makers—the big players who provide the liquidity for your trades—earn their keep. Every time you buy or sell, you have to "cross the spread," which means you instantly incur a small, unavoidable cost. It’s the first hurdle your trade has to clear just to get back to breakeven.
Why the Size of the Spread is a Big Deal
The width of the bid-ask spread isn't just a random number; it's a real-time report on the asset's health, specifically its liquidity and volatility. A tight spread tells you there’s a crowd of buyers and sellers, while a wide one hints that the market is thin.
- Tight Spreads: You'll find these on the most heavily traded assets. Think major currency pairs like EUR/USD or blue-chip stocks like Apple (AAPL). With so much volume, competition between buyers and sellers is intense, which squeezes the gap between the bid and ask down to almost nothing.
- Wide Spreads: These are common with less-traded assets, like penny stocks or obscure cryptocurrencies. With fewer people in the market, it’s riskier for market makers to fill orders, so they widen the spread to protect themselves. You'll also see spreads blow out during major news events when uncertainty spikes.
Trader's Insight: A consistently tight bid-ask spread is a hallmark of an efficient market. It means you can get in and out of your positions smoothly without giving up too much of your edge to transaction costs.
You can see this in action across major U.S. markets. For example, some highly liquid ETFs, like the Vanguard 0-3 Month Treasury Bill ETF (VBIL), had a median bid-ask spread of just 0.01% in early 2024. Research also shows that for stocks in the Dow Jones Industrial Average, the median spread tightened from 2.5 basis points in 2010 to just 1.8 basis points by 2017—a 30% drop that directly benefits traders.
If you're serious about trading, managing this cost is one of the first and most important steps to building a lasting strategy. For a deeper dive, you can read our guide on what the bid-ask spread is and how it works.
How Spreads Have Evolved for Modern Traders
To really appreciate the edge you have as a modern trader, it helps to rewind the clock. Before trading went digital, the bid-ask spread was a much bigger beast—a significant, unavoidable cost that ate into returns for the average person.
Think about this: not too long ago, stock prices weren't quoted in simple dollars and cents. They were quoted in fractions, like 1/8th or 1/16th of a dollar. This system alone forced spreads to be wide. For many stocks, the absolute tightest spread you could get was $0.0625 (1/16th) or even $0.125 (1/8th). That's a massive gap compared to the sub-penny spreads we often see today. It made short-term trading incredibly expensive and kept most regular folks on the sidelines.
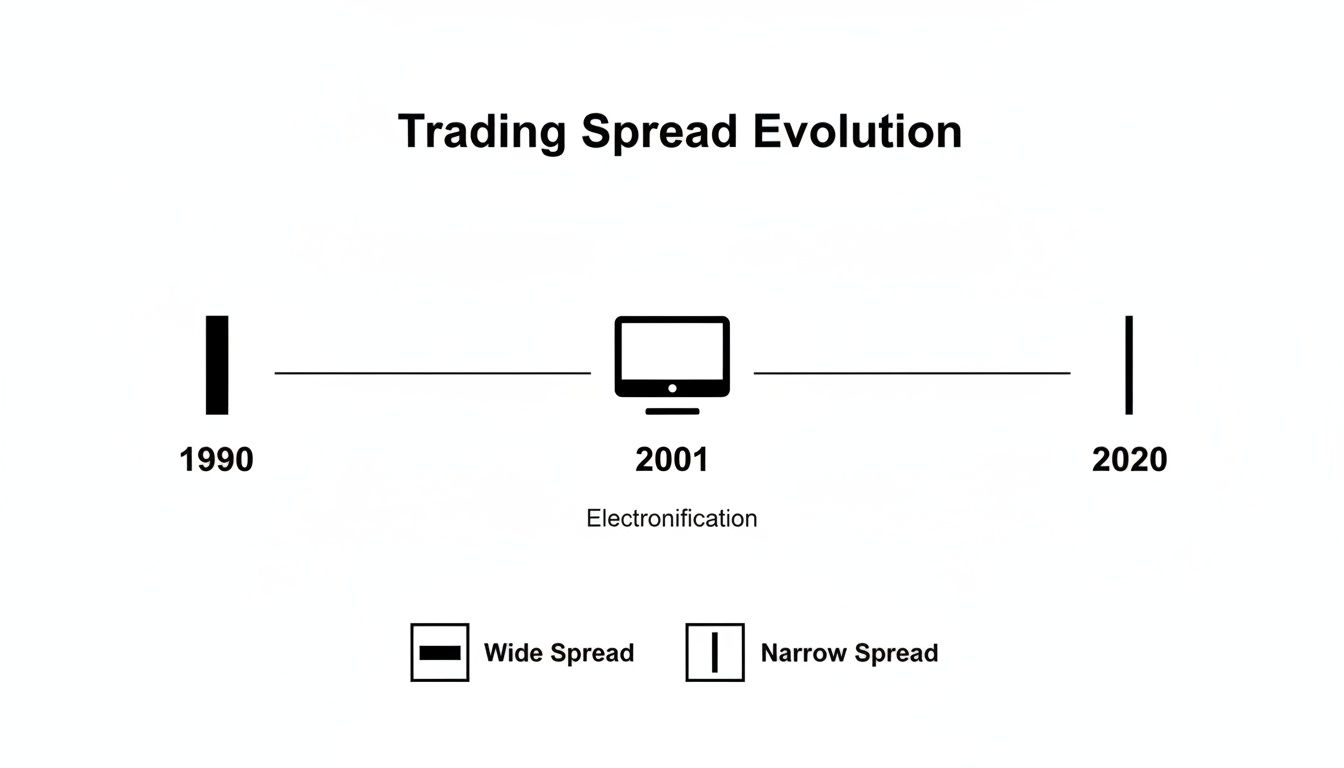
The Great Compression of Trading Costs
Everything changed with two major shifts: the rise of electronic trading platforms and the move to decimalization. In 2001, U.S. markets officially ditched the fractional pricing system. This one regulatory change was the spark that lit the fire, allowing the gap between bid and ask prices to shrink dramatically.
Almost overnight, spreads could collapse from those clunky fractions to as little as a single penny, and now, often just fractions of a penny. Technology poured fuel on that fire. Automated market makers and high-frequency trading firms began battling it out, competing to offer the tightest prices possible. This intense competition is a direct win for you, the trader, as it slashes the built-in cost of getting into and out of a trade.
A Little Historical Perspective: The journey from wide, fractional spreads to today’s razor-thin decimal ones is one of the biggest victories for retail traders. It has leveled the playing field and made it more affordable than ever to actively trade the markets.
The numbers tell the story. Back in the 1990s, spreads on a typical stock could be a hefty 50-60 basis points. By 2000, technology had already squeezed that down to around 20 basis points. But after decimalization kicked in, the drop was even faster. For the 12 Dow stocks, for example, median spreads fell from 2.5 basis points in 2010 to just 1.8 basis points by 2017—that's a 30% reduction in trading friction. You can dig deeper into how these changes saved investors billions in a study from the Modern Markets Initiative.
What This History Means for You
Knowing where we came from highlights the incredible cost advantage you have today. But it’s also a crucial reminder that spreads are not set in stone. When the market gets stressed or liquidity dries up—think of a surprise news event or thin overnight trading—spreads can temporarily blow out and look a lot more like they did in the old days.
This is why you can never get complacent. The favorable conditions we enjoy now can change in a heartbeat, instantly affecting the real cost of your trade. It’s a powerful lesson in staying disciplined and always being aware of the market’s current mood.
Comparing Bid-Ask Spreads Across Different Markets
The size of the bid-ask spread isn't a one-size-fits-all number. It shifts dramatically based on what you’re trading, and what’s considered a “tight” spread in one asset class could be seen as enormous in another. To really get a feel for how this plays out in the real world, let's look at some side-by-side examples.
It's also worth remembering that spreads haven't always been this narrow. Technology has completely changed the game for traders over the last few decades.
As you can see, we've come a long way from the wide, expensive spreads of the 1990s to the razor-thin costs that modern traders often take for granted.
Spreads in Stocks
Let's start with a heavily traded, high-volume stock like Apple (AAPL). The liquidity here is incredibly deep because millions of shares are bought and sold every single day. This creates intense competition between buyers and sellers, which is great for keeping costs down.
On a typical trading day, you might see a bid-ask quote that looks something like this:
- Bid Price: $170.10
- Ask Price: $170.11
- Spread: $0.01
That tiny one-cent spread is exceptionally tight, representing just 0.0059% of the share price. For popular, large-cap stocks, this is business as usual, making the direct cost of getting in and out of a trade very low.
Spreads in Forex
The foreign exchange market is the king of liquidity, especially when it comes to major currency pairs. Here, the spread isn't measured in dollars and cents, but in pips.
Let's take the EUR/USD, the most traded pair in the world. A common quote might be:
- Bid Price: 1.0755
- Ask Price: 1.0756
- Spread: 1 pip
For active traders, that spread is a constant, unavoidable cost of doing business. While major pairs like EUR/USD can hover under one pip during busy market hours, those spreads can blow out to 10 pips or more during quiet periods or right after a major economic news release. You can find more details on how forex spreads behave at Fusion Markets.
A Trader's Reality: A one-pip spread might seem insignificant, but it adds up fast. A day trader working with a 1.2 pip average spread on GBP/USD is paying $12 in transaction costs for every standard lot they trade. Over the course of a year, that "tiny" cost can easily turn into thousands of dollars in friction.
Spreads in Cryptocurrency
The crypto markets are the new kid on the block and are often less liquid than their traditional counterparts. This means that even for a behemoth like Bitcoin (BTC), the spread is usually a bit wider.
A typical quote might look like this:
- Bid Price: $65,500
- Ask Price: $65,510
- Spread: $10.00
While a $10 spread sounds like a lot in absolute terms, it’s still relatively tight for Bitcoin, representing about 0.015% of the price. The real cost comes when you venture into smaller, less-traded altcoins, where spreads can easily jump to over 1%. That makes frequent trading much more expensive.
Typical Bid-Ask Spreads by Asset Class
Here's a quick comparison table to help you visualize how these spreads typically stack up against each other for popular assets.
| Asset | Example Bid Price | Example Ask Price | Spread (Value) | Spread (Percentage/Pips) |
|---|---|---|---|---|
| Stock (AAPL) | $170.10 | $170.11 | $0.01 | 0.0059% |
| Forex (EUR/USD) | 1.0755 | 1.0756 | 0.0001 | 1 Pip |
| Crypto (BTC) | $65,500 | $65,510 | $10.00 | 0.015% |
This table clearly shows that the "cost" of the spread is all relative. Highly liquid markets like major stocks and forex pairs offer incredibly tight spreads, while the less mature crypto market generally involves slightly higher transaction costs baked into the bid and ask prices.
How to Navigate the Spread with Market and Limit Orders
Knowing the bid-ask spread exists is one thing, but knowing how to work with it—or around it—is what separates seasoned traders from the rest. The tools for this job are your order types.
Getting a handle on the crucial difference between a market order and a limit order isn't just a technical detail. It's a strategic choice that directly defines the price you get when you buy or sell.
Think of it like buying concert tickets. You can pay whatever the scalper is asking right now to guarantee you get in the door immediately. Or, you can place a bid online, naming your price, but with no guarantee you’ll actually get the tickets. One is about speed, the other is about price.
Market Orders: The Need for Speed
A market order is your express lane into a trade. When you hit "buy" on a market order, you're essentially shouting to your broker, "Get me in right now at the best price available!" That means your order will instantly fill at the current lowest ask price.
This guarantees your execution, which can be absolutely vital when a stock is taking off. If a key resistance level breaks and you want to ride the momentum, a market order gets you in before the price runs away.
But there's a trade-off. You give up all control over the exact price. You have to "cross the spread" and pay what sellers are demanding at that very instant. In a fast-moving market, this can be a much worse price than what you saw on your screen a moment ago. That's slippage in action.
Limit Orders: The Power of Precision
A limit order, on the other hand, puts you firmly in the driver's seat on price. When you place a limit order to buy, you are setting the absolute maximum you're willing to pay. Your order will sit patiently and only execute if the ask price falls to meet your specified price—or even better.
This is the go-to tool for traders who rely on precision and patience. Let's say you've identified a key support level where you expect buyers to show up. You can set a limit order right at that level, letting the market come to you instead of chasing after it.
Key Insight: A market order prioritizes the speed of getting in over the price you pay. A limit order prioritizes the price you pay over the certainty of getting in at all.
Every trade presents this tactical choice. Beyond just entry orders, this thinking applies to your risk management too. Learning How to Set Stop Losses is a vital next step, as the spread can impact where your stops get triggered. You can also dive deeper into the mechanics of each order in our guide on the market order vs limit order.
Practical Strategies for Managing the Bid-Ask Spread
Knowing what the bid-ask spread is is one thing. Actually navigating it to protect your profits is where the real skill comes in. With a few disciplined habits, you can stop letting the spread eat into your returns.
Timing is Everything
The single best way to beat the spread? Trade when the market is busiest. For forex traders, this means hitting the market during major session overlaps, like when the London and New York sessions are both in full swing. The sheer volume of orders creates intense competition, which forces brokers and market makers to tighten up their spreads significantly.
On the flip side, trading in thin, off-hour markets is a classic rookie mistake that guarantees you'll pay a premium on every single trade.
You also need to keep a close eye on the economic calendar. Big news events—think inflation data or interest rate decisions—can suck all the liquidity out of the market in a heartbeat. In the minutes surrounding these releases, spreads can blow out to shocking levels.
Trader's Edge: Pros often sit on their hands during major news. They know that trying to trade when spreads are that unpredictable is less like trading and more like gambling. It’s just not worth the risk.
Adjusting Your Tactics for the Spread
Beyond just timing your trades, you have to actively account for the spread in your strategy, especially when it comes to setting your stop-loss.
Factor the Spread into Stop-Loss Placement: If you're long a position, your stop-loss triggers based on the bid price, not the price you see on the chart. Placing a stop exactly at a support level is asking for trouble. A tiny dip in the bid price, even if the market price doesn't quite touch support, can knock you out. Always give your stop a little extra breathing room.
Be Patient with Limit Orders: Unless you're chasing a powerful breakout, limit orders are your best friend. Instead of hitting "market buy" and instantly paying the ask price, you can set a limit order to buy at the current bid. This forces the market to come down to your price, letting you enter without immediately giving up the spread.
Avoid Overtrading Illiquid Assets: That obscure crypto or penny stock might look tempting, but the massive spreads can chew through your account before you even get a chance. Stick with highly liquid assets where the costs of doing business are minimal.
At the end of the day, managing the spread is a fundamental part of risk management. It goes hand-in-hand with another hidden cost that trips up many traders. To protect your capital even further, check out our guide on what slippage is in trading.
Common Questions Traders Ask About Bid and Ask
Even after you get the hang of bid and ask, a few questions always seem to pop up. Let's tackle these common sticking points to make sure the concepts are crystal clear.
Why Is the Bid-Ask Spread Always Changing?
The spread is never locked in place; it's a living, breathing part of the market. Its size really comes down to two big factors: liquidity and volatility.
When a market is buzzing with activity—tons of buyers and sellers jumping in and out—the competition gets intense. This naturally squeezes the gap between the bid and ask, making the spread razor-thin. A perfect example is the EUR/USD forex pair during the peak London-New York trading overlap.
But when the market quiets down, the spread widens. You'll see this happen during sleepy overnight sessions, on bank holidays, or right before a major news event. With fewer traders around, market makers take on more risk, so they widen the spread to protect themselves. It's a constant reminder of why when you trade is just as important as what you trade.
Can I Actually Get the Price I See on the Chart?
That's a great question, and the short answer is no. Most charts you look at show the "mid-price," which is just the halfway point between the bid and the ask. It gives you a clean, simple line to follow, but it isn't a price you can actually trade on.
To get into a position, you have to cross the spread.
- To buy, you have to hit the higher ask price.
- To sell, you have to accept the lower bid price.
You can try to get a better price by using a limit order, but there's no guarantee it will ever get filled. The market has to actually move to your price for that to happen.
Think of the chart price as a guidepost, not a destination. Your true entry and exit points are always determined by the live bid and ask quotes.
Does the Spread Matter More for Traders or Investors?
The impact of the spread really depends on your timeline. For a long-term investor making just a few trades a year, the spread is a tiny, one-off cost. It's barely a blip on their overall performance.
For active traders, though, it's a completely different story. If you're a scalper or day trader making dozens of trades every single day, the spread is a constant, unavoidable cost of doing business. Every single time you enter and exit, you're paying that small fee.
For anyone operating on these shorter timeframes, keeping that cost down by trading liquid markets during peak hours isn't just a good idea—it's essential for building a profitable strategy.
At Colibri Trader, we focus on teaching you how to master these core market mechanics. Our price-action approach gives you the tools to build a disciplined and profitable trading plan without getting bogged down by useless indicators. See how we can help you find your edge by visiting us at https://www.colibritrader.com.