


Understanding the Difference Between Ask and Bid Price in Trading
At its core, the difference between the ask and bid price is refreshingly simple. The ask is what a seller wants for an asset, and the bid is what a buyer is willing to pay. This gap, known as the bid-ask spread, is a fundamental transaction cost you'll find in every single financial market.
Deconstructing Bid and Ask Prices

To really get a feel for how markets work, you have to understand the constant tug-of-war between supply and demand. The bid and ask prices are the real-time, numerical proof of this battle. Think of it as a never-ending auction where buyers and sellers are constantly shouting out their intentions.
When you want to buy something right now, you have to meet the seller's price. That's the ask price—it's the lowest price any seller on the market is offering at that moment.
On the flip side, if you need to sell immediately, you'll get the bid price. This is the highest price any buyer is willing to pay. Simple as that.
The Role of the Bid-Ask Spread
That little gap between the bid and the ask? That's the bid-ask spread. It's not just a random gap; it's how market makers—the big players who facilitate all this buying and selling—make their living. For us traders, it's just a cost of doing business.
Here's the takeaway:
- Buying: You always buy at the higher price (the ask).
- Selling: You always sell at the lower price (the bid).
This means that every new position you open starts with a tiny, immediate loss. The market has to move in your favor enough to cover that spread before you even begin to see a profit.
A great real-world analogy is a currency exchange booth at the airport. They'll buy U.S. dollars from you at one price (their bid) but sell them back to you at a higher price (their ask). That difference is their profit.
This spread used to be a much bigger deal. Back in the early days of the NYSE, spreads could easily eat up 2-3% of a stock's value because there just wasn't enough trading volume. Today, modern electronic trading has squeezed those spreads down to almost nothing, but ignoring them entirely can still quietly chip away at your returns over time. You can learn more about how spreads have evolved and their impact on historical trading returns.
Bid vs Ask Price At a Glance
To make this crystal clear, here’s a quick breakdown of how these two prices function from a trader's point of view.
| Concept | Bid Price | Ask Price |
|---|---|---|
| Perspective | Buyer's highest offer | Seller's lowest offer |
| Action for Trader | The price you receive when you sell | The price you pay when you buy |
| Market Role | Represents demand | Represents supply |
| Typical Value | Always lower than the ask price | Always higher than the bid price |
Understanding this table is non-negotiable. Internalizing the fact that you buy high (at the ask) and sell low (at the bid) is the first step to seeing the market through a professional's eyes.
How Liquidity and Volatility Shape the Bid-Ask Spread
That little gap between the bid and the ask price is so much more than a simple transaction cost. I like to think of it as a living, breathing barometer of the market's health. Two massive forces are constantly at play, squeezing this gap tight or stretching it wide: liquidity and volatility. If you can learn to read their interplay, you'll get a much clearer picture of what's really happening with supply and demand.
Think of liquidity as the amount of traffic in a market. An asset with tons of liquidity, like the SPY ETF, has an endless stream of buyers and sellers ready to trade at any given moment. This intense competition means market makers have to fight for your business with very competitive prices, leading to a tight spread—often just a single cent.
Now, flip that around. An illiquid asset, maybe a small-cap stock nobody's heard of or a brand-new crypto token, has far fewer players. With less competition and a harder time matching buyers with sellers, market makers are taking on more risk. To make it worth their while, they create a wide spread.
The Impact of Market Volatility
If liquidity sets the baseline for the spread, then volatility is the accelerant. When prices are stable and predictable, market makers are comfortable and keep spreads tight. But the moment an asset's price starts swinging wildly, uncertainty goes through the roof.
During these highly volatile periods—maybe an earnings report just dropped or some major economic news hits the wires—the risk of holding a position, even for a few seconds, skyrockets. Market makers instantly widen the bid-ask spread to protect themselves from getting caught on the wrong side of a sudden price move. For them, it's a defensive measure. For us as traders, it's a blaring warning sign that the market is getting unstable.
A widening spread is a real-time signal that risk is flooding the market. For a price action trader, this is an incredibly powerful piece of information. It often precedes major price moves, telling you that liquidity is drying up and a sharp move could be just around the corner.
Reading the Spread for Actionable Insights
For anyone who trades based on price action, the bid-ask spread isn't just a cost to be managed; it's a rich source of data. Watching how the spread behaves can tip you off to underlying market dynamics long before they show up on a standard chart. You can learn more about how order flow impacts price in our guide to understanding market liquidity.
Here’s a quick rundown of how different conditions affect the spread:
- High Liquidity, Low Volatility: This is the trader's paradise. Think major currency pairs like EUR/USD during peak hours. Spreads are consistently wafer-thin, which makes getting in and out of trades cheap and easy.
- Low Liquidity, High Volatility: The danger zone. This is common in obscure assets or during full-blown market panics. Spreads can blow out to enormous sizes, making profitable trading almost impossible and dramatically increasing your risk of getting hit with major slippage.
By paying attention to the difference between the ask and bid price, you give yourself a crucial edge. You learn to spot those moments of rising uncertainty or, conversely, confirm the stability of a calm market. This allows you to adapt your strategy to the real conditions on the ground, not just what a lagging indicator might be telling you.
How Your Order Type Interacts with Bid and Ask Prices
So, how does all this theory actually play out when you place a trade? It comes down to the type of order you use. This isn't just a technical detail; it's a strategic choice that determines whether you're chasing speed or a specific price. Get it wrong, and you can immediately eat into your potential profits.
When you hit the button on a market order to buy, you’re basically telling your broker, "Get me into this trade right now, I don't care about the exact price." Your order will immediately get filled at the current best ask price available. If you're selling with a market order, the opposite happens: you sell instantly at the prevailing bid price. You get the speed, but you give up any control over your entry or exit price.
It's the ultimate trade-off.
Market Orders vs. Limit Orders
This is a critical distinction because the bid-ask spread hits market orders directly. In a fast-moving or thin market, the price you actually get filled at can be wildly different from the one you saw on your screen a split second ago.
A limit order, on the other hand, puts you firmly in control of the price.
- A buy limit order is your instruction to buy only at a specific price or lower. Your order sits and waits for the ask price to drop to your level.
- A sell limit order is the reverse. You set a target price, and the order will only execute if the bid price climbs up to meet it.
The catch? There's zero guarantee your order will ever get filled. If the market zips past your price and never looks back, you'll be left on the sidelines, potentially missing out on a great move. We dive much deeper into this choice in our complete guide on market order vs limit order.
Choosing between order types is a cornerstone of disciplined trading. A market order says, "Get me in now," while a limit order says, "Get me in only at this price or better." Your choice should align with your strategy and current market conditions.
Visualizing the Order Book
This is what it looks like in practice. The image below shows a basic order book, which is the battlefield where bids and asks meet.

You can clearly see the buy orders (the bids) stacked on one side and the sell orders (the asks) on the other. That gap in the middle? That's the spread—the very real difference between the ask and bid price.
A market buy order has to "cross the spread" to get filled at the lowest ask. A limit buy order, however, would join the queue on the bid side, waiting patiently for sellers to come down to its price. Understanding this dynamic is absolutely essential for clean, effective trade execution.
Navigating the Hidden Costs of Spreads and Slippage
The bid-ask spread is a direct, upfront cost you can plan for. But it has a dangerous cousin that's far less predictable: slippage. This is what happens when the price you click to trade isn't the price you actually get.
Slippage is that frustrating gap between your expected trade price and the actual execution price. It can silently chip away at your account balance without you even realizing the full impact on each trade.
It’s a common problem when using market orders, especially when volatility spikes or you're trading a thinly traded asset. In those crucial milliseconds it takes for your order to hit the exchange and find a match, the best available price can vanish. That tiny shift, even if it's just a few cents, can completely wreck a trade’s profit potential.
Think about it: a seemingly minor 0.25% slippage on your entry and another 0.25% on your exit adds up to a 0.5% loss right out of the gate. If your original profit target was just 1%, half of your potential gain is gone before the trade even has a chance to play out.
Understanding Slippage Scenarios
The risk of getting a bad fill varies wildly depending on what the market is doing. Learning to spot these high-risk situations is the first step to protecting your capital from these hidden fees.
- High-Impact News: Big economic data releases or company earnings reports can cause spreads to blow out and prices to jump around like crazy. In these moments, slippage is almost guaranteed if you use a market order.
- Low Liquidity: Trading outside of major market hours or in obscure assets means there just aren't enough buyers and sellers to absorb your order. This leads to wider gaps between price levels where your order can get filled, often at a worse price.
- Fast Markets: During a strong, fast-moving trend, prices can move so quickly that by the time your order is processed, the price you saw is ancient history.
To really get a grip on these costs, understanding the impact of latency and accuracy in fund data is key. High-quality, low-latency data ensures the prices you see on your screen are as close to real-time as possible, which helps cut down on nasty surprises.
Slippage is the penalty for demanding immediate execution in an unstable market. Disciplined traders understand this and prioritize price control over instant gratification, especially when conditions are unfavorable.
Mitigating Slippage in Your Trading
The best way to deal with slippage is to get ahead of it. Instead of just accepting the losses, you can implement strategies that give you control over your execution price and stop you from chasing the market. We cover this in-depth in our complete guide on what is slippage in trading.
Using limit orders is the most direct way to fight back. By setting the exact price you're willing to pay (or accept), you completely remove the risk of getting a bad fill.
Sure, it requires patience—the market has to come to your price. But it also forces discipline and shields you from the hidden costs that eat into your profitability over the long run.
Reading Market Depth for Advanced Supply and Demand Insights
If you really want to see what’s going on under the market’s hood, the standard bid and ask prices are just the tip of the iceberg. To get a deeper look into the market’s engine room, you need a tool called the Depth of Market (DOM), often known as the Level 2 order book. This isn’t about a single bid and ask; it shows you the entire stack of buy and sell orders waiting at different price levels.
This is where you can visualize the raw supply and demand that drives every price move. By looking at the bid size (the volume of buy orders) and the ask size (the volume of sell orders), you start to get a feel for the real-time balance of power between bulls and bears.
Identifying Support and Resistance Walls
The DOM gives you an incredible edge for confirming key price levels that you might spot on your chart. When you see a massive cluster of buy orders stacked up at a certain price, traders call this a “bid wall.” This wall acts as a powerful support level because a huge amount of buying pressure has to be chewed through before the price can drop any further.
On the flip side, a giant stack of sell orders creates an “ask wall.” This is a dead giveaway for a strong resistance area where selling pressure is concentrated, making it tough for the price to punch through to the upside.
By learning to interpret the DOM, you shift from just reacting to price action to actually anticipating it. You can literally see where big institutional orders are likely sitting, giving you a layer of confirmation that lagging indicators just can't offer. This insight into market conviction is a game-changer.
The difference between a level that holds and one that breaks often comes down to the volume you can see right there on the order book.
Reading the Tape for Market Conviction
Market depth isn't just about static walls; it's about watching the flow of orders as they happen. Seeing how these bid and ask sizes change in real-time gives you powerful clues about market sentiment.
Take the U.S. options market, for example—the bid-ask spread is a critical battleground. Data often shows that for popular options, 'Bought on Ask' volumes can shoot past 60% of all trades. That’s a crystal-clear sign of aggressive buyers willing to pay the premium and cross the spread to get into a position, a dynamic that can push option prices up by 5-10%. The difference between the ask and bid price can also widen out dramatically ahead of big news like earnings, with spreads sometimes jumping 20-50% as traders price in more risk. Keeping an eye on these dynamics helps you see where the real pressure is building. You can discover more about how bid and ask prices for options work.
This flow gives you essential context. Are buyers aggressively eating through the offers on the ask side, or are sellers methodically absorbing every bid that comes in? This is the kind of information that helps you decide if a breakout is the real deal or just a fakeout about to fail.
Practical Strategies for Managing the Bid-Ask Spread
Knowing the theory behind the bid-ask spread is one thing. Actually managing it in the heat of the moment is what separates consistently profitable traders from those who just spin their wheels. Protecting your capital isn't a passive activity; it starts with a proactive approach to side-stepping these built-in transaction costs.
Your first line of defense, and maybe the most important one, is picking the right broker. Prioritize brokers known for their consistently tight spreads. This single factor can make a massive difference to your bottom line over hundreds or thousands of trades. After that, it's all about being selective—when you trade, what you trade, and how you enter.
Core Tactics for Spread Management
As a general rule, it’s just smart to steer clear of highly illiquid assets unless your strategy is specifically built to handle the wider spreads that come with them. You also need to be extremely cautious during major news events or right at the market open. Spreads often blow out during these volatile periods, and you can get burned if you're not paying attention.
Get into the habit of checking the current spread before you even think about placing a trade. This ensures your risk-to-reward calculations are still valid. One of the most powerful tools you have is the limit order. It gives you precise control over your entry and exit points, helping you avoid the costly trap of slippage.
You can actually see how the market is stacked by looking at market depth. This shows you where the big clusters of buy and sell orders are sitting.
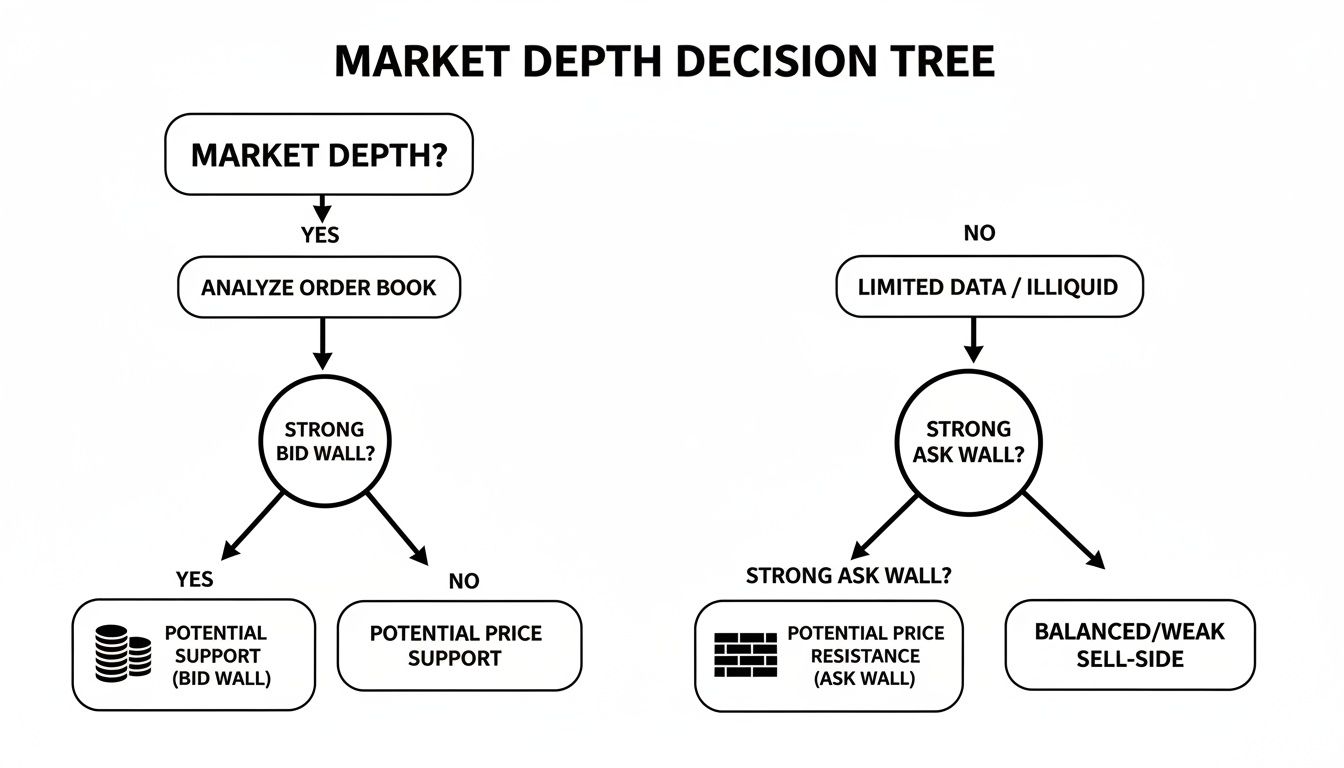
This kind of decision tree illustrates how traders can spot large clusters of bid orders (potential support "walls") or ask orders (potential resistance "walls") and use them as potential turning points.
The goal is not to eliminate the spread—that’s impossible—but to minimize its impact through disciplined execution. By consistently applying these best practices, you can protect your capital and execute your trading plan with much greater precision.
For traders interested in taking this to the next level, a Smart Scalping Pro Guide offers a deep dive into advanced strategies for managing the difference between the ask and bid price, especially for short-term execution. These are the kinds of methods that empower you to keep more of your hard-earned profits.
Answering Your Questions on Bid and Ask Prices
Even after getting the basics down, a lot of traders still have nagging questions about how all this works in the heat of the moment. Let's tackle some of the most common ones I hear to really cement your understanding of this core market concept.
Why Can't I Just Trade at the Price I See on the Chart?
That's a great question and a very common point of confusion for new traders. Most of the price charts you're looking at are simplified to keep them clean and easy to read. They're usually showing you the last traded price or maybe a midpoint between the bid and ask.
What they don't show are the two live, actionable prices you actually trade on. When you hit that "buy" button, your order has to cross the spread to find a seller at the ask price, which is always a bit higher. And when you sell, you're getting the bid price from a buyer, which is always a bit lower. That little gap is just a fundamental part of how markets work.
Can the Bid Price Ever Be Higher Than the Ask Price?
In any normal, functioning market, that's a hard no. The bid is always lower than the ask. If for some reason the bid price jumped above the ask, it would create a guaranteed, risk-free profit—an arbitrage opportunity.
This bizarre situation is called a "crossed market." If it ever happens, high-frequency trading algorithms would spot it and fix it in a literal fraction of a second. Seeing one almost always means you're looking at a glitch in your data feed, not a real trading opportunity.
How Does the Bid-Ask Spread Affect Scalpers and Day Traders?
For anyone trading on short timeframes, the spread isn't just a minor detail; it's everything. Scalpers and day traders live and die by capturing small, quick profits. A wide spread can completely wipe out any potential gain before the trade even gets going.
Think of the spread as a built-in cost for every single trade. It's a hurdle you have to clear just to break even. This is exactly why you'll find successful short-term traders sticking almost exclusively to highly liquid markets where spreads are razor-thin. A wider difference between the ask and bid price would force them to hunt for bigger price moves, completely undermining their entire strategy.
Ready to stop relying on indicators and start trading with confidence? At Colibri Trader, we teach a straightforward, price-action based approach to master the markets. Take our free Trading Potential Quiz today!