


Confluence In Trading Explained A Practical Guide
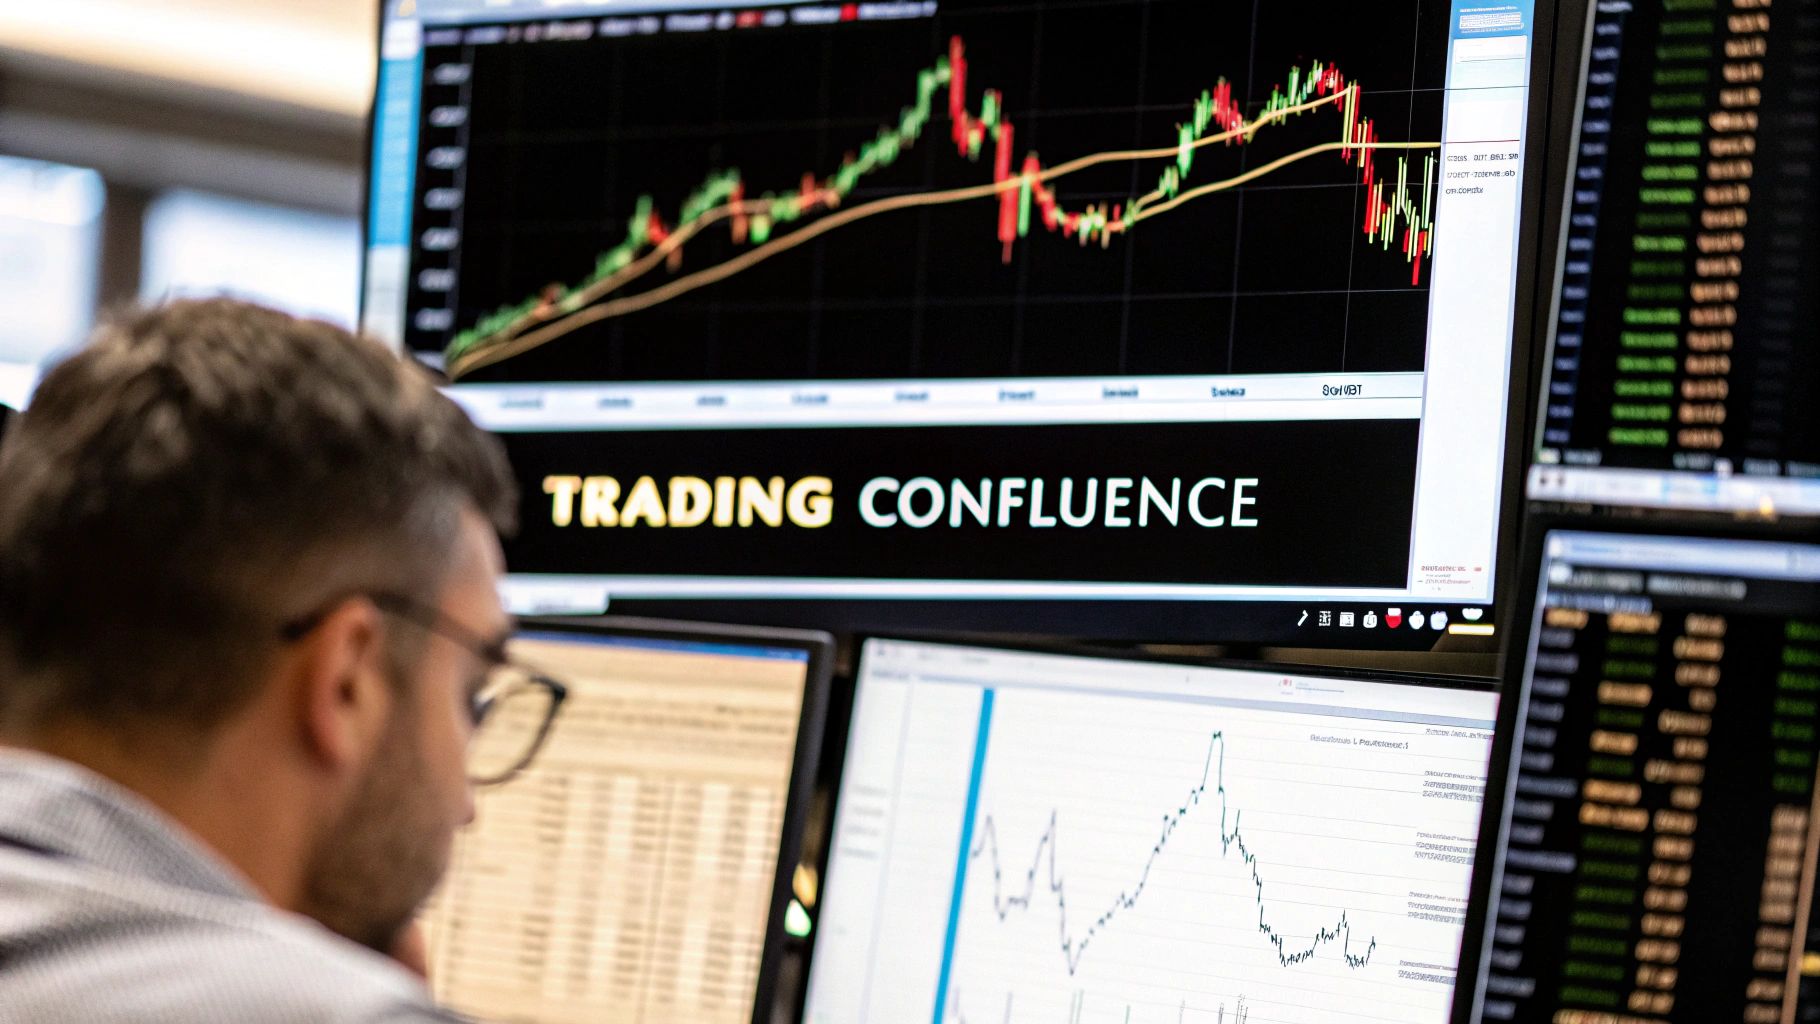
In trading, confluence is all about finding multiple, independent reasons that all point to the same conclusion. When different technical signals converge at the same price area, it gives you a powerful, evidence-based green light to consider a trade.
It’s the shift from pure guesswork to building a strong, logical case for why the market might move in a certain direction.
What Confluence In Trading Really Means

Think of yourself as a detective at a crime scene. A single fingerprint is a decent clue, but it’s hardly enough to be sure.
But what if you find that fingerprint, a reliable witness statement, and security footage all pointing to the same suspect? Your confidence skyrockets. That’s exactly how confluence works in the financial markets.
Confluence trading isn't about some secret indicator or a complicated algorithm. It’s a framework built on a simple idea: the more independent reasons you have to take a trade, the higher your probability of success. It's about layering different forms of analysis to confirm what you see on the chart.
Moving Beyond Single Signals
A lot of traders fall into the trap of relying on just one tool. They might see a moving average crossover or a particular RSI reading and jump in. The problem is, these signals are often unreliable on their own.
This is where confluence gives you a real edge. A single indicator might falter with 40-50% accuracy, but when you start layering signals, backtests over 20 years on assets like gold and oil show probabilities can climb into the 65-80% range. You can dig deeper into this concept on sites like Babypips.com.
Single Indicator vs Confluence Trading At A Glance
Many traders start their journey relying on a single favorite tool, but the most consistently profitable ones learn to stack the odds in their favor. Moving from a single-signal approach to a confluence-based one is a major step up in a trader's development.
The table below breaks down the key differences in mindset and results.
| Aspect | Single Indicator Approach | Confluence Approach |
|---|---|---|
| Trade Signal | Relies on one indicator (e.g., RSI, MACD) | Requires multiple, non-correlated signals to align |
| Reliability | Prone to false signals and "market noise" | Higher probability; filters out weak or random setups |
| Confidence | Often leads to hesitation and second-guessing | Builds strong conviction to act decisively |
| Decision-Making | Reactive and often impulsive | Deliberate, analytical, and evidence-based |
| Risk Management | Stop-loss placement can feel arbitrary | Allows for more logical stop and profit levels |
| Mindset | "Indicator hunting" for a magic bullet | Building a logical case for each trade |
Embracing confluence means you stop looking for shortcuts and start thinking like a professional—building a robust, evidence-backed case before you put any capital at risk.
By demanding multiple confirmations before you enter, you get a few huge benefits:
- You filter out the market noise. It helps you ignore those weak, low-probability setups that might look tempting at first.
- You trade with more confidence. Entering a trade with three or four confirming factors eliminates that nagging hesitation.
- You manage risk better. When you know exactly why you're in a trade, setting logical stop-loss and take-profit levels becomes so much easier.
A confluence-based approach forces you to become a market detective. You stop hunting for magic bullets and start building a logical, evidence-based case for every position you take. This shift in mindset is the foundation of consistent profitability.
Ultimately, confluence trading is about making that critical shift from a reactive mindset to a proactive, analytical one. It’s the structured process of making sure what you think you see on the chart is actually supported by multiple, non-correlated pieces of evidence.
The Core Elements Of A Confluence Strategy
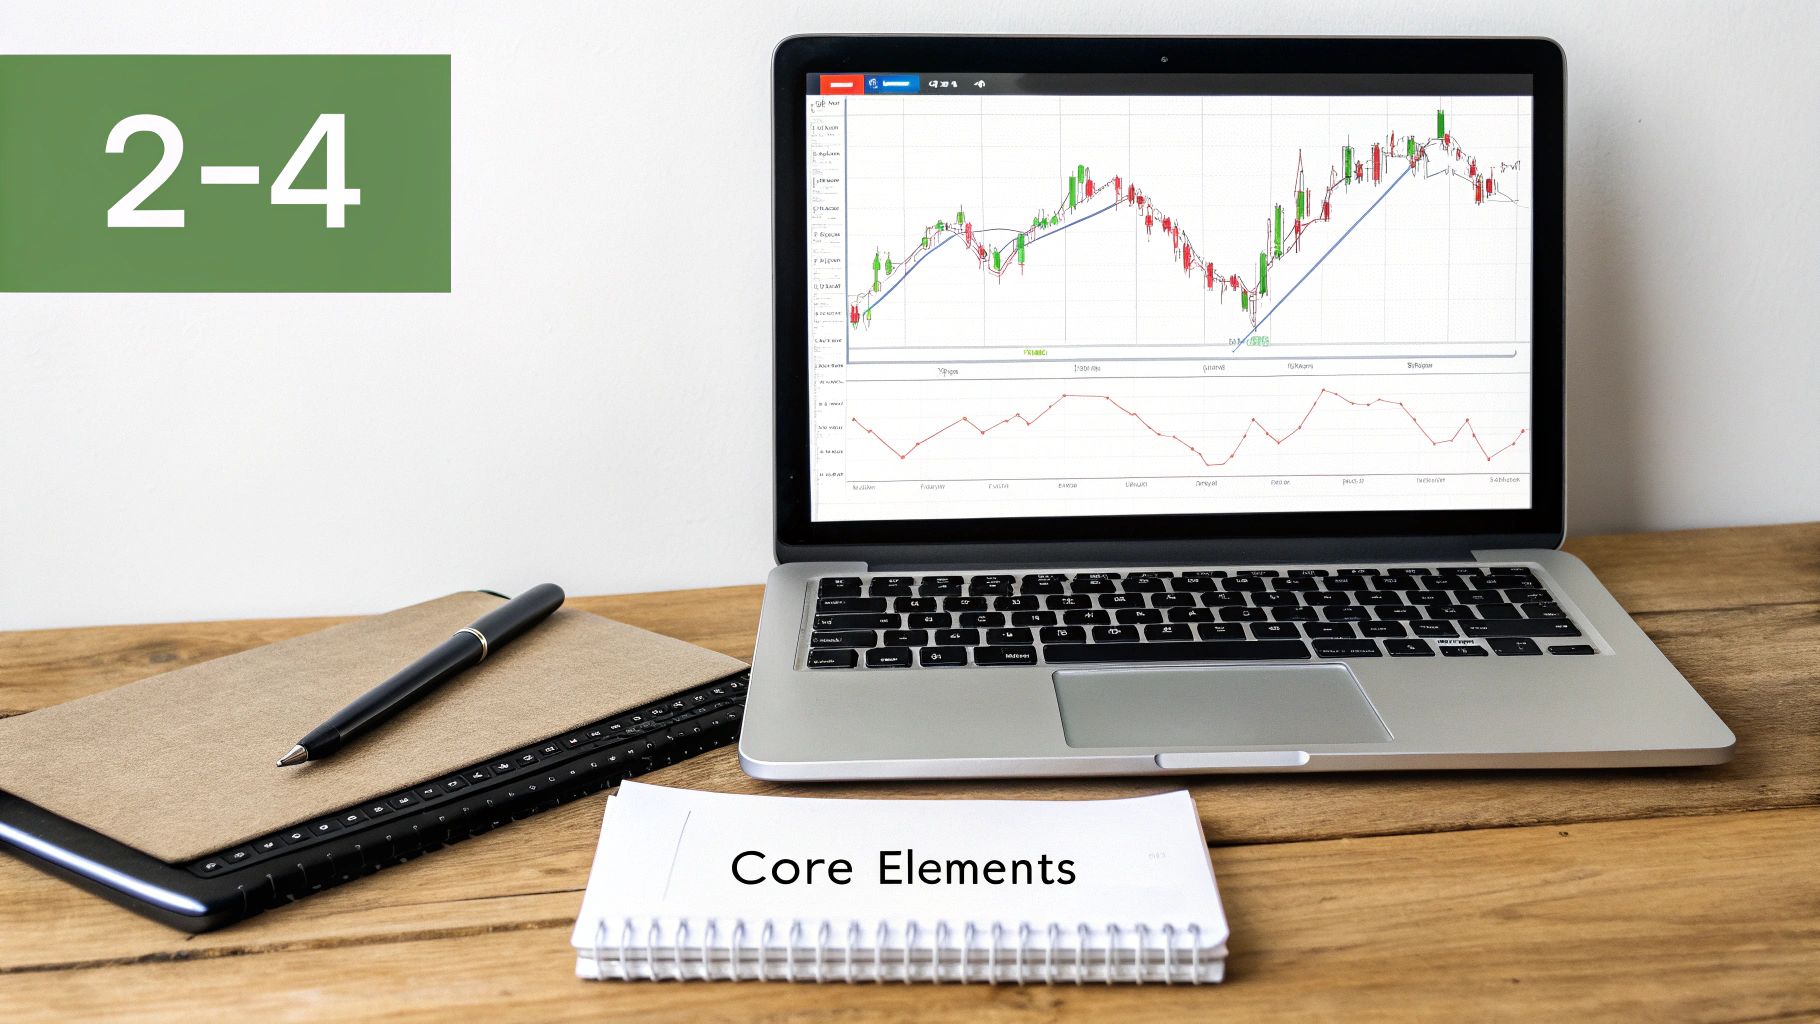
Building conviction for any trade is like assembling an investigation team. Each analytical tool brings its own expertise. Relying on a single indicator is akin to sending only a fingerprint analyst to solve a complex case—you’ll miss vital clues.
In real-world trading, a strong confluence strategy layers several independent signals. You don’t need every tool in your belt; instead, focus on a handful that align to create a high-probability setup. This approach filters out market noise and reinforces your decision-making.
Building Blocks Of Confluence
Think of your toolkit in three broad categories—static, dynamic, and momentum. Each category addresses a unique market question, helping you form a clear view of price action.
- Static Levels: Fixed price areas where buyers or sellers have historically stepped in. Examples include major support and resistance zones.
- Dynamic Levels: Moving guides that adjust as price evolves. Common choices are moving averages and trendlines, which reveal the market’s directional flow.
- Price Structure Tools: Geometry-based levels that mark probable turning points. Fibonacci retracements fall into this group—learn how to draw Fibonacci retracements for a deeper dive.
- Momentum Gauges: Indicators that measure the speed and conviction behind moves. Tools like the Relative Strength Index (RSI) or MACD can highlight overbought or oversold conditions.
| Tool Type | Examples | Market Role |
|---|---|---|
| Static Levels | Support & Resistance Zones | Key Reaction Areas |
| Dynamic Levels | Moving Averages, Trendlines | Trend Direction Guides |
| Price Structure | Fibonacci Retracements | Potential Turning Points |
| Momentum Gauges | RSI, MACD | Strength/Weakness Confirmation |
The real power of confluence kicks in when at least three distinct elements converge. Imagine a trade where price touches a support zone, aligns with the 50-day moving average, and shows an oversold RSI—all pointing to the same entry.
This method shines in the Forex arena, where over $7.5 trillion changes hands daily. Studies indicate that combining a minimum of three diverse tools can lift trade success rates to about 70%, compared to roughly 40% with single-indicator strategies.
By mastering these core elements and layering them thoughtfully, you move from speculative guessing to evidence-driven trades. That discipline sets the foundation for consistent, sustainable market performance.
How To Spot High-Probability Setups In Real Time
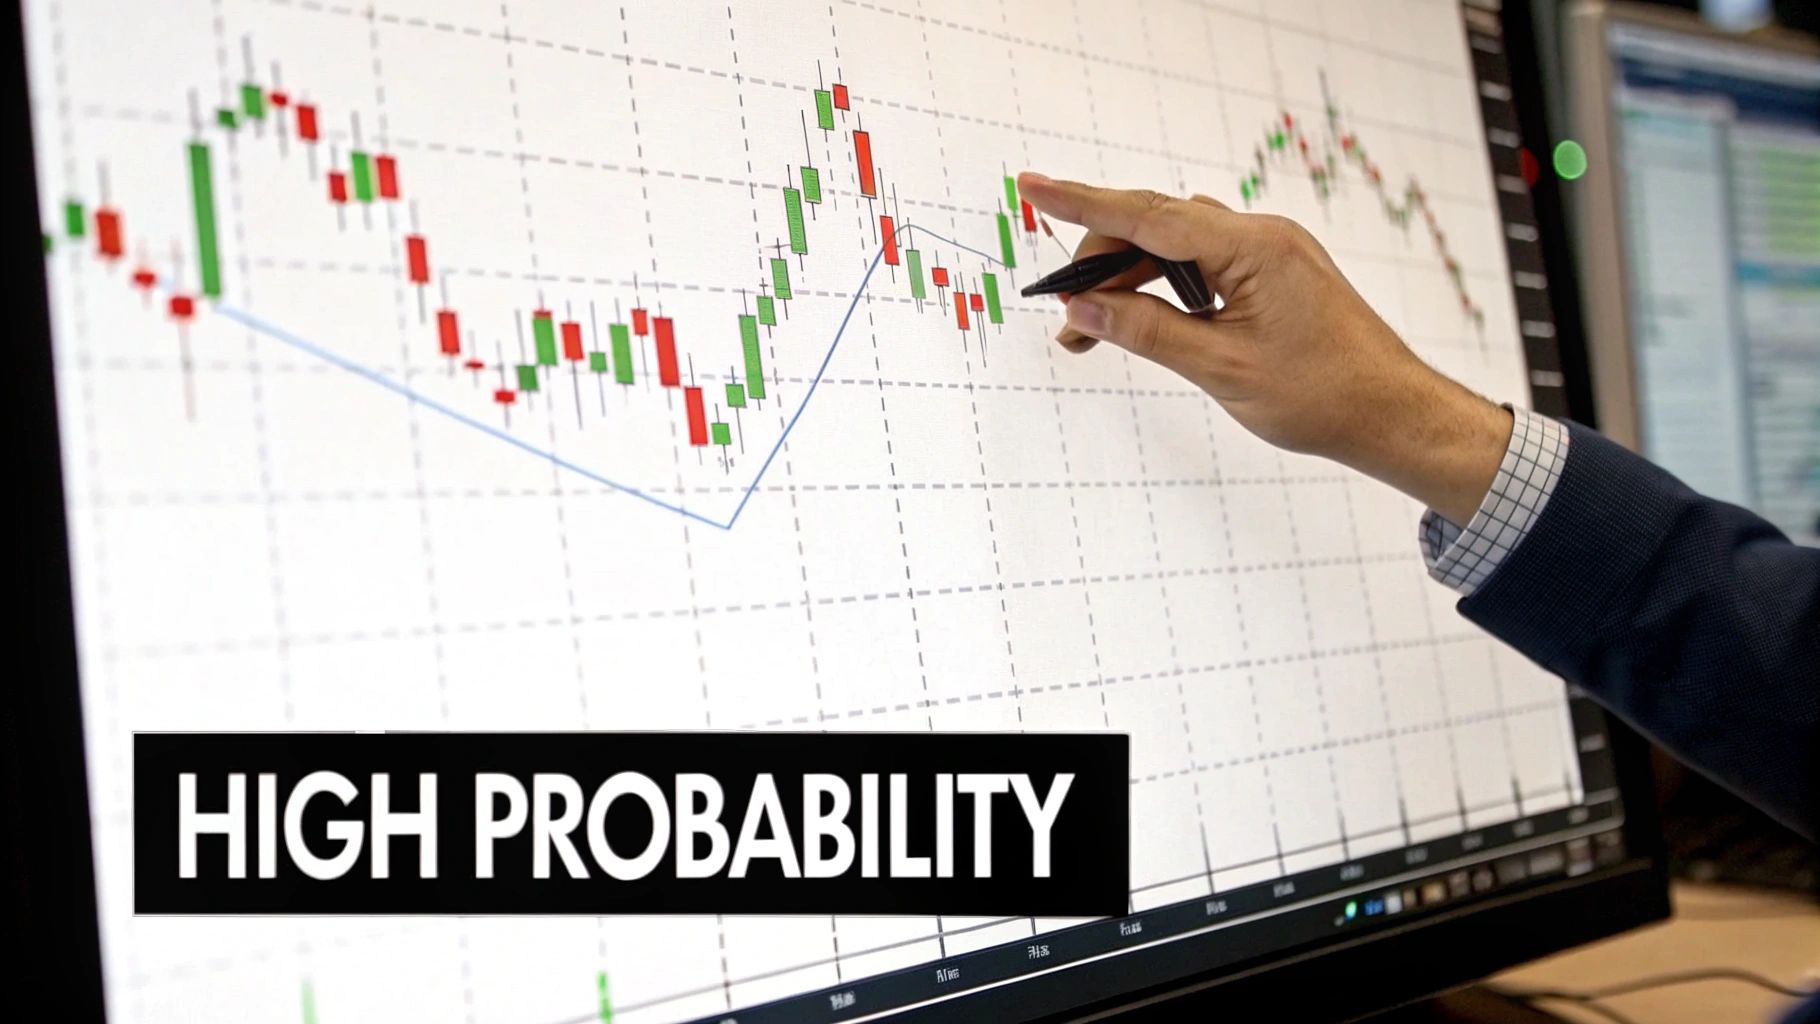
Watching indicators flash on a chart is one thing. Connecting those dots in real time—that’s where real skill is forged.
So let’s bridge the gap between theory and action. In the next two examples you’ll see how combining several non-correlated signals can spotlight truly high-probability opportunities.
We’ll walk through:
- A bullish reversal setup
- A bearish continuation trade
Each case shows why relying on multiple confirmations beats trusting a single indicator.
Example 1: The Bullish Reversal
First, picture a stock that’s been sliding lower and now looks tired. As it drifts down, price approaches a well-tested horizontal support line—your initial red flag.
Next, you overlay a Fibonacci retracement from swing low to swing high. Notice how the 61.8% golden ratio falls right on that same support zone. When two major levels overlap, you’ve identified a high-interest area for buyers.
True confirmation arrives when price action itself speaks. A bullish engulfing candle forms exactly at the confluence, giving you three independent signals all pointing higher.
This mix of static support, a key Fibonacci level, and a clear candlestick pattern defines a classic long entry. Buyers are showing up in force—and you can step in confidently.
Example 2: The Bearish Continuation
Now shift gears to a currency pair in a strong downtrend. It breaks below a significant support level, then pauses and pulls back. Chasing that initial drop can be dangerous. Instead, wait for price to retest the exact broken support—now acting as resistance.
At the same time, the 50-day moving average is sloping down and touching that same resistance zone. Finally, a glance at your RSI shows overbought territory (above 70), hinting the pullback has lost steam.
You now have a three-point setup:
- Static resistance (old support)
- Dynamic resistance (50-day MA)
- Overbought RSI signal
When these elements align, it’s a compelling case to enter a short trade. For additional detail on drawing and trading these key levels, check out this guide on how to identify support and resistance.
Using Multi-Timeframe Analysis To Confirm Your Trades
Beyond just layering indicators on a single chart, one of the most powerful forms of confluence comes from making sure your trade aligns with the bigger picture. This is the secret weapon of professional traders: multi-timeframe analysis. It’s how you make sure you aren't fighting a hidden current you can't see.
Think of it like trying to navigate a river in a small boat. Before you start paddling, you’d want to know which way the main current is flowing, right? Trading is no different. The higher timeframes reveal that main current, the dominant force in the market.
The Top-Down Approach Explained
This technique is often called the “top-down” approach. It’s a simple but incredibly effective process where you start your analysis on a higher timeframe—like the daily or weekly chart—to get your strategic view and establish the dominant market direction.
Once you know the prevailing trend—whether it's bullish, bearish, or just chopping sideways—you then zoom into a lower timeframe to pinpoint your precise entry. This is your tactical execution. This whole approach is about trading in harmony with the market’s underlying momentum, not against it.
For a deeper dive into this professional technique, you can learn more about using multiple timeframes analysis in Forex trading in our detailed guide.
Let's break it down into a couple of simple, actionable steps:
-
Start High (The "Where"): First, pull up a higher timeframe like the daily or weekly chart. Your goal here is simple: identify the primary trend. Is the market carving out higher highs and higher lows (an uptrend), or is it making lower highs and lower lows (a downtrend)? Getting this context is critical.
-
Zoom In (The "When"): Once you’ve established that main trend, drop down to a lower timeframe, like the 4-hour or 1-hour chart. This is where you’ll hunt for your specific trade setup and pinpoint your entry.
Think of it like this: The daily chart tells you which direction to drive on the highway, and the 4-hour chart shows you the best on-ramp. Trying to trade without this perspective is like trying to merge onto that highway blindfolded.
A Practical Example In Action
Let's say the EUR/USD daily chart is showing a clear and strong uptrend. With that one piece of information, your bias is now firmly to the upside. You should only be looking for buying opportunities. Trying to fight this trend would be a low-probability gamble.
Now, you drop down to the 4-hour chart. Instead of just buying randomly, you wait patiently for the price to pull back to a known area of support—maybe a previous resistance level that has now flipped into support. When the price finally touches this level and prints a bullish candlestick pattern, your confluence is complete.
You have now stacked the odds in your favour by aligning:
- The macro trend from the daily chart.
- A key support level on the 4-hour chart.
- A bullish price action signal as your entry trigger.
This kind of confluence across different timeframes dramatically increases your odds of success. It stops you from getting caught on the wrong side of major market moves and builds the discipline to wait for only the highest-quality setups.
Developing Your Personal Confluence Trading Checklist
Knowing the theory is one thing, but building a trading career that lasts comes down to having a structured, repeatable process. To get from spotting confluence to actually executing on it with discipline, you absolutely need a personal checklist.
This isn't about chasing some mythical "perfect" setup with ten different signals all flashing green. It's about consistently finding high-quality opportunities that are backed by three or four strong, independent reasons to take the trade.
Think of your checklist as a pilot's pre-flight inspection before taking off. It forces you to hit pause, take the emotion out of the equation, and objectively confirm that a setup meets your strict entry criteria. This simple tool is your best defense against impulse trades and overtrading.
Building Your Decision Framework
Your checklist should be built around a few critical, non-negotiable questions. Answering them honestly will filter out the mediocre setups, leaving you with only the highest-probability trades on your radar.
Before you even think about entering a position, you must ask yourself:
- Macro Alignment: Does this trade flow with the dominant, big-picture trend on a higher timeframe (like the daily chart)?
- Confluence Count: Can I identify at least three solid, non-correlated signals converging at this price level? (For example, a major support zone, a Fibonacci level, and a bullish candlestick pattern).
- Risk-to-Reward: Does this setup offer a healthy risk-to-reward ratio, ideally 1:2 or better?
This systematic approach is a massive risk mitigator. In the high-stakes world of global trading, demanding multiple confirmations isn't just a suggestion; extensive backtesting shows it can slash false signals by up to 50%. You can dig deeper into these findings on confluence trading.
The flowchart below gives you a visual of this top-down decision process for confirming a trade.
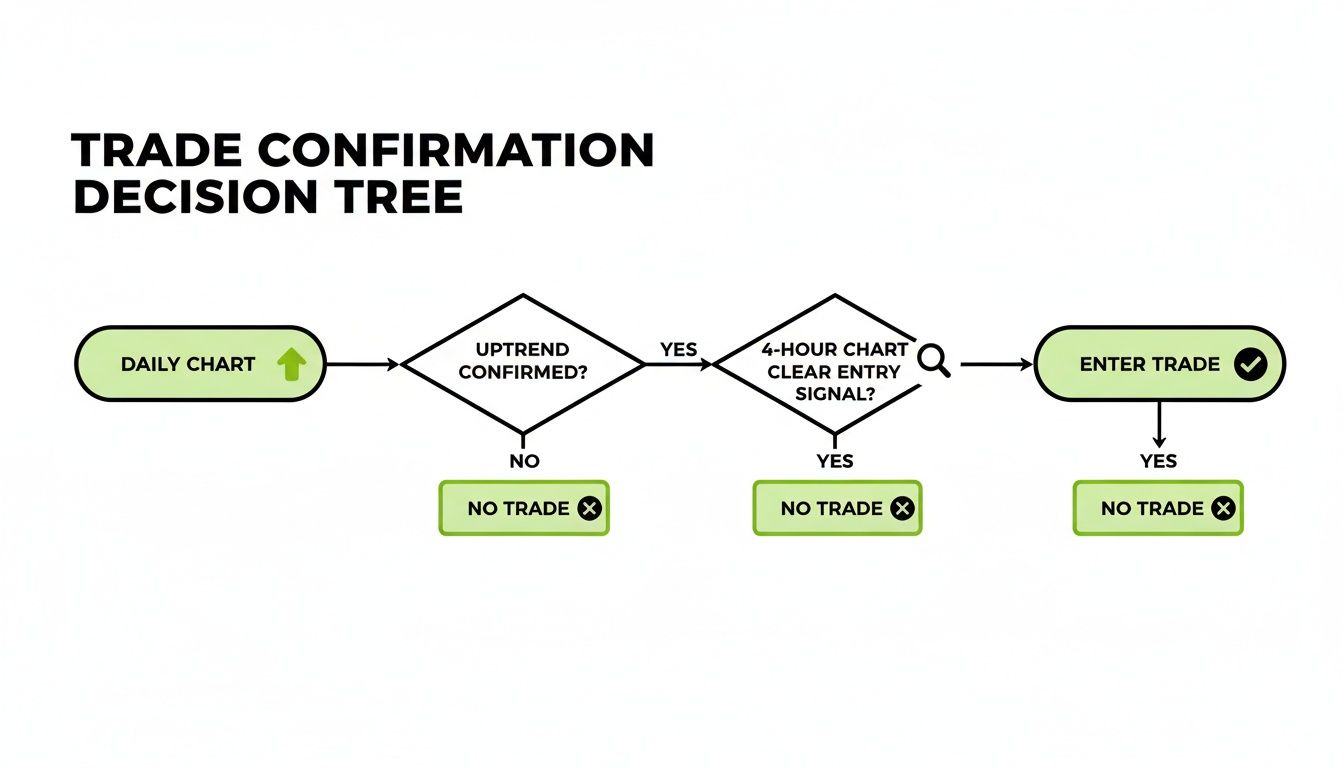
As you can see, starting with the daily chart for overall direction, then drilling down to the 4-hour chart for a precise entry, creates a logical and robust trading framework.
A checklist doesn't guarantee every trade will be a winner—nothing can. What it does guarantee is that you only risk your capital on trades that align with your proven, high-probability strategy. That right there is the cornerstone of long-term consistency.
By committing to this disciplined framework, you start treating your trading less like a gamble and more like a professional, process-driven business.
Common Confluence Trading Mistakes To Avoid
While confluence is a game-changer for spotting high-probability setups, it's not without its traps. If you're not careful, it can lead you down a few rabbit holes that hurt your trading more than they help.
The single biggest mistake I see traders make is getting stuck in analysis paralysis. They're on a quest for the "perfect" trade, waiting for an impossible number of signals to align just right.
The market almost never hands you a flawless setup on a silver platter. If you wait for it, you'll find yourself sitting on the sidelines, watching great opportunities pass you by. As a practical rule of thumb, focus on finding three to four strong, non-correlated signals. That’s your green light.
Mistaking Correlation for Confluence
This one is critical. A lot of traders confuse correlated indicators with true confluence. For example, you might see both the RSI and the Stochastics screaming "oversold." That feels like two solid reasons to buy, right? Wrong.
It’s really just one signal—waning momentum—being shown in two slightly different ways. They’re basically telling you the same story.
True confluence comes from getting confirmation from different "departments" of your analysis. Think of it like this:
- Structure: Is the price sitting at a key support or resistance zone?
- Trend: Is the setup flowing with a major moving average or trendline?
- Momentum: Is an oscillator confirming a potential reversal or continuation?
When you stack too many similar indicators, you aren't building a stronger case for a trade. You're just creating an echo chamber. It can amplify a single, possibly flawed signal and trick you into having way too much confidence in a weak setup.
Forgetting About Risk Management
And finally, the golden rule: never, ever forget that even the most picture-perfect confluence setup can fail. I’ve seen traders get so convinced by their analysis that they throw basic risk management out the window. They pile on the leverage or set a ridiculously wide stop-loss, thinking the trade is a "sure thing."
Let me be clear: there are no sure things in trading. Confirmation bias is a powerful force that can make you see only the signals that fit your narrative, blinding you to any conflicting evidence on the chart. A key part of this is managing cognitive load; when you're overloaded with information, you're far more likely to make a bad decision.
Your risk management rules are your ultimate safety net. Things like setting a hard stop-loss and risking only a small fraction of your capital on any single trade aren't optional.
Confluence improves your odds, but it will never eliminate risk entirely.
Have Questions About Confluence?
Let's tackle a few common questions that pop up when traders first start thinking in terms of confluence. Getting clear on these points can make a world of difference in building a solid, confident strategy.
What’s The Magic Number of Confluence Factors?
There’s no magic number, but from my experience, the sweet spot for a really high-quality trade setup is usually three to four independent factors lining up.
One or two signals? It’s a bit flimsy and can be unreliable. Waiting for five or more? You’ll often find yourself stuck in "analysis paralysis," watching a perfect opportunity sail by without you. The goal here is strong confirmation, not waiting for every star in the universe to align perfectly.
Does This Confluence Thing Work For All Trading Styles?
Absolutely. The principles are universal. It’s all about layering evidence, which works just as well on a 5-minute chart as it does on a weekly one.
- For Day Traders & Scalpers: You might look for confluence on the 5-minute and 15-minute charts. Think about combining a micro support/resistance level, a key moving average, and a specific candlestick pattern all pointing in the same direction.
- For Swing Traders: You’re more likely to be on the 4-hour and daily charts. Here, you could be layering a major trendline, a significant Fibonacci retracement level, and a major weekly support zone to build a case for a trade that might last for several days.
What's The Single Biggest Mistake To Avoid?
This is a big one. The most common trap I see traders fall into is using correlated indicators and fooling themselves into thinking it's true confluence.
For example, using both the RSI and the Stochastics to confirm an "oversold" signal isn't really two separate reasons to enter a trade. They're both momentum oscillators, so you're essentially just looking at the same signal twice.
True, powerful confluence comes from pulling together diverse pieces of evidence. Think about combining a structural element (like a key support level), a trend element (like the 20 EMA), and maybe a momentum signal (like an RSI divergence). That’s a much more robust and reliable setup.
Here at Colibri Trader, we teach a pure price-action approach that’s all about building a logical, evidence-based case for every single trade—exactly what we've been discussing. Our programs are built to give you a clear, repeatable framework for spotting these high-probability setups without relying on a chart full of indicators. Start learning with a proven strategy today.