


Catching a Falling Knife: How to Spot Bottoms and Trade Sharp Declines
You’ve probably heard the old market adage: don't try to catch a falling knife.
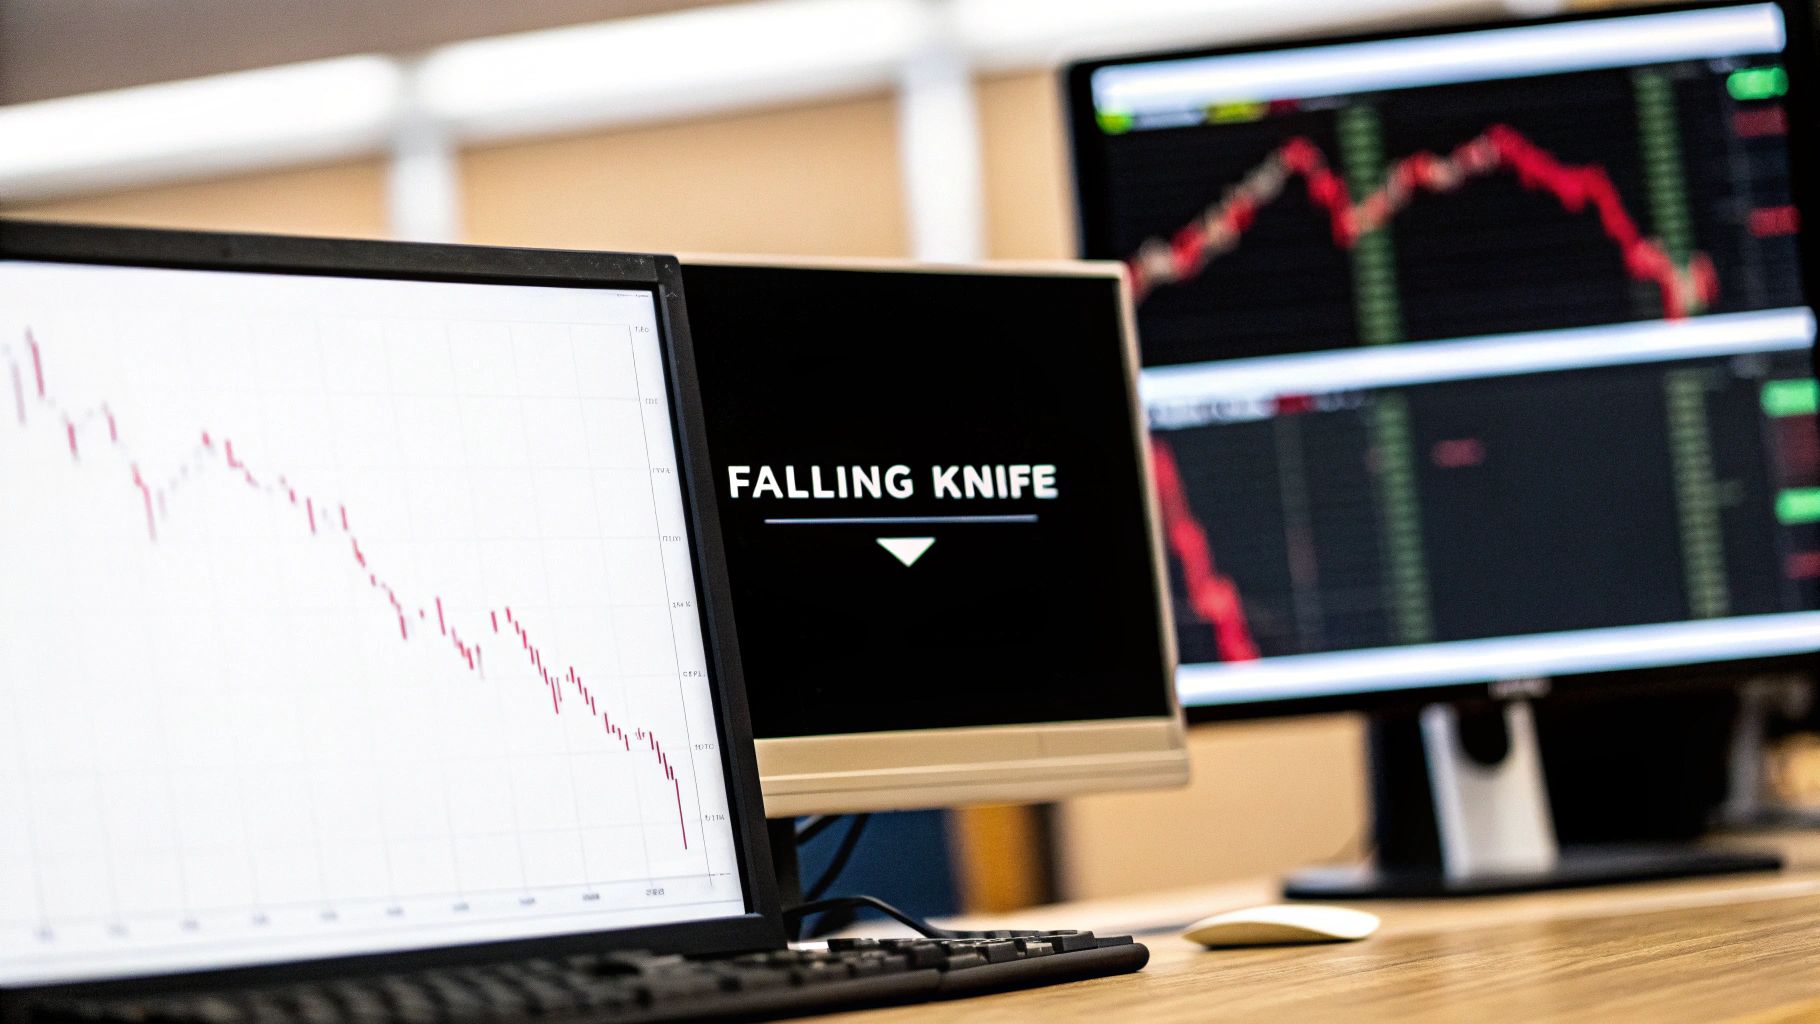
It’s a brutal, vivid warning against buying an asset while its price is in a freefall. This is the ultimate high-stakes gamble where traders bet they’ve perfectly timed the bottom, hoping for a monster rebound.
More often than not, they get sliced up as the price keeps tumbling. It’s one of the riskiest moves you can make and a quick way to blow up an account.
What Does Catching a Falling Knife Actually Mean
Picture someone tossing a kitchen knife in the air and you deciding to grab it on its way down. The odds of a clean catch are slim, and the chance of getting hurt is incredibly high. That’s exactly what’s happening in the markets. You’re jumping into a downtrend fueled by panic, fear, and a tidal wave of selling pressure.
The temptation is real, and it’s wired deep into our trading psychology.
When a stock or crypto suddenly drops 20%, 30%, or even 50%, your brain screams, "Bargain!" This triggers a powerful fear of missing out (FOMO) on what could be a V-shaped recovery where the price snaps back just as fast as it fell. So, traders pile in, hoping to be the hero who nailed the absolute bottom.
The Gambler's Mindset vs Strategic Entry
Here’s the thing: hope is not a trading strategy.
Most attempts to catch a falling knife are pure guesswork. With no plan, you're essentially betting against immense downward momentum with zero evidence the sellers are done. Even the legendary bond investor Bill Gross famously warned against this exact impulse during market chaos, reminding everyone that "'bargains' will be around tomorrow and the next day."
"Investors should not try to ‘catch a falling knife.’" – Bill Gross, Co-founder of PIMCO
This guide isn’t here to encourage you to gamble. Far from it. We’re going to reframe this entire problem from a professional’s point of view. The goal is to shift from emotional, gut-feel decisions to disciplined, evidence-based analysis.
We'll dig into how to use price action—the raw story the chart is telling you—to spot when a downtrend might finally be running out of gas.
This is all about understanding the critical difference between a true falling knife and a normal, healthy market dip. If you want to get a better handle on the latter, check out our guide on what is a pullback in trading. It’ll give you a much clearer perspective.
By the end, you'll have a framework for managing your risk and making calculated entries, even when the market looks its scariest.
Why This Strategy Hurts Most Traders
The dream of catching a stock at its absolute bottom is one of the most powerful temptations in trading. It promises a legendary win, but it completely ignores a brutal market reality: you're trying to stop a freight train with your bare hands.
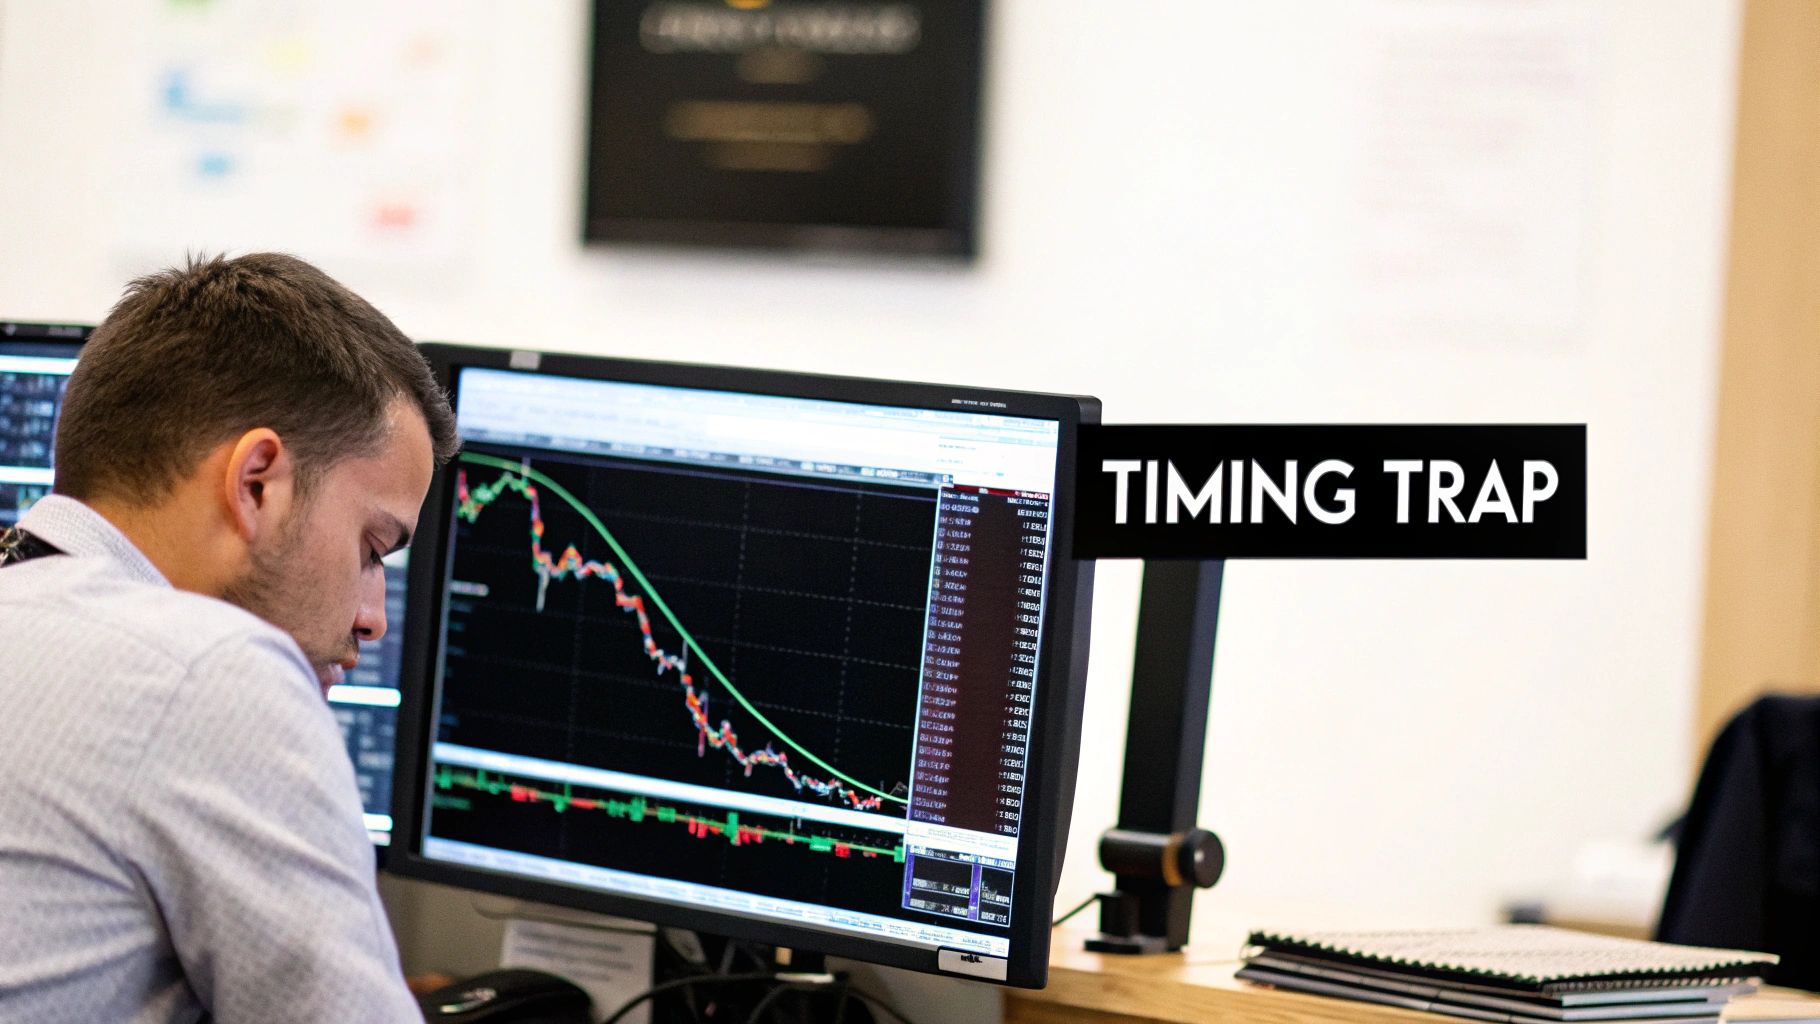
When full-blown panic selling takes over, logic and reason get thrown out the window. The market isn't trading on fundamentals anymore; it's being driven by pure, unadulterated fear. This collective panic can shove a stock's price down to levels that seem completely insane—and then push it even lower. Trying to guess the exact moment that fear will evaporate isn't a strategy. It's gambling.
Bottoms are rarely the clean, "V-shaped" bounces you see in textbooks. They're usually messy, drawn-out affairs full of false hope. You'll see several sucker rallies designed to pull in eager buyers just before the next gut-wrenching drop.
The Illusion of a 'Cheap' Price
One of the biggest traps for new traders is seeing a stock that's down 30% or 50% and thinking it's a "bargain." But here's the hard truth: a cheap stock can always get cheaper. A catastrophic drop can easily become more catastrophic.
In the heat of a panic, metrics like P/E ratios are worthless. Your spreadsheet telling you a company is undervalued is no match for a market that is terrified and selling everything that isn't nailed down.
“When markets tumble and fear grips the financial world, the instinct to 'buy the dip' grows strong. After all, the lower the price, the better the bargain—right? Not quite.”
History is littered with examples of just how ugly these declines can get. The S&P 500 data shows that while the market goes up over the long term, major crashes are absolutely devastating. As this deep dive into stock market decline history shows, there have only been four declines of 50% or more since 1871. The worst, of course, was the Great Depression's nearly 90% wipeout. That's the kind of risk you're playing with.
Trading Hope Instead of Evidence
When you strip it all down, the real problem is psychological. If you don't have a rock-solid, evidence-based plan, you're just trading on hope.
You hope the selling is finished. You hope you nailed the bottom. You hope the price is about to launch into a monster rally. This kind of emotional decision-making is exactly what separates losing traders from the pros.
To survive these environments, you have to get your head straight first. Our guide on mastering trading psychology is essential reading on this. At the end of the day, you have to wait for cold, hard proof that the sellers are out of ammo and the buyers are finally, truly back in charge. We'll dig into what that looks like next.
A Price Action Framework for Spotting Potential Bottoms
Let’s move from theory to action. This means ditching the hopeful guesswork and adopting a systematic framework for reading the charts. The question isn't, "Is this the bottom?" The right question is, "What is the price action telling me?"
An evidence-based approach is the only way to look at a plummeting chart without getting your account shredded by momentum.
While “catching a falling knife” is pure gambling, a more disciplined trader knows there's a huge difference between that and strategically buying the dip. This isn't about nailing the absolute low—that's a fool's errand. It’s about patiently waiting for clear, undeniable signals that the sellers are exhausted and buyers are finally, cautiously, stepping in.
This little decision tree pretty much sums up what happens when you try to time a falling market without a real plan.
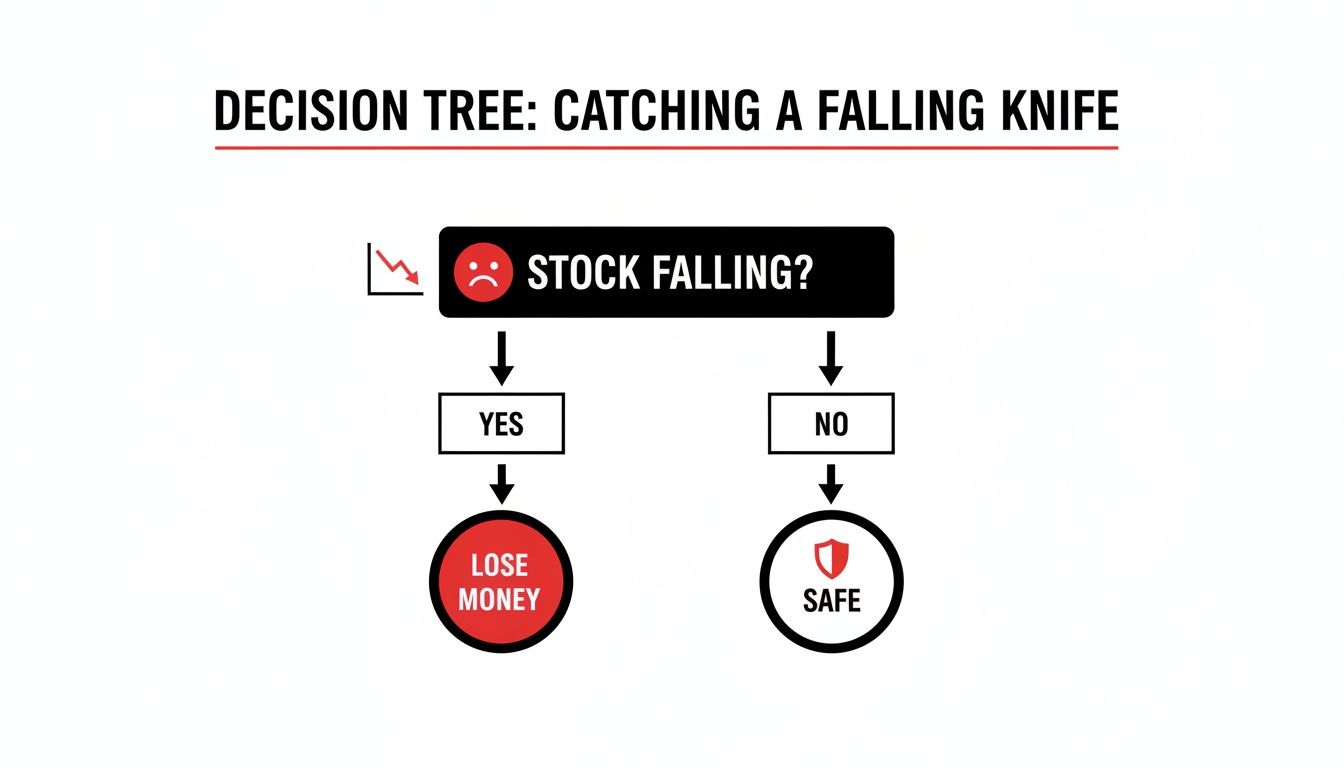
As you can see, jumping in impulsively while a stock is in freefall is a fast track to financial pain. Let’s build a better way.
Step 1: Look for Signs of Selling Exhaustion
Your first job is to hunt for clues that the relentless selling pressure is finally running out of gas. This doesn't mean the downtrend is over. Not by a long shot. But it's the first hint that a change might be on the horizon.
You can see this exhaustion playing out right on your charts through a few key candlestick patterns:
- Shrinking Bearish Candles: After a series of big, nasty red candles, you start to see them get smaller and smaller. This tells you the sellers' conviction is fading.
- Long Lower Wicks (Hammers): These are candles with tiny bodies and long wicks sticking out the bottom. It means sellers tried to push the price down, but buyers jumped in and shoved it right back up before the close. It’s a classic tug-of-war, and the buyers are starting to pull.
- Doji Candlesticks: A Doji has almost no body at all, showing the open and close were practically the same. It’s pure indecision—a critical pause in the downtrend that you need to pay attention to.
Step 2: Wait for Price to Build a Credible Floor
One bullish candle is just noise. It's not enough. You need to see the price establish a credible support level—a price floor. This is a zone where the price has stopped falling multiple times, proving that real demand is showing up at that level.
A bottom is not a single price point; it's a process. You must wait for the market to prove that a specific level can hold against repeated selling attacks before you can even consider it a potential floor.
This process often looks like the price hammering on a support zone two, or even three, times. If it holds strong each time, your confidence in that floor should grow. This is where you can start to see the bigger game of accumulation and distribution as the smart money might be quietly building their positions.
Step 3: Get Confirmation of a Change in Market Structure
This is it. The final, most important piece of the puzzle. A downtrend is just a series of lower lows and lower highs. For a real reversal to be in play, that structure must be broken.
Confirmation arrives when the price first forms a higher low (it fails to break the previous bottom) and then rallies to create a higher high (breaking above the most recent peak in the downtrend). This is the clearest signal you'll get that the market's entire character has shifted from bearish to potentially bullish.
Waiting for this structural shift takes serious patience. I know. But it massively tilts the odds in your favor. It’s the difference between trying to catch a falling knife and buying into the very first signs of a new, confirmed uptrend.
To make this crystal clear, you need to separate emotional guesswork from hard evidence on the chart. Many traders get tricked by their own assumptions during a sell-off.
Confirmation Signals vs Dangerous Assumptions
Here’s a simple breakdown of what to wait for versus what to ignore.
| Dangerous Assumption (Guesswork) | Price Action Signal (Evidence-Based) |
|---|---|
| "The price has fallen so much, it has to bounce soon." | Multiple tests of a support level that hold firm. |
| "I see one bullish candle, the bottom must be in!" | A clear pattern of shrinking bearish candles followed by bullish ones. |
| "This news is good, so the selling should stop." | Price breaks a key downtrend line and a recent high. |
| "I'll just buy a little here… it can't go much lower." | A confirmed higher low followed by a confirmed higher high. |
By focusing only on the evidence-based signals in the right column, you force yourself to trade what you see, not what you hope for. It’s a simple discipline that separates consistently profitable traders from the rest.
Essential Risk Management for High-Risk Entries
Let's get one thing straight. Even if you've waited patiently for some confirmation, trying to trade a potential bottom is still playing with fire. It's one of the most dangerous setups out there, period. The downward spiral can kick back in at any moment, and without warning.
This is where your survival has nothing to do with your entry signal and everything to do with iron-clad risk management.
Forget these rules, and you're not trading—you're just gambling. And the edge is razor-thin. These are the non-negotiables that separate the pros from the amateurs who get wiped out trying to be heroes.
Never Go All In
This is the classic rookie mistake. You see a "bargain" price, your greed kicks into overdrive, and you throw way too much capital at a single, high-risk idea. You get overconfident.
That's how accounts get blown up.
Your position size has to be a cold, hard calculation you make before you even dream of hitting the buy button. The goal isn't to get rich on one trade; it's to make sure a single loss is just a paper cut, not a mortal wound to your account.
A professional trader thinks first about how much they can lose; an amateur thinks only about how much they can win. This mindset shift is the foundation of long-term survival in the markets.
Scale Into Your Position
Pros almost never commit their full size on the first entry. They're smarter than that. They use a technique called scaling in, which just means you break your total position into smaller chunks and get into the market in stages.
It might look something like this:
- Start with a small "feeler" position. This is your first toe in the water when you see the initial signs of a bottom.
- Add a second piece after the price proves itself by making a higher low. This shows you the initial support is actually holding.
- Commit your final piece only when the market structure officially breaks its downtrend by making a clear higher high.
This methodical approach keeps you from getting fully exposed if your initial timing is a bit off. It forces you to let the market prove you right before you put serious capital on the line. You're turning a single high-stakes bet into a strategic, evidence-based process.
Set a Hard Stop-Loss Before You Enter
This is the most critical rule of them all. A stop-loss is your eject button—a pre-set order that gets you out of the trade automatically at a specific price. It defines your maximum pain.
You must know exactly where that stop-loss is going before you even enter the trade.
So, where do you put it? The logical spot is just below the most recent low—the price floor you're betting on. If the price breaks below that floor, your entire reason for being in the trade is gone. It's invalidated. You get out. No exceptions, no second-guessing, no hoping it will turn around.
Your stop-loss is your ultimate safety net. It rips the emotion out of taking a loss and ensures one bad call doesn't turn into a catastrophic disaster for your account.
Beyond the trade itself, international traders have other risks to consider. Navigating the US market means dealing with administrative and compliance rules. A crucial first step for those outside the US is learning how to properly invest in US stocks as a non-resident. Protecting your capital always starts with a solid foundation.
Learning from Real Market Examples
Theory is one thing, but seeing it play out on a real chart? That’s where the lessons really hit home.
When you start digging through historical charts, you’ll see the stark, brutal difference between a stock that’s just a falling knife—a one-way ticket to zero—and one that’s carving out a volatile, but ultimately profitable, bottom.
Some stocks just enter a death spiral. They’re done. These are the charts that serve as grim warnings. Every tiny bounce is just a brief moment of hope before another wave of selling crashes down, fueled by trapped buyers desperate to get out. The selling is relentless, any bullish response is pathetic, and price smashes through every historical support level without a second thought. For the trader who jumps in, it's financial suicide.
But then you have the other side of the coin: the spectacular V-shaped or rounded bottoms. These are the plays that can make a trader’s year, but they are exceptionally rare and demand an iron will to trade correctly. These are the charts where you can spot the exact price action signals we've been talking about—the seller exhaustion, a solid price floor being built, and that all-important shift in market structure.
The Successful Catch Versus the True Knife
Let's make this crystal clear with a couple of quick scenarios.
- The True Falling Knife (Company A): The stock craters 50% on some terrible news. "Buy the dip!" screams the crowd. But the selling never really stops. Every little rally gets hammered down with even more force. Price just keeps slicing through old lows like they aren't even there. A year later, the stock is down 90%. Those early dip-buyers? Obliterated.
- The Successful Bottom (Company B): This one also tanks 50%. Ouch. But then, something changes. After the initial panic, the big red candles start shrinking. A clear support level forms, and price tests it, holds, tests it again, and holds. Then, you see it—the first higher low. It’s followed by a monster bullish engulfing candle that finally creates a higher high. That was the signal.
A Smarter Alternative for Most Traders
Look, for the vast majority of traders, trying to nail the absolute bottom is a stressful, low-odds gamble. There’s a much smarter, more reliable way to play this.
Wait for the new uptrend to be confirmed, then buy the first pullback.
It's that simple.
Sure, you give up the bragging rights of calling the exact low. Who cares? In exchange, you get a much higher probability of success. You let the aggressive, risk-loving traders do the dangerous work of trying to stop a freight train. Once they've managed to turn the trend around (proven by a confirmed higher high), you can calmly wait for the price to pull back to a new support level and jump aboard with the momentum now at your back.
This approach gives you a massively better risk-reward setup and spares you the emotional agony of fighting a powerful downtrend. History backs this up. While catching falling knives is a fool's errand, strategically buying into major market corrections often pays off handsomely for the patient. Since 2008, the S&P 500 has dipped into correction territory 15 times. In all but two of those instances, the market was higher a year later. You can find more great insights on buying stocks in a downturn on nasdaq.com.
Your Top Questions About Trading Sharp Declines
Even with a plan, I know the idea of buying into a freefall can bring up some serious questions. This is a high-stakes game, and you need absolute clarity. Let's walk through some of the most common things traders ask when staring down a potential market bottom.
Getting these answers straight will help you trade with discipline, not emotion. It’s about shifting from gut reactions to cold, hard analysis.
How Is a Falling Knife Different from a Normal Market Correction?
A market correction is business as usual. It's an expected, often healthy, pullback inside a bigger, established uptrend. Think of it as the market catching its breath before the next leg up—a classic buying opportunity for anyone following the trend.
A falling knife, on the other hand, is sheer chaos. It's a violent, rapid price collapse fueled by pure panic and fear, often with no visible floor. Buying a dip in an uptrend is a sound strategy. Trying to catch a falling knife means you're attempting to nail the absolute bottom of a crash with zero proof it's over. The risk isn't just bigger; it's on a completely different planet.
Should I Use Fundamentals Like P/E Ratios to Decide When to Buy?
For long-term investing? Absolutely. But for timing a trade during a panic-driven sell-off? They're basically useless. In the heat of the moment, the market couldn't care less about fundamentals.
Raw emotion and brutal downward momentum will crush logic every single time. A stock can always get cheaper, no matter how "undervalued" it looks on paper. Your best bet is to listen to the chart. Price action tells you the real story of supply and demand in real-time, making it a far more reliable guide for spotting a potential turn.
What Is the Single Most Important Rule for This Strategy?
If you remember only one thing, make it this: wait for confirmation. Never, ever buy something just because it looks cheap or because it has dropped a certain percentage. That's just gambling.
You must wait for the price action itself to give you hard evidence that the sellers are finally out of gas and the buyers are stepping back in with some real muscle.
What does that evidence look like? It's the exact signals we've been talking about:
- Bullish reversal patterns, like a sharp hammer or an engulfing candle.
- A clear support level that gets tested repeatedly but refuses to break.
- A definitive shift in the downward market structure (meaning, it finally makes a higher high).
Patience and evidence are your only friends when you're standing in front of a falling knife.
Can Indicators Like RSI Help Find the Bottom?
Lots of traders try to use indicators like the Relative Strength Index (RSI) to find "oversold" bottoms. Be careful—this is a classic trap. In a powerful, grinding downtrend, an asset can stay "oversold" for a painfully long time while the price just keeps bleeding out.
This is why a pure price action approach works better. By focusing on candlestick patterns, support zones, and market structure, you're reading the market's story directly from the source. You cut out the lag and the misleading noise that indicators often generate when things get really crazy.
Ready to stop gambling and start trading with a proven, evidence-based strategy? At Colibri Trader, we teach you how to read price action so you can trade any market, bull or bear, without relying on lagging indicators or guesswork. Take our free Trading Potential Quiz to get started.