


Candlestick Patterns for Intraday Trading Explained
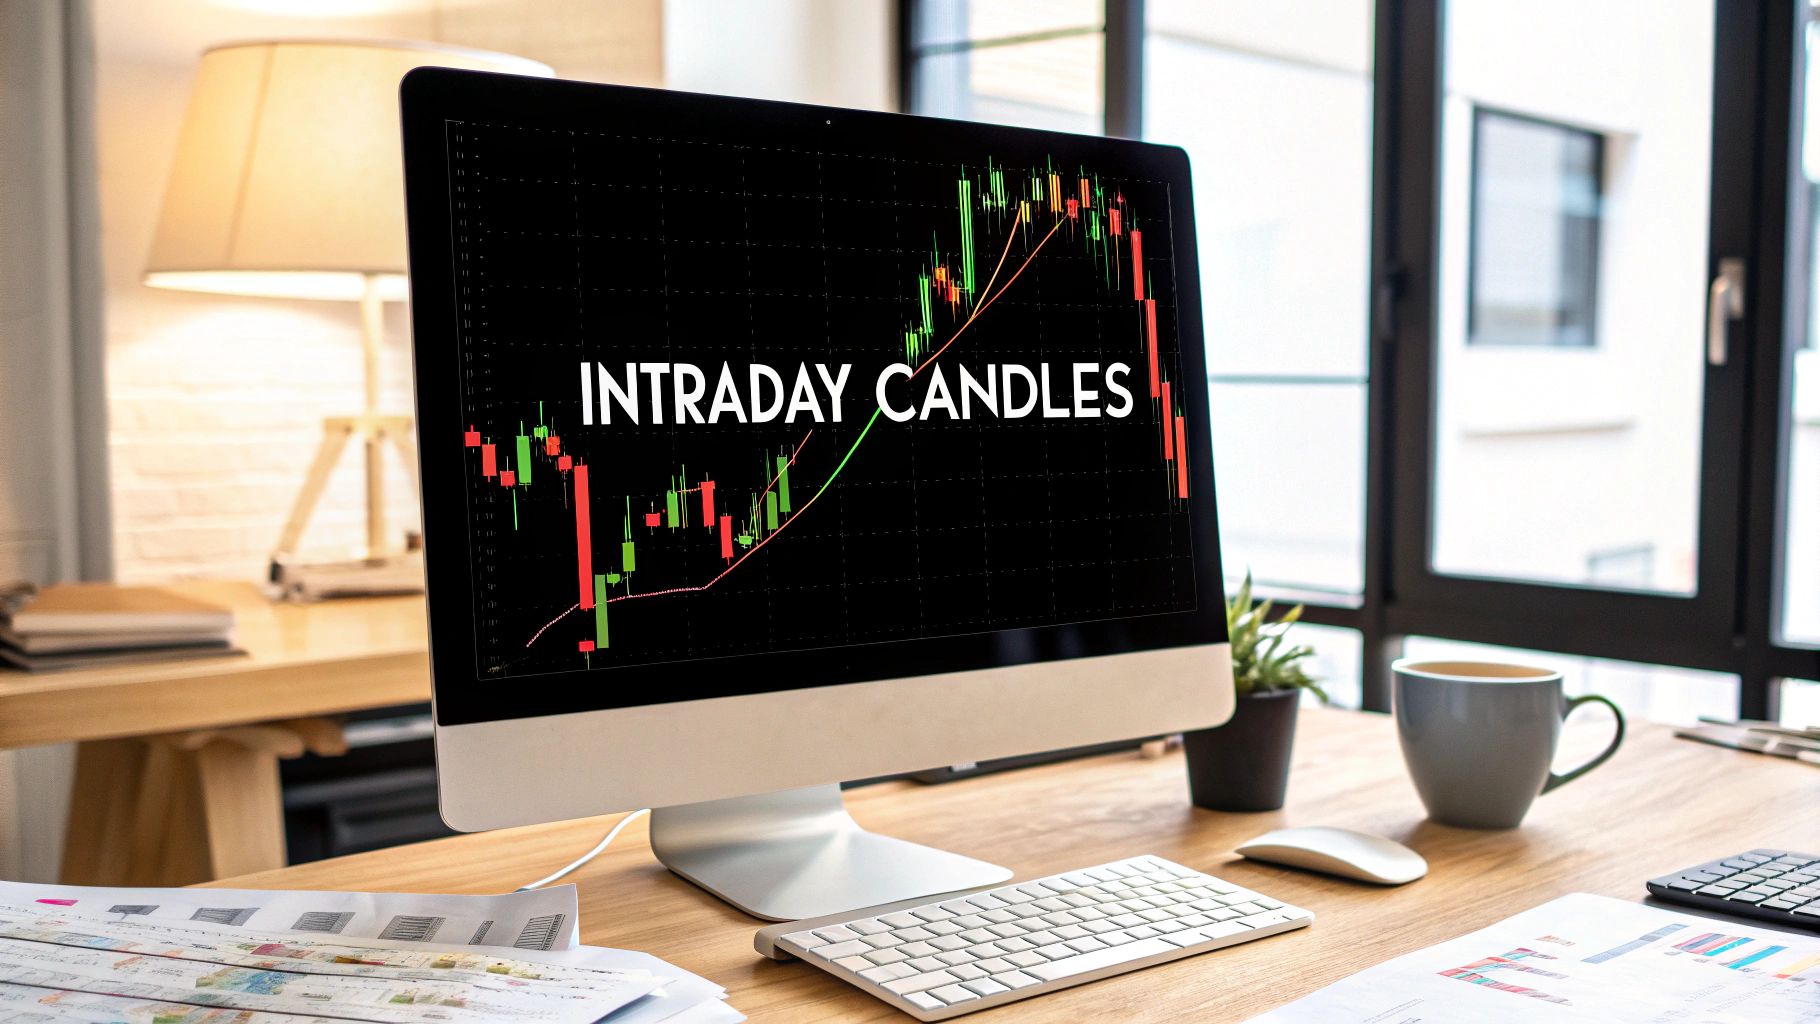
Candlestick patterns are the day trader's secret language. They're visual shortcuts that tell you the story of the constant tug-of-war between buyers and sellers, giving you clues about where the price might be headed next. If you're trading on short timeframes, learning to spot key patterns like the Hammer, Doji, and Engulfing patterns isn't just a nice-to-have skill—it's essential.
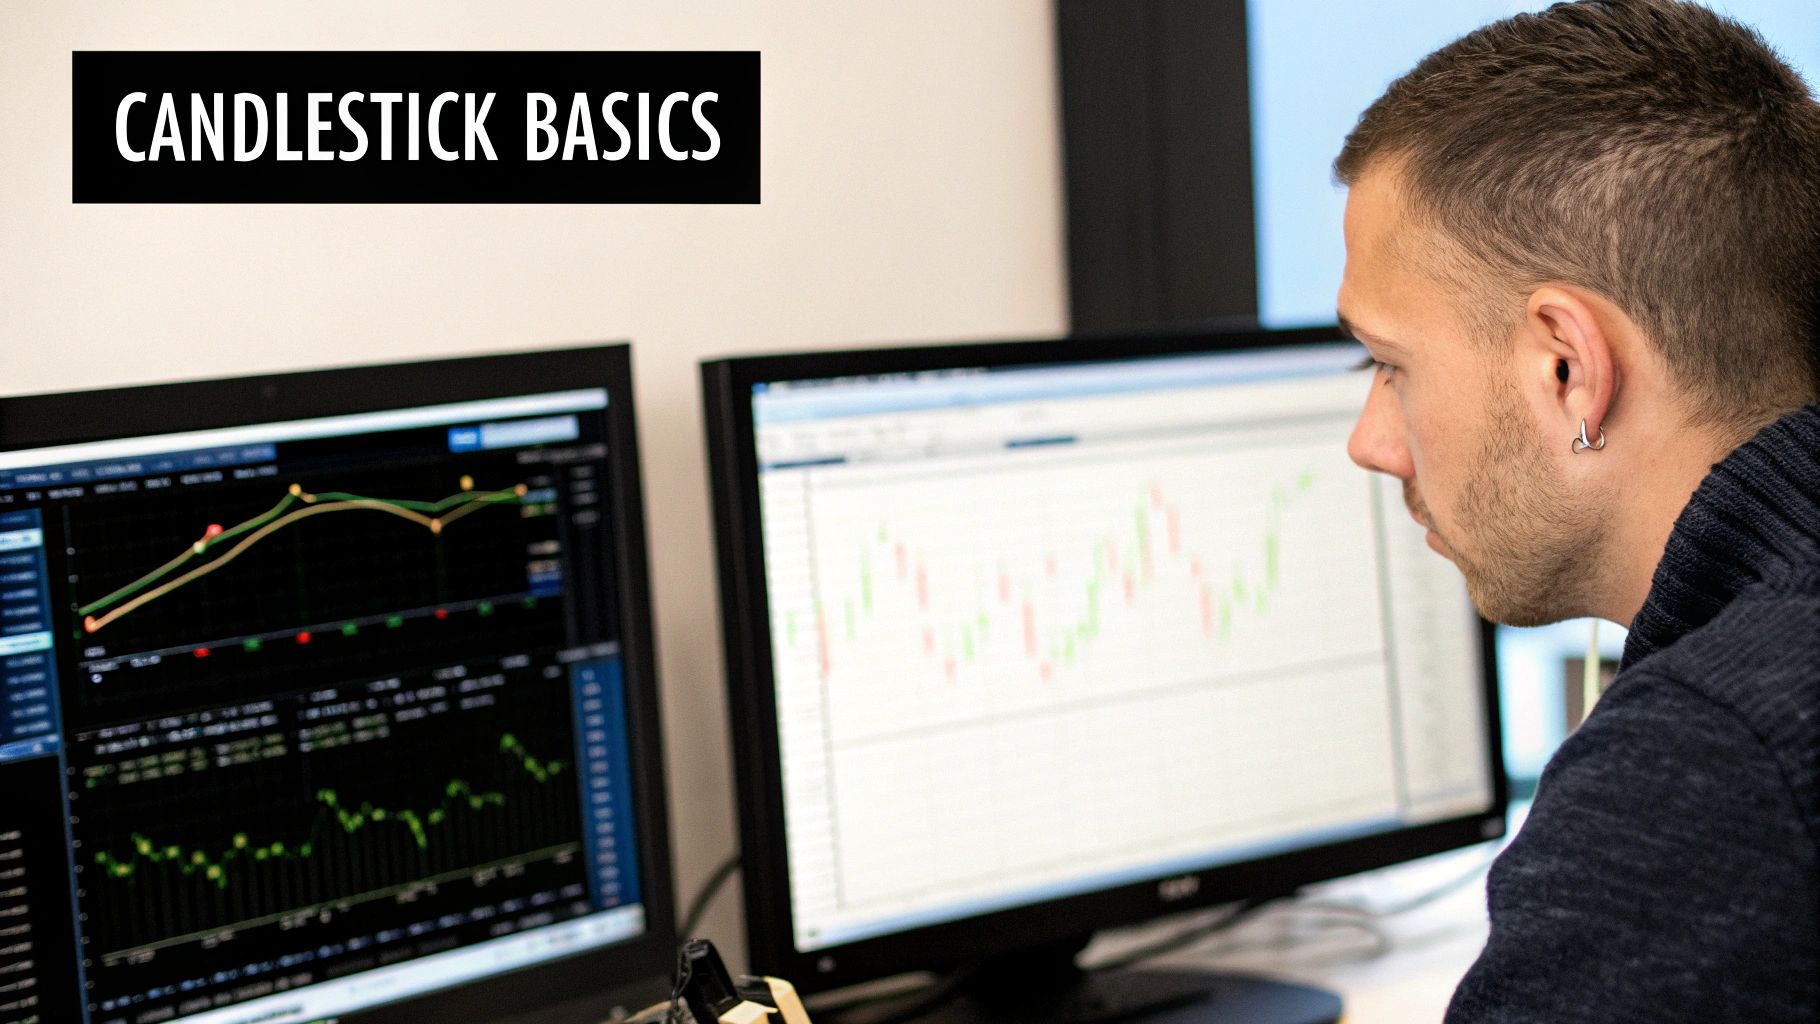
How to Read Intraday Price Action Like a Pro
When you're staring at a chart that's flickering up and down, it can feel like trying to decipher a foreign language at lightning speed. Each one of those candles represents a tiny battle, a clash between buying and selling pressure. For an intraday trader, reading that language in real-time is the entire game.
The trick isn't to memorize dozens of fancy-sounding patterns. The real goal is to understand what the shapes of the candles are telling you about the market's mood.
Think of every single candlestick as a quick summary of what happened during a specific period, whether that's one minute, five minutes, or fifteen. It’s a story with four crucial plot points:
- The Open: Where the price was when the period started.
- The High: The absolute peak price reached during that time.
- The Low: The absolute bottom price hit during that time.
- The Close: Where the price ended up when the clock ran out.
These four points come together to form the candle's two main parts: the body (the fat part showing the distance between the open and close) and the wicks, or shadows (the thin lines showing the session's high and low).
A green (or white) body means the buyers won that round, pushing the close price above the open. A red (or black) body means the sellers were in control, pushing the close below the open. Simple as that.
Decoding the Story in Seconds
The real magic happens when you start interpreting the relationship between the body and the wicks. It’s where the context comes from.
Long wicks, for example, scream volatility and indecision. They show that the price traveled a long way, but neither the buyers nor the sellers could hold that ground.
Imagine you see a candle with a tiny body but a very long lower wick. That's a story in itself. It tells you that sellers tried their best to tank the price, but a wave of buyers jumped in, rejected those lower prices, and pushed the price all the way back up before the candle closed. That single visual clue is a powerful, immediate signal that you'd never get from a simple line chart.
To really get the hang of this, our complete guide on how to read candlestick charts is a great place to start.
Spotting Bullish Setups for Quick Entries
When a stock has been selling off, intraday traders are always on the hunt for that first clue of a turnaround—a sign that the buyers are finally stepping back into the ring. Learning to spot bullish candlestick patterns is like seeing the tide turn in real-time. It gives you a chance to catch a potential move higher right from the start.
These patterns aren't just random shapes on your screen. They're a visual story of sellers getting exhausted and market psychology shifting. When one of these pops up on a 5-minute or 15-minute chart after a clear downtrend, it’s time to pay very close attention.
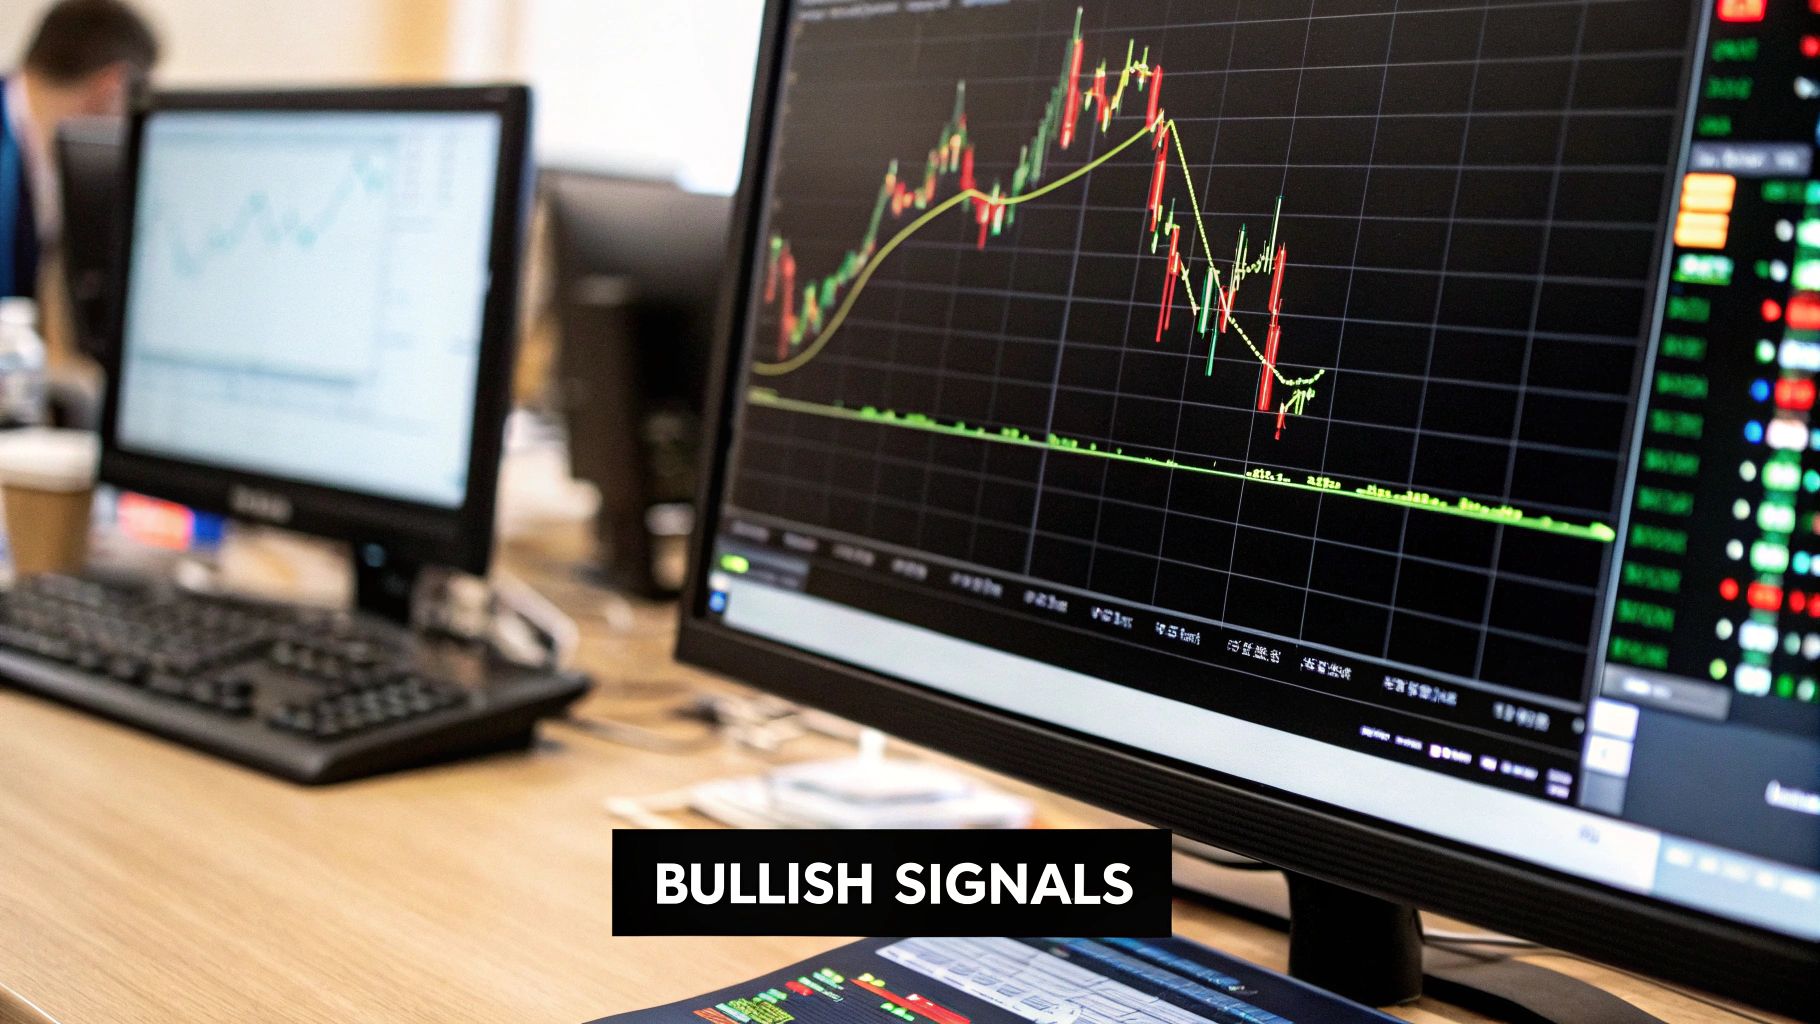
Let's dive into three of the most powerful bullish setups you’ll come across in your day-to-day trading.
The Hammer: A Symbol of Rejection
The Hammer is a classic one-candle pattern that screams "potential bottom." Picture this: sellers have been pushing the price down hard. All of a sudden, a wave of buying pressure crashes in, stopping the drop cold and driving the price all the way back up to close near where it opened.
This fierce battle leaves a very distinct shape on your chart:
- A small body right at the top of the candle.
- A long lower wick that's at least twice the size of the body.
- Almost no upper wick at all.
That long lower wick is the whole story—it's the footprint of buyers flat-out rejecting lower prices. It tells you the sellers have lost control, potentially opening the door for a long trade. A close cousin to the Hammer is the bullish pin bar, which also shows a strong rejection of a key price level. To really get a handle on these rejection candles, check out this in-depth guide on the bullish pin bar strategy.
The Bullish Engulfing Pattern: A Power Play by Buyers
The Bullish Engulfing is a two-candle reversal signal that shows a dramatic, almost violent shift in momentum. It shows up after a downtrend and is made of a small red (bearish) candle followed by a huge green (bullish) candle that completely "engulfs" the body of the one before it.
This pattern isn't just a reversal; it's a statement. It tells you that buyers have not only soaked up all the selling pressure from the prior candle but have also taken firm control, shoving the price significantly higher.
For this pattern to be legit, the body of the second, bullish candle has to completely swallow the body of the first, bearish candle. This is a very clear signal that buying pressure has absolutely overwhelmed the sellers.
The Morning Star: A Sign of Hope
The Morning Star is a three-candle pattern that signals a more gradual, but just as powerful, reversal. Think of it as a short story unfolding over three candles:
- The First Candle: A long red candle that continues the downtrend, business as usual for the sellers.
- The Second Candle: A small-bodied candle (it can be red, green, or a Doji) that gaps down. This shows the sellers are starting to get nervous and indecisive.
- The Third Candle: A strong green candle that closes deep into the body of the first red candle.
This formation shows that the selling momentum from candle one completely fizzled out in candle two. The strong bullish move on the third candle confirms that buyers have seized control and are now firmly in the driver's seat.
For any of these candlestick patterns for intraday trading, confirmation is everything. Always look for a spike in volume on the reversal candle. High volume acts as proof, suggesting a lot of traders are piling in and increasing the odds that your trade will work out.
Identifying Bearish Patterns for Profitable Exits
Just as bullish patterns can signal a great time to get in, bearish patterns are your early warning system to get out.
Learning to spot when buying momentum is starting to sputter is absolutely critical for locking in profits, cutting a losing trade before it gets worse, or even finding a chance to go short. These patterns tell a clear story: the buyers are losing their grip, and the sellers are starting to move in.
When you see these formations pop up on an intraday chart, it gives you a massive edge. You can react quickly before a nasty downward slide wipes out your hard-won gains. They represent a real shift in market psychology, from optimism back toward fear and uncertainty.
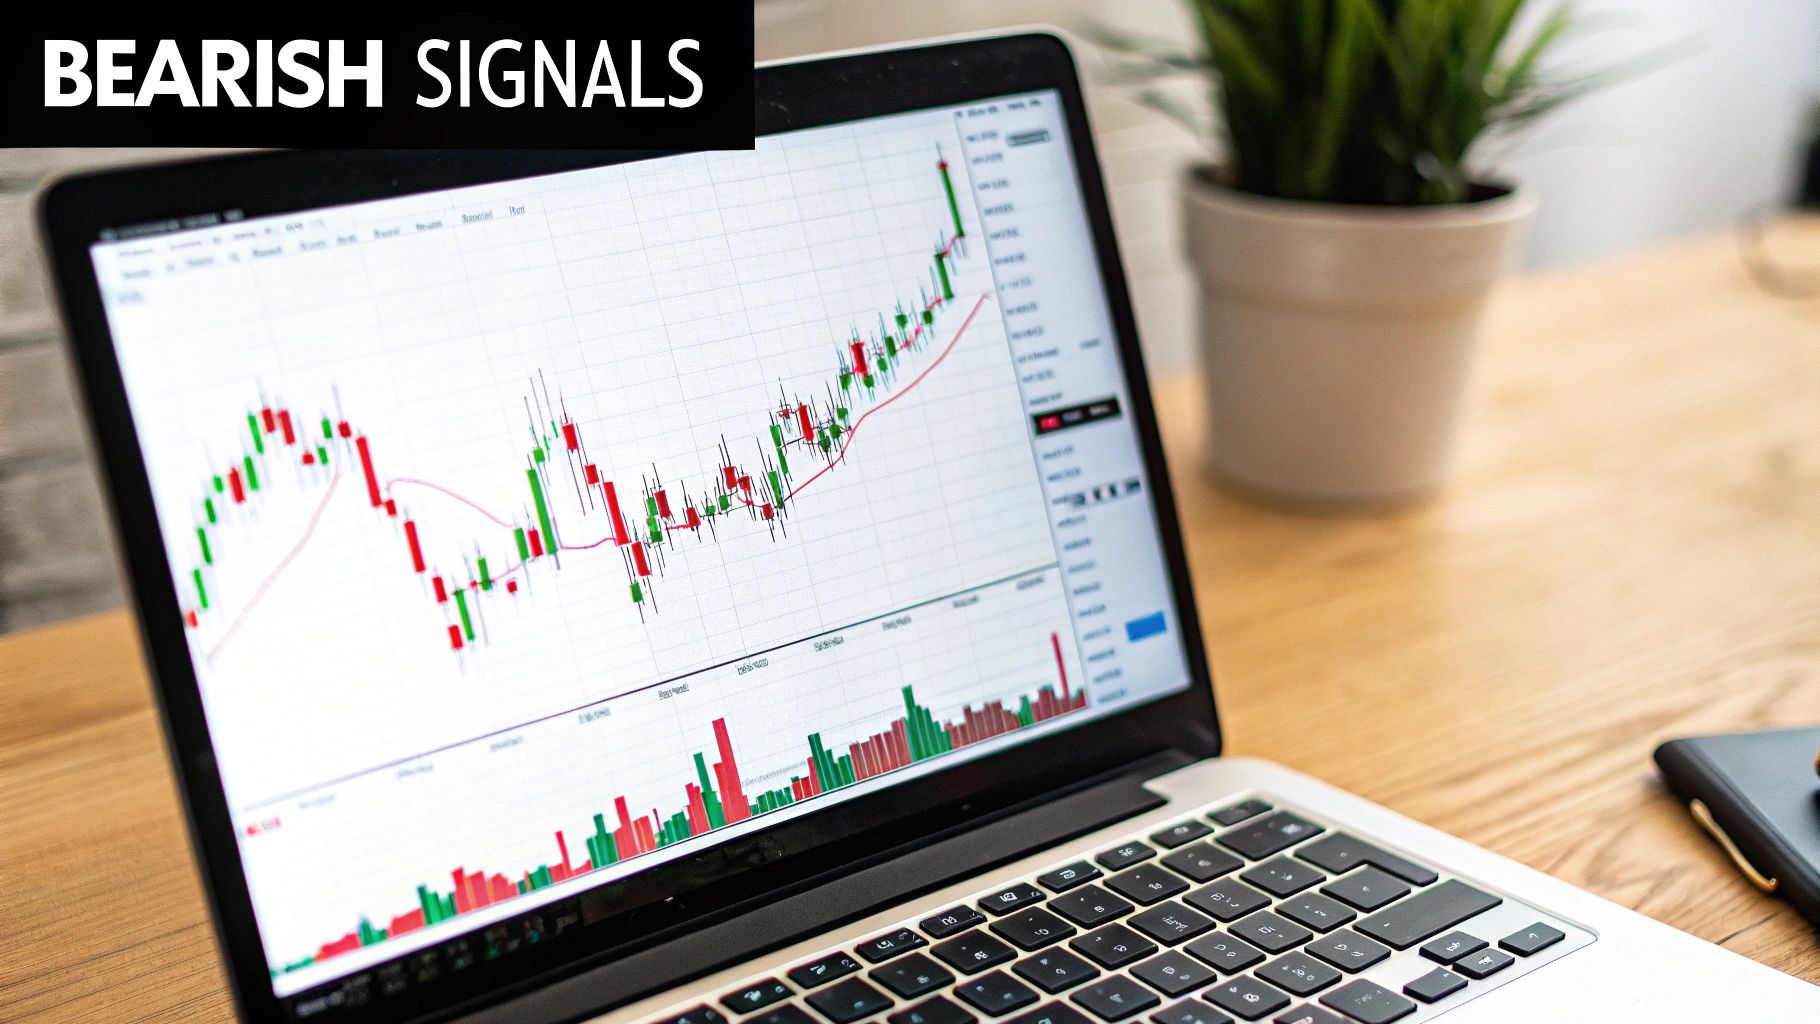
Let's break down three of the most reliable bearish candlestick patterns I watch for in my own intraday trading.
The Shooting Star: A Warning Shot from Sellers
Think of the Shooting Star as the evil twin of the bullish Hammer pattern. It's a single candle that tends to show up at the top of an uptrend, and it's a classic signal of a potential reversal. The story it tells is one of failed ambition. Buyers gave it their all to push the price higher, but sellers came in and aggressively shoved it right back down.
Here’s what to look for:
- A small body near the bottom of the candle's range.
- A long upper wick that is at least twice the size of the body.
- Little to no lower wick at all.
That long upper wick is like a monument to failed buying pressure. It shows that buyers were decisively rejected at a higher price, a dead giveaway that sellers are stepping in with some serious force.
The Bearish Engulfing Pattern: An Aggressive Takeover
Just like its bullish counterpart, the Bearish Engulfing is a potent two-candle signal. What I like about this one is how it shows a sudden, dramatic shift in control. The pattern is simple: a small green (bullish) candle followed by a large red (bearish) candle that completely swallows, or "engulfs," the body of the one before it.
This pattern isn’t just a hint of weakness; it’s a declaration of war by the sellers. It screams that selling pressure not only overwhelmed the previous candle's buying momentum but went even further, signaling a strong chance of more downside to come.
For a true Bearish Engulfing, that second candle's body has to completely consume the first one. This visual is powerful—it shows you the market's sentiment has flipped on a dime.
The Evening Star: The Beginning of the Night
The Evening Star is a three-candle formation that signals a more gradual, but equally powerful, reversal from an uptrend. It's the bearish version of the Morning Star and tells a story in three acts:
- The First Candle: A strong green candle, continuing the prevailing uptrend. Everything looks great for the bulls.
- The Second Candle: A small-bodied candle (sometimes a Doji) that gaps up. This is the moment of hesitation; buyers are suddenly looking indecisive.
- The Third Candle: A powerful red candle that closes well into the body of that first green candle, confirming the reversal.
This sequence shows you the peak of bullish enthusiasm (candle one), the first sign of doubt (candle two), and the decisive takeover by sellers (candle three). Other formations can also signal exhaustion, like the rising wedge. You can learn more about how the rising wedge pattern works as a bearish reversal signal.
But remember, as with any trading signal, confirmation is your best friend. I always look for a spike in volume to go along with these bearish patterns. It confirms that the selling pressure is real and not just a minor blip on the chart.
Building Your Intraday Trading Game Plan
Spotting a perfect Hammer or a clean Engulfing pattern feels great, but I'll be blunt: it's only the first step. A single pattern isn't a strategy; it's just a signal. To actually make money with candlestick patterns for intraday trading, you have to wrap that signal in a repeatable, disciplined game plan.
Think of it like a recipe. The candlestick pattern is your main ingredient. But you still need instructions for when to add it, how much heat to apply, and when to take it off the stove. Without a complete plan, even the best-looking signals can turn into losing trades.
This is where you graduate from being a simple pattern spotter to a strategic trader. It's about defining your exact rules for entry, exit, and risk management before you even think about hitting that buy or sell button. A solid framework pulls emotion and guesswork out of the equation—and those are the two biggest enemies of a day trader.
From Signal to Execution: A Three-Step Process
Every trade needs to follow a logical sequence. One of the most common and costly mistakes I see is traders rushing in the second they see a pattern form. That's a quick way to drain an account. Instead, a patient, step-by-step approach ensures you're only taking high-quality setups.
This infographic breaks down a simple but effective workflow for turning a candlestick signal into a trade you can be confident in.
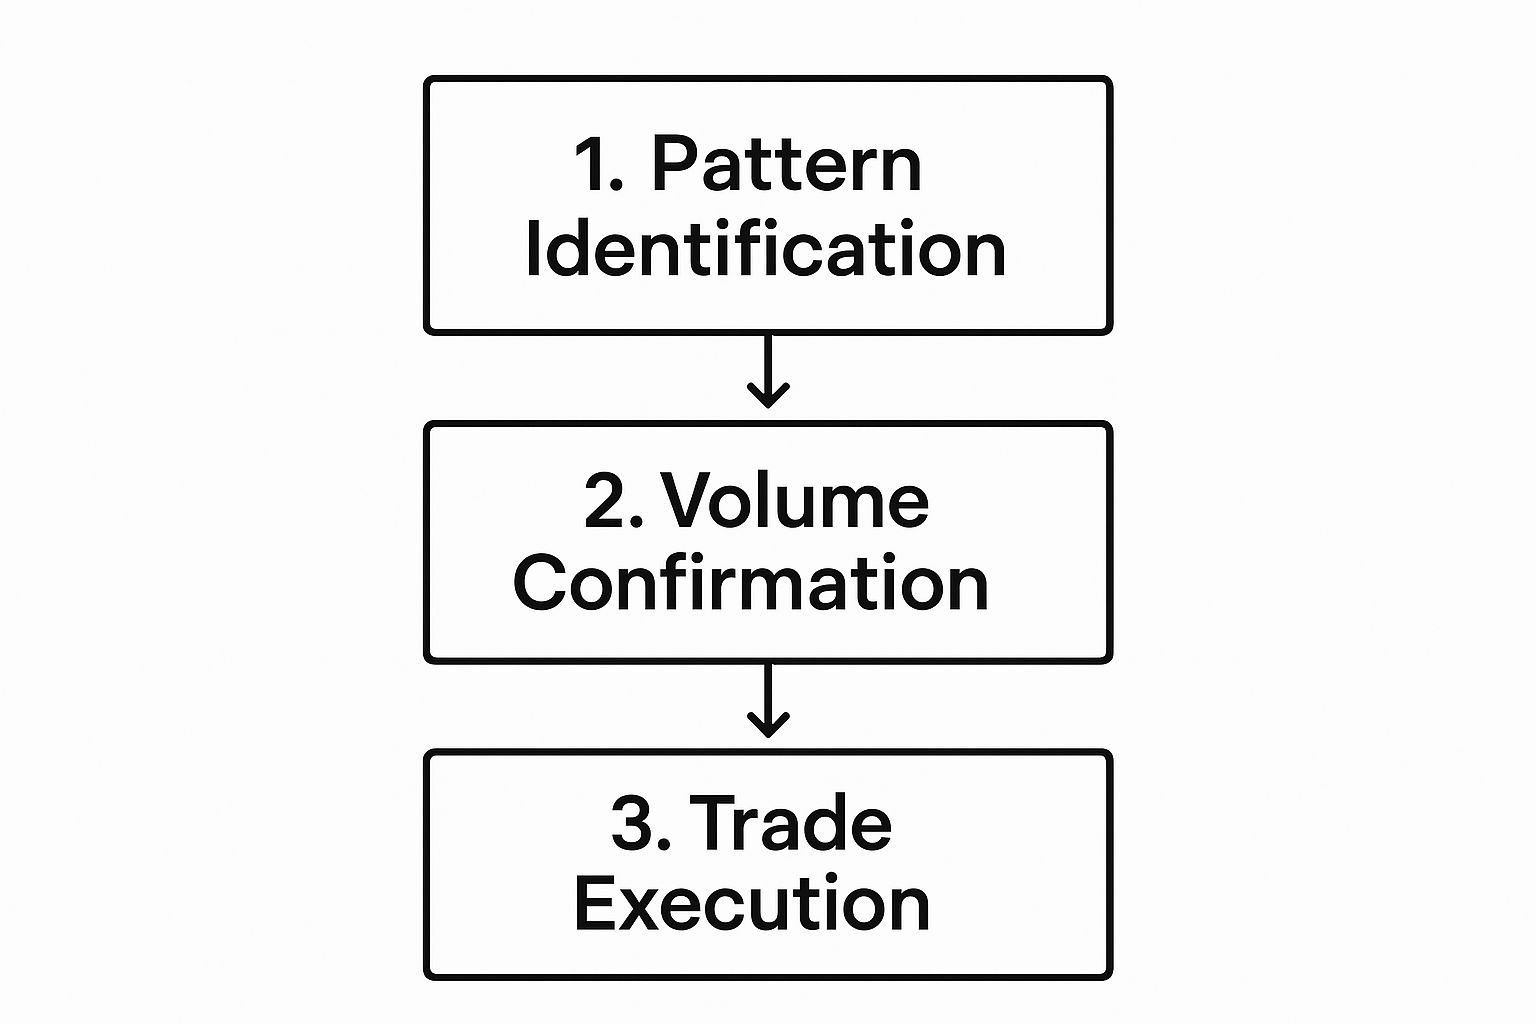
As you can see, identifying the pattern is just the beginning. It's the confirmation and disciplined execution that really separate a winning trade from a losing one.
Defining Your Rules of Engagement
To build your own plan, you need to have a rock-solid answer to three critical questions for every single trade you consider. Let's walk through it using a Bullish Engulfing pattern as our example.
-
What is my precise entry trigger? Don't just jump in when the pattern appears. A pro waits for confirmation. A good rule is to enter only after the bullish engulfing candle has fully closed and the next candle trades above its high. This small piece of patience proves that buyers are still in control and ready to push higher.
-
Where is my stop-loss? This is non-negotiable. Your stop-loss is your safety net, the one thing that protects your capital when a trade goes south. For a Bullish Engulfing pattern, a logical place for your stop is just a few ticks below the low of that big engulfing candle. If the price drops below that level, your bullish idea is clearly wrong, and it's time to get out.
-
What is my profit target? Hope is not a strategy. You need a realistic, pre-defined target for taking profits. A common method is to aim for a risk-to-reward ratio of at least 1:1.5 or 1:2. Another great approach is to target the next significant resistance level you can identify on the chart.
A well-defined trading plan is your personal rulebook. It keeps you consistent, manages risk, and prevents you from making emotional decisions in the heat of the moment. Without it, you are simply gambling.
To help you visualize how these components come together, here's a sample trading plan built around a Hammer pattern.
| Component | Rule | Rationale |
|---|---|---|
| Pattern | A Hammer candle forms after a downtrend. | Signals potential bullish reversal as buyers stepped in. |
| Confirmation | The candle must form at a known support level. | Adds weight to the signal; shows a logical reason for the reversal. |
| Entry Trigger | Buy when the candle following the Hammer trades above the Hammer's high. | Confirms that bullish momentum is continuing. |
| Stop-Loss | Place stop-loss 5-10 ticks below the low of the Hammer candle. | A break below this level invalidates the bullish reversal signal. |
| Profit Target | Target the nearest resistance level, ensuring at least a 1:2 risk/reward ratio. | Provides a logical exit point and ensures the potential reward justifies the risk. |
| This table isn't just a set of rules; it's a complete, repeatable process that removes guesswork from your trading. |
The Power of Context and Confirmation
A candlestick pattern appearing in the middle of nowhere is weak. A pattern appearing at a key technical level? That's powerful. Context is everything. You can dramatically improve your odds by only trading patterns that form at pre-identified areas of support or resistance.
A Hammer pattern at a known support level is a much stronger buy signal than one floating in empty space. Likewise, a Shooting Star that appears right at a major resistance zone is a high-probability opportunity to go short. Combining patterns with these key price levels adds a critical layer of confirmation to your trades.
And remember, not all patterns are created equal. A study found that while about 66% of 75 different patterns showed an edge over the S&P 500 in backtests, performance varies widely. For instance, the Hammer pattern showed a higher success rate when identifying bottoms based on low prices, but it was less effective when analyzed using closing prices. This just goes to show how specific criteria and market conditions matter. You can dive deeper into the statistical performance of candlestick patterns in detailed academic research.
Avoiding Common Candlestick Trading Mistakes
It's one thing to learn how to spot candlestick patterns. It's a completely different ballgame to actually make money with them. So many traders get good at pattern recognition but still end up in the red. Why?
It usually comes down to a handful of classic psychological and strategic blunders. Think of what follows as your defensive playbook. Mastering these points will protect your capital and give you the disciplined edge you need for intraday trading.
Ignoring the Broader Market Context
This is probably the single most destructive mistake a new trader can make: trading a pattern in a total vacuum.
You spot a picture-perfect Bullish Engulfing pattern on the 5-minute chart. Looks great, right? But what you fail to see is that the hourly chart is in a monster downtrend. You’re trying to catch a tiny bounce while a freight train is barreling down on you. It's a recipe for disaster.
Before you even think about taking a trade, zoom out. Always check the trend on a higher timeframe, like the hourly or even the 4-hour chart. Get the bigger picture first.
- Rule of Thumb: Only take bullish intraday patterns when the higher timeframe trend is also bullish or at least chopping sideways.
- And the flip side: Focus on bearish setups when the bigger picture is clearly negative.
This simple check acts as a powerful filter. It immediately weeds out those low-probability trades that look tempting up close but are almost certainly doomed to fail against the larger market current.
Forgetting Volume Confirmation
A candlestick pattern tells a story about price, but volume tells you how much conviction is behind that story. A beautiful, textbook reversal pattern that forms on pathetic, anemic volume is often a trap.
It’s a clear signal that the big players—the ones who actually move markets—aren't participating. The move is hollow.
Volume is the fuel in the engine. A candlestick pattern without a surge in volume is like a Ferrari with an empty gas tank. It looks impressive, but it’s not going anywhere.
When you see high volume pour in on a key reversal candle, like a Hammer or an Engulfing pattern, that's your confirmation. It tells you a significant number of traders are putting their money behind this move. That surge of interest dramatically boosts the odds that the pattern will lead to a real shift in price.
Always, always demand volume confirmation before you risk a single dollar on a trade.
The Trap of Overtrading Every Signal
Once your eyes are trained to spot candlestick patterns, you'll start seeing them everywhere. It’s exciting at first, but it can quickly lead to a capital-destroying habit: overtrading.
You start jumping on every minor signal that flickers across your screen. Here’s the hard truth: not every pattern is a high-quality, actionable signal worth your risk. Most aren't.
You absolutely must be selective. This is where a solid trading plan becomes your best friend. It’s the filter that separates the A+ setups from the noise.
- Define Your Perfect Setup: What does an ideal trade look like for you? Does it have to form at a major support or resistance level? Must it align with the higher timeframe trend? Get specific.
- Stick to the Plan: If a pattern doesn’t check every single one of your boxes, you have to find the discipline to let it go. No exceptions.
Patience truly is a trader’s greatest virtue. Waiting for the high-probability setups instead of chasing every little blip is fundamental to long-term success when using candlestick patterns for intraday trading.
A Few Common Questions About Day Trading with Candlesticks
Even when you feel like you've got a solid trading plan, questions are going to pop up. The world of intraday trading moves fast and can be confusing, so let's clear the air and tackle some of the most common questions I hear from traders using candlestick patterns.
What Is the Best Time Frame for Intraday Candlestick Analysis?
Picking the right time frame is a huge decision; it pretty much defines your entire trading style. There's no single "best" answer here, because each one has its own personality when it comes to spotting candlestick patterns for intraday trading.
-
1-Minute Chart: This is scalper territory. You'll see the most trading signals, but you'll also have to deal with the most noise. Patterns form and fizzle out in the blink of an eye, so you need lightning-fast execution and nerves of steel.
-
5-Minute Chart: A lot of day traders call this the sweet spot, and for good reason. It filters out a ton of the noise you'd see on the 1-minute chart but it's still quick enough to catch the major moves of the day. Patterns here tend to be more reliable.
-
15-Minute Chart: This time frame gives you an even clearer view of the day's trend. The patterns you find here are often more significant, but you won't get as many signals. It's a great choice for traders who prefer a slightly slower pace and want to aim for bigger price swings within the day.
Ultimately, your ideal chart comes down to your personality and your strategy. If you're just starting out, try the 5-minute chart. Get a feel for it, and then you can experiment with shorter or longer intraday frames to see what clicks.
How Reliable Are These Patterns on Their Own?
This is something every single trader needs to burn into their brain: a candlestick pattern by itself is not a reliable trading signal. Period.
Think of a candlestick pattern as a clue, not a conclusion. It’s a piece of evidence suggesting a potential shift in the market's mood, but you need supporting evidence before you can act on it with any real confidence.
Trading based on a pattern alone is just gambling. Real, professional analysis is about putting the puzzle pieces together. A bullish Hammer pattern is way more powerful if it shows up at a major support level, on high volume, and lines up with the broader market trend. Without that context, it’s just a random shape on your screen.
Can Candlestick Trading Be Automated?
Yes, you can automate candlestick trading, but it's a lot trickier than it sounds. You can definitely program an algorithm to spot the specific mathematical rules of a pattern—for instance, a Hammer's lower wick must be at least twice the size of its body.
The problem is, automation often fails to grasp the nuance and discretion that a human trader brings to the table. An algorithm might spot a textbook-perfect pattern but completely miss the subtle market context that tells an experienced trader to stay away.
So while you can automate the execution of trades based on set rules, the most successful automated strategies still need a huge amount of human oversight, constant testing, and ongoing refinement.
At Colibri Trader, we teach you how to read the story the market is telling through pure price action. Our courses give you a clear, indicator-free path to building a disciplined and profitable trading plan. Stop guessing and start trading with confidence by exploring our proven methods at https://www.colibritrader.com.