


Candlestick Patterns Cheat Sheet: 10 Essential Signals
Navigating the financial markets without understanding price action is like trying to read a book in a language you don't know. The charts tell a story of supply and demand, of fear and greed, and the most fundamental characters in this story are candlesticks. Each one is a snapshot of the battle between buyers and sellers over a specific period. When these candlesticks form specific sequences, they create patterns that can offer powerful clues about potential market reversals or continuations. This is where a reliable candlestick patterns cheat sheet becomes an indispensable tool for any trader.
This guide is designed to be that tool. It’s a no-fluff, actionable reference that cuts straight to what matters: identifying high-probability trading setups. We won't waste time on abstract theories or complicated histories. Instead, you'll get a direct, visual-first breakdown of the most essential bullish and bearish patterns. For each pattern, we will provide a clear definition, visual example, and its trading implication. More importantly, we’ll integrate key price-action principles to give you a strategic edge.
You will learn not just what a pattern is, but how to trade it effectively. This includes crucial confirmation signals to look for, common pitfalls to avoid that trap novice traders, and concise notes on potential entry and exit points. Think of this as more than just a list; it’s a practical, printable framework designed to help you decode the market's language with greater confidence and precision, transforming raw chart data into a clear strategic advantage.
1. Hammer
The Hammer is a powerful bullish reversal pattern that often signals the end of a downtrend. This single-candlestick formation is defined by its small real body, a long lower wick that is at least twice the size of the body, and little to no upper wick. Its name comes from its shape, which resembles a hammer "hammering out" a bottom in the market. This pattern indicates that sellers pushed the price down significantly during the session, but a strong wave of buying pressure stepped in to reject those lower prices and drive the close back up near the open.

This rejection of lower prices is a critical piece of market psychology, suggesting that the bears are losing control and the bulls are starting to gain momentum. A green (bullish) Hammer is generally considered stronger than a red (bearish) one, as it shows buyers not only rejected lower prices but also managed to close above the opening price.
Trading the Hammer Pattern
To effectively integrate the Hammer into your strategy, context is everything. The pattern is most reliable when it forms after a significant downtrend and at a key support level, such as a previous low, a trendline, or a moving average. This confluence of signals strengthens the probability of a successful reversal.
For example, imagine the EUR/USD pair has been in a steep decline for several days and is approaching a major daily support level. The formation of a Hammer right at this level provides a strong signal that the downtrend may be exhausting. Traders would look for confirmation on the next candle before considering a long position.
Colibri Trader’s Insight: A Hammer isn't a trade signal in isolation. It's a clue. The real power comes from its location. A Hammer at a key demand zone or support level tells a compelling story of seller exhaustion and the potential entry of institutional buyers.
Key Confirmation and Execution Rules
- Confirmation: Always wait for the next candle to confirm the reversal. A strong bullish confirmation is a candle that closes decisively above the Hammer's high.
- Volume: Higher-than-average volume on the Hammer candle adds significant weight to the signal, indicating strong participation in the price rejection.
- Entry: A common entry point is just above the high of the Hammer candle, but only after the confirmation candle has closed.
- Stop-Loss: Place your stop-loss just below the low of the Hammer's wick. This defines your risk and invalidates the trade setup if the price breaks this critical level.
2. Hanging Man
The Hanging Man is a bearish reversal pattern that serves as a potential warning sign at the peak of an uptrend. While visually identical to the Hammer, its location is what defines its bearish implication. This single-candlestick pattern features a small real body, a long lower wick at least twice the body's size, and little to no upper wick. It appears after a period of rising prices and suggests that while buyers pushed the price to new highs, a significant sell-off occurred during the session.
The market psychology behind the Hanging Man indicates a potential shift in momentum. The long lower wick shows that sellers were able to drive the price down substantially before buyers managed to push it back up near the open. This newfound selling pressure at the top of an advance is a red flag, hinting that the bulls are losing control and a price top may be forming.
Trading the Hanging Man Pattern
Context is paramount when interpreting the Hanging Man. Its signal is most potent when it forms after a sustained uptrend and appears at a key resistance level, such as a previous high, a supply zone, or an upper trendline. This confluence of bearish signals greatly increases the probability of a downward reversal.
For example, if a stock like Tesla has been rallying for weeks and forms a Hanging Man pattern as it approaches a major all-time high resistance level, it signals buyer exhaustion. Astute traders would see this as a potential sign that the rally is running out of steam and would prepare for a possible short entry pending confirmation.
Colibri Trader’s Insight: The Hanging Man is a crack in the bullish armor. By itself, it’s a warning. When it appears at a well-defined supply zone, it tells you that institutional sellers are likely stepping in to defend that level. This is where high-probability short trades are born.
Key Confirmation and Execution Rules
- Confirmation: Never act on the Hanging Man alone. Wait for the next candle to confirm the reversal. Strong confirmation is a bearish candle that closes decisively below the low of the Hanging Man's real body.
- Volume: Increased volume on the confirmation candle strengthens the bearish signal, showing conviction from sellers.
- Entry: A common entry for a short position is just below the low of the confirmation candle. This ensures the bearish momentum is in play before you commit.
- Stop-Loss: Place your stop-loss just above the high of the Hanging Man's wick. If the price breaks this level, the bearish setup is invalidated, and your risk is contained.
3. Engulfing Pattern
The Engulfing pattern is a potent two-candle reversal signal that indicates a potential shift in market control. It occurs when a large candle's real body completely "engulfs" the real body of the preceding, smaller candle. A Bullish Engulfing pattern appears at the end of a downtrend, signaling a potential move higher, while a Bearish Engulfing pattern forms after an uptrend, suggesting a possible reversal to the downside. This pattern visually represents a decisive and sudden change in momentum, where the second candle's strength completely overwhelms the prior session's sentiment.
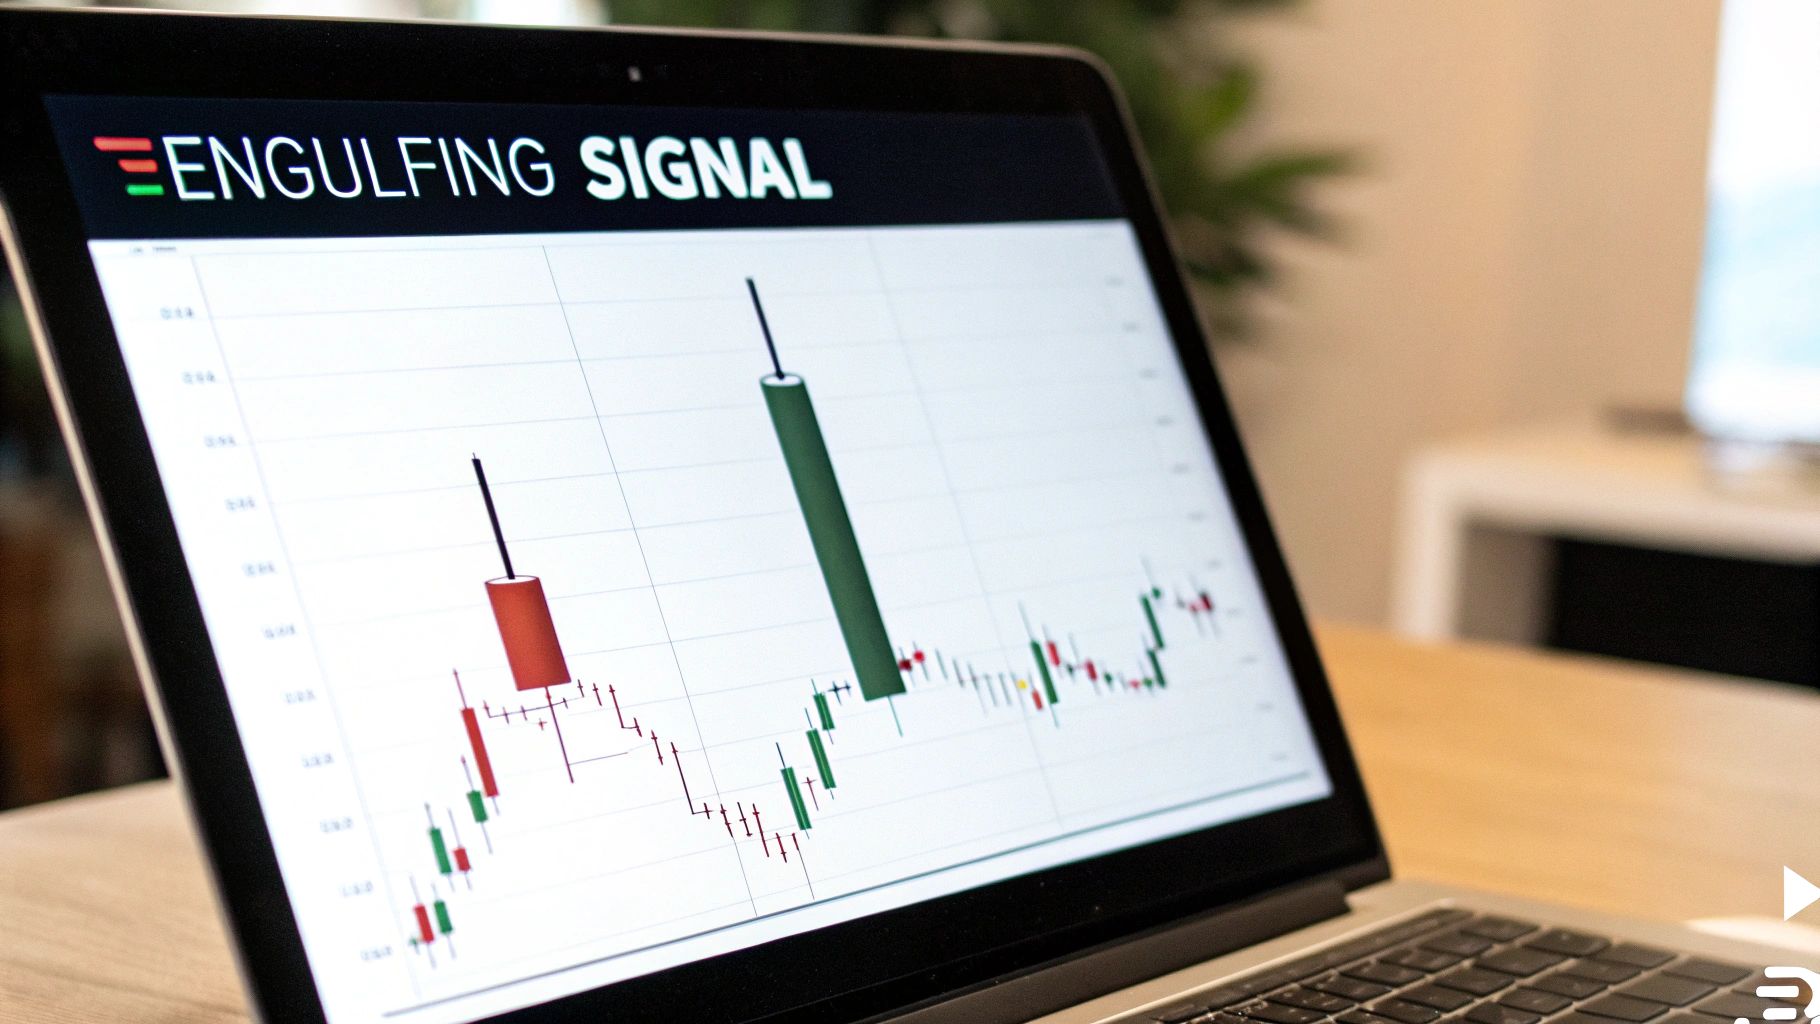
The psychology behind the pattern is a story of a complete power shift. In a Bullish Engulfing, the market opens lower than the previous close but buying pressure surges, erasing the prior day's losses and closing significantly higher. Conversely, in a Bearish Engulfing, bulls initially push the price higher, but sellers take control, driving the price down to close well below the previous day's open.
Trading the Engulfing Pattern
The reliability of the Engulfing pattern, a key part of any candlestick patterns cheat sheet, increases dramatically with its location. A Bullish Engulfing pattern is most powerful when it forms at a pre-identified support level or demand zone. A Bearish Engulfing carries more weight when it appears at a significant resistance level or supply zone. A preceding, well-defined trend is crucial for the pattern to signal a true reversal rather than just market consolidation.
For instance, consider Apple stock (AAPL) trending downwards towards a key support level after a disappointing earnings report. If a small red candle is followed by a large green candle that completely engulfs it right at that support, it signals that buyers are stepping in aggressively, absorbing all the selling pressure and potentially starting a new uptrend.
Colibri Trader’s Insight: An Engulfing pattern at a major level is like a loud announcement. It tells you that the dominant force (buyers at support, sellers at resistance) has drawn a line in the sand. The bigger the engulfing candle and the higher the volume, the louder the announcement.
Key Confirmation and Execution Rules
- Confirmation: A strong confirmation is a subsequent candle that continues in the direction of the engulfing candle. For a Bullish Engulfing, the next candle should close above its high.
- Volume: A spike in volume on the engulfing candle is a critical confirmation element. It shows strong conviction behind the reversal and increases the pattern's reliability.
- Entry: For a Bullish Engulfing, a common entry is just above the high of the engulfing candle after confirmation. For a Bearish Engulfing, entry is placed just below its low.
- Stop-Loss: To manage risk, place a stop-loss just below the low of the Bullish Engulfing pattern or just above the high of the Bearish Engulfing pattern.
4. Doji
The Doji is a critical pattern that signals indecision and a potential turning point in the market. This single-candlestick formation is characterized by an open and close price that are virtually identical, resulting in a very small or non-existent real body. With wicks extending both above and below, it often resembles a cross or a plus sign, representing a stalemate between buying and selling pressure. This equilibrium suggests that the prevailing trend's momentum is fading, creating an opportunity for a reversal.
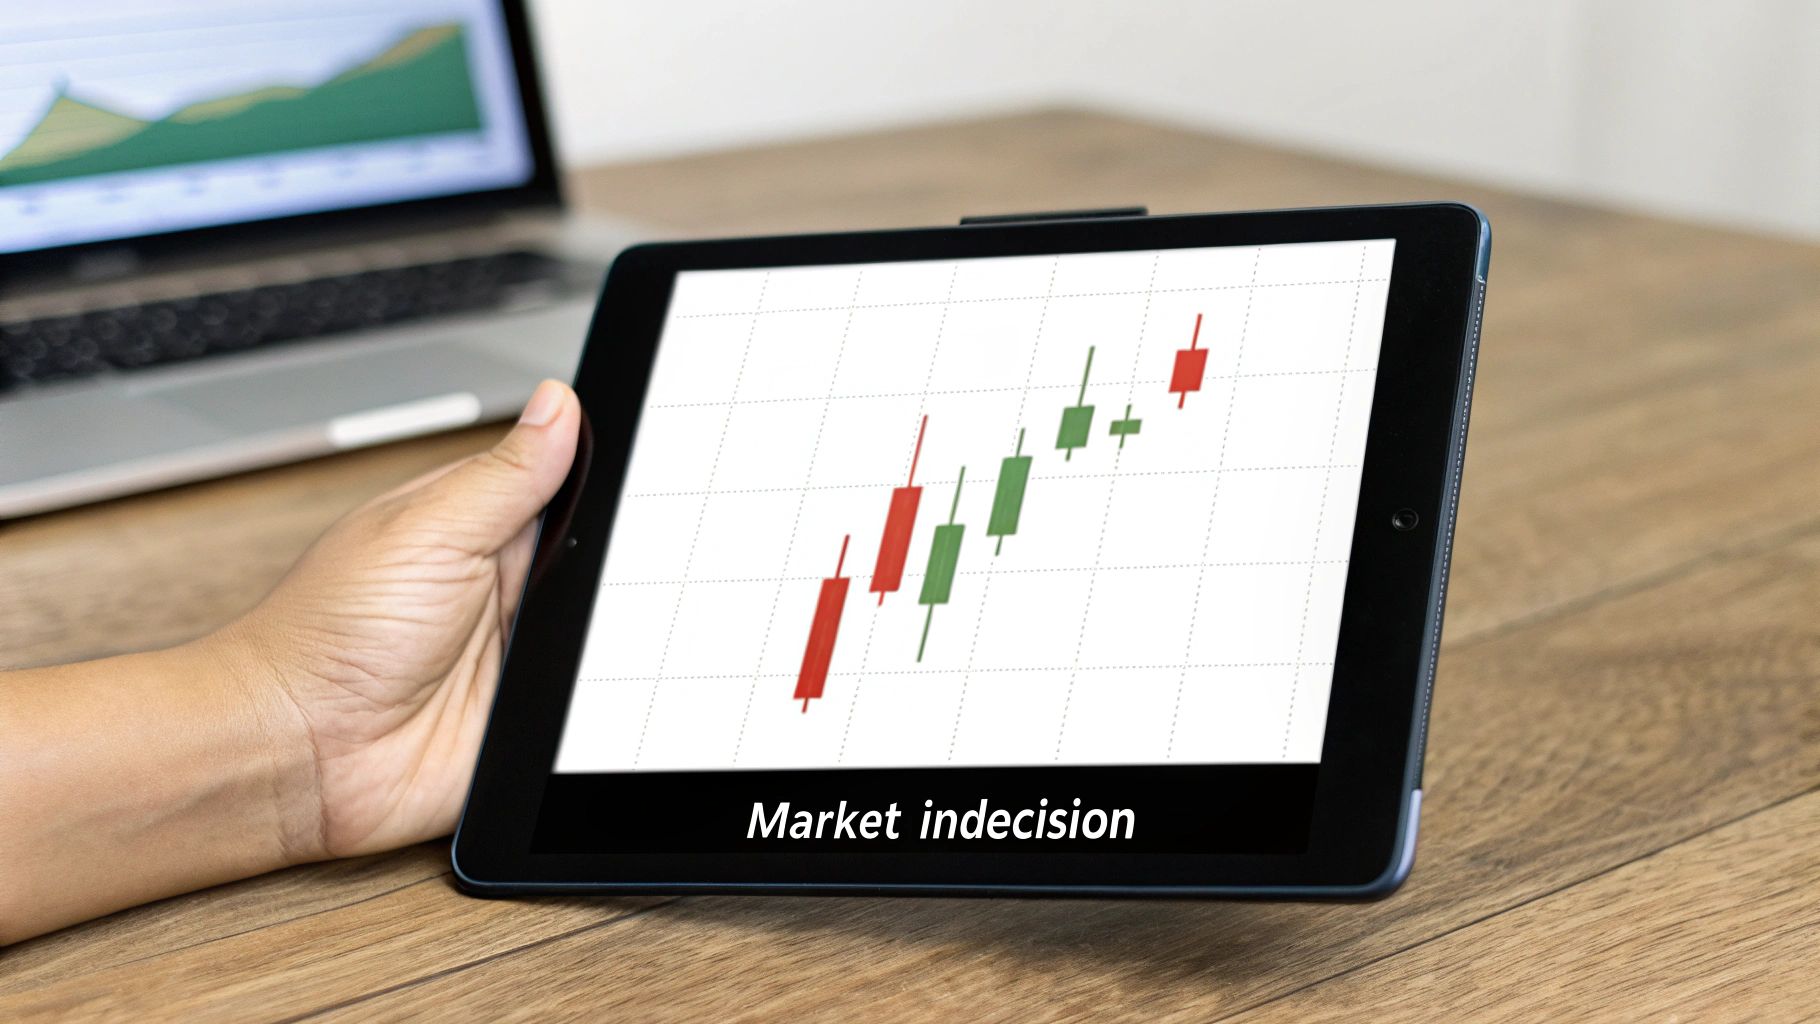
The psychology behind the Doji is one of pure market uncertainty. During the session, both bulls and bears fought for control, but neither side could claim victory by the close. This pause is most significant after a strong, prolonged trend. Its appearance can warn traders that the dominant force is losing conviction, and a change in direction may be imminent. Different variations, like the Gravestone Doji, can offer more specific clues. You can discover more about Doji variations to deepen your analysis.
Trading the Doji Pattern
A Doji is a signal of a potential shift, not a definitive trade trigger on its own. Its predictive power is amplified significantly by its location on the chart. A Doji appearing at a key resistance level after a strong uptrend, or at a major support level after a downtrend, is a high-probability setup that warrants close attention. This confluence suggests that the established trend has hit a significant barrier and is struggling to continue.
For instance, if a stock has been rallying and forms a Doji as it tests its 50-day moving average from below (as resistance), it indicates that sellers are defending that level aggressively, potentially halting the upward momentum. Traders would then watch the subsequent candle for confirmation of a bearish reversal before considering a short position.
Colibri Trader’s Insight: A Doji is the market taking a breath. It’s a moment of perfect balance before the next move. When this pause happens at a major supply or demand zone, it's often the "calm before the storm," signaling a powerful reversal is brewing.
Key Confirmation and Execution Rules
- Confirmation: Never trade a Doji in isolation. Wait for the next candle to confirm the direction. For a bearish reversal, the confirmation candle should close below the Doji’s low. For a bullish reversal, it should close above the Doji’s high.
- Volume: Pay attention to volume. A high-volume Doji after a long trend shows a significant struggle, while a low-volume Doji might just be market noise.
- Entry: Enter a short trade just below the low of a bearish confirmation candle, or a long trade just above the high of a bullish confirmation candle.
- Stop-Loss: Place your stop-loss just above the high of the Doji's upper wick for a short trade, or just below the low of its lower wick for a long trade. This level represents the point of maximum indecision.
5. Morning Star
The Morning Star is a classic three-candle bullish reversal pattern that signals a potential bottom in a downtrend. This powerful formation indicates a significant shift in market sentiment from bearish to bullish. It consists of a large bearish candle, followed by a small-bodied candle (the "star") that gaps down, and finally, a large bullish candle that closes well into the body of the first bearish candle. The pattern represents a moment of indecision followed by a decisive bullish takeover.
The psychology behind the Morning Star is a story of transition. The first candle shows bears are firmly in control. The second, small-bodied candle (which can be red or green) shows that selling pressure has stalled, and neither bulls nor bears can gain the upper hand. The third strong bullish candle confirms that buyers have seized control and are aggressively pushing prices higher, invalidating the previous downtrend's momentum.
Trading the Morning Star Pattern
For the Morning Star to be a high-probability setup, it must appear after a clear and established downtrend. Its reliability increases dramatically when it forms at a pre-identified support zone, such as a horizontal support line, a long-term moving average, or a key Fibonacci retracement level. The confluence of the pattern with a strong support area provides a more robust signal for a potential market reversal.
Imagine a cryptocurrency like Bitcoin has been in a sharp selloff for several days. As it approaches a well-known support level, a Morning Star pattern forms on the daily chart. This gives traders a strong indication that the selling momentum is exhausted and a new uptrend could be starting. Traders would then look for confirmation before committing to a long position.
Colibri Trader’s Insight: The Morning Star is a narrative of a failed bearish attack. The first candle is the charge, the star is the stalemate, and the third candle is the powerful bullish counter-attack. When this battle occurs at a strategic support level, it's a clear signal that the larger players are stepping in to defend that price.
Key Confirmation and Execution Rules
- Confirmation: The most crucial confirmation is the close of the third candle. It must close at least halfway up the body of the first bearish candle. A close above the first candle's high is even stronger.
- Volume: Look for a surge in volume on the third bullish candle. This indicates strong buying conviction and adds significant credibility to the reversal signal.
- Entry: A common entry strategy is to enter a long position above the high of the third candle once it has closed, confirming the bullish momentum.
- Stop-Loss: Place a protective stop-loss just below the low of the second candle (the star). This is the lowest point of the pattern and serves as a clear invalidation level for the trade setup.
6. Evening Star
The Evening Star is a classic three-candle bearish reversal pattern that often signals the peak of an uptrend, serving as the mirror opposite of the Morning Star. This formation warns traders that bullish momentum is fading and a potential downtrend is imminent. It consists of a large bullish candle, followed by a small-bodied candle (a "star") that gaps up, and finally, a decisive bearish candle that closes well into the body of the first candle.
The market psychology behind this pattern reveals a story of shifting power. The first candle shows strong buying pressure. The second candle, the star, represents indecision and a potential stall in momentum. The third bearish candle confirms that sellers have seized control, erasing a significant portion of the first day's gains and signaling a probable reversal.
Trading the Evening Star Pattern
The Evening Star pattern is most potent when it appears after a sustained uptrend and at a significant resistance level. A confluence of the pattern with a supply zone, a key Fibonacci retracement level, or a descending trendline provides a high-probability setup for a short position.
For instance, consider a stock that has been rallying for weeks and is now approaching a known historical resistance area. The appearance of a clear Evening Star at this level is a strong indication that the rally is exhausted. Traders would watch for the completion of the third candle before planning a short entry, anticipating a move lower.
Colibri Trader’s Insight: The Evening Star is more than just three candles; it's a narrative of a failed bull run. The 'star' is the climax of buying exhaustion. When the third candle appears and negates the initial bullish effort, it's a powerful signal that the smart money is likely distributing their long positions.
Key Confirmation and Execution Rules
- Confirmation: The pattern is confirmed once the third bearish candle closes. A more aggressive confirmation is a subsequent candle that breaks below the low of the third candle.
- Volume: Ideally, the third bearish candle should be accompanied by an increase in volume, which reinforces the strength of the seller's conviction.
- Entry: A common entry for a short position is just below the low of the third candle in the pattern, after it has closed.
- Stop-Loss: Place the stop-loss just above the high of the star (the second candle), as a break above this level would invalidate the entire bearish reversal signal.
7. Harami Pattern
The Harami is a two-candlestick reversal pattern that signals potential market indecision and a loss of momentum. The name "Harami" is an old Japanese word for "pregnant," which aptly describes the pattern's appearance: a small-bodied second candle that is completely engulfed by the real body of the prior, larger candle. This formation suggests that the previous trend's conviction is waning, creating a potential turning point.
A Bullish Harami appears at the end of a downtrend, with a large bearish candle followed by a smaller bullish candle. Conversely, a Bearish Harami forms during an uptrend, consisting of a large bullish candle followed by a smaller bearish one. The key psychological insight is the sudden contraction in volatility and the market's failure to continue its prior direction, hinting that the dominant force is losing control.
Trading the Harami Pattern
The Harami is a pattern of caution and potential change rather than a direct, aggressive signal. Its reliability increases significantly when it appears at critical technical levels. A Harami forming at a strong resistance zone after a prolonged uptrend, for instance, provides a much stronger case for a potential short trade than one appearing in the middle of a price range.
For example, if the S&P 500 has been rallying and forms a Bearish Harami right at a previous all-time high, it signals that the buying pressure that created the first large candle was insufficient to break resistance. The subsequent smaller candle shows indecision and a potential shift in power to the sellers. This is a prime location to watch for bearish confirmation.
Colibri Trader’s Insight: The Harami tells a story of a sudden pause. The first candle is the trend in full force; the second is a quiet moment of doubt. This doubt is most potent at key supply or demand zones. When you see it there, pay close attention-the market is reconsidering its direction.
Key Confirmation and Execution Rules
- Confirmation: A confirmation candle is crucial. For a Bullish Harami, look for the next candle to close above the high of the large preceding candle. For a Bearish Harami, the confirmation is a close below the low of the large candle.
- Volume: Ideally, the volume should decrease on the second (small) candle of the pattern, reflecting the market's indecision and pause in momentum.
- Entry: A common entry for a Bullish Harami is just above the high of the first candle after a bullish confirmation. For a Bearish Harami, enter just below the low of the first candle after bearish confirmation.
- Stop-Loss: For a bullish setup, place the stop-loss just below the low of the first candle. For a bearish setup, place it just above the high of the first candle.
8. Piercing Line Pattern
The Piercing Line is a significant two-candle bullish reversal pattern that appears at the end of a downtrend, signaling a potential shift in momentum from sellers to buyers. The pattern begins with a strong bearish candle, followed by a bullish candle that opens below the prior low (often a gap down) and closes more than halfway up the body of the first candle. This action shows that despite an initial bearish gap, buyers stepped in with enough force to reclaim a substantial portion of the previous session's losses.
The psychology behind this pattern is crucial; the gap down initially confirms bearish sentiment, but the strong close of the second candle demonstrates an aggressive rejection of lower prices. This surprise rally can catch sellers off guard and indicates that the bulls are beginning to take control. The deeper the second candle "pierces" into the body of the first, the more significant the reversal signal is considered.
Trading the Piercing Line Pattern
Like other reversal patterns, the Piercing Line’s reliability increases dramatically with context. It is most potent when it forms after a clear downtrend and lands on a key support level, such as a horizontal support line, a major Fibonacci retracement level, or a rising trendline. This confluence adds a layer of validation to the bullish reversal signal.
For instance, if a stock has been declining for weeks and forms a Piercing Line pattern right at its 200-day moving average, it presents a high-probability trade setup. This indicates that long-term buyers see value at this level and are actively defending it. Traders often look for this pattern as a sign that a market bottom may be in place.
Colibri Trader’s Insight: The Piercing Line is a story of a failed bearish continuation. The gap down lures in more sellers, but the powerful bullish close traps them. When this trap occurs at a major demand zone, it often precedes a strong and sustained move higher.
Key Confirmation and Execution Rules
- Confirmation: A bullish candle following the pattern that closes above the high of the second candle serves as strong confirmation of the reversal.
- Volume: Look for a spike in volume on the second (bullish) candle. This indicates strong buying conviction and adds credibility to the pattern.
- Entry: A common entry strategy is to place a buy order above the high of the second candle of the pattern, ideally after a confirmation candle has closed.
- Stop-Loss: A logical place for a stop-loss is just below the low of the second candle. A break below this level would invalidate the entire bullish setup.
9. Dark Cloud Cover Pattern
The Dark Cloud Cover is a potent two-candlestick bearish reversal pattern that signals a potential top or the end of an uptrend. It is essentially the bearish counterpart to the bullish Piercing Line pattern. The formation begins with a strong bullish (green) candle, followed by a bearish (red) candle that opens above the prior day's high but then closes deep into the body of the first candle, ideally below its midpoint. This action shows a significant shift in market sentiment within a single session.
The psychology behind this pattern is a dramatic power struggle. The market initially gaps up, suggesting continued bullish strength, but sellers aggressively step in and overwhelm the buyers, pushing the price down significantly. This failure to hold the higher opening price is a major red flag for bulls and suggests that the upward momentum is fading fast.
Trading the Dark Cloud Cover Pattern
The Dark Cloud Cover is most reliable when it appears after a well-established uptrend and at a key resistance level, such as a previous high, a trendline, or a Fibonacci retracement level. This confluence of bearish signals provides a much stronger case for a market reversal than the pattern appearing in isolation.
For instance, if a stock has been in a strong rally and forms a Dark Cloud Cover pattern as it approaches its all-time high, this is a powerful signal. It indicates that sellers are defending that resistance level vigorously, and the uptrend may be over. Traders would watch for confirmation on the subsequent candle before considering a short position.
Colibri Trader’s Insight: The Dark Cloud Cover is a story of a failed bullish expectation. The gap up is the bait, drawing in the last of the buyers. The sharp reversal and close below the 50% mark of the prior candle is the trap snapping shut. When this happens at a major supply zone, it’s a high-probability signal that sellers are now in control.
Key Confirmation and Execution Rules
- Confirmation: A bearish confirmation candle is crucial. This is typically a candle that closes below the low of the two-candle pattern, confirming the sellers' control.
- Volume: Look for a spike in volume on the second (bearish) candle. High volume indicates strong conviction from the sellers and adds significant credibility to the reversal signal.
- Entry: A common entry for a short position is just below the low of the second candle, but only after the bearish confirmation candle has closed.
- Stop-Loss: Place the stop-loss just above the high of the second candle (the high of the entire pattern). This level acts as a clear invalidation point for the bearish setup.
10. Shooting Star
The Shooting Star is a classic bearish reversal pattern that signals a potential top in an uptrend. This single-candlestick formation is characterized by a small real body near the low of the session, a long upper wick that is at least twice the size of the body, and little to no lower wick. It visually represents a failed rally, where buyers pushed prices significantly higher, but sellers overpowered them, driving the price back down to close near the open.
This powerful rejection of higher prices reveals a significant shift in market sentiment. It suggests that the bullish momentum is waning and the bears are beginning to take control. A red (bearish) Shooting Star is considered more potent than a green (bullish) one, as it shows sellers not only rejected the highs but also managed to close the price below the open.
Trading the Shooting Star Pattern
Context is paramount when trading the Shooting Star. The pattern holds the most weight when it appears after a sustained uptrend and at a key resistance level, such as a previous high, a trendline, or a Fibonacci extension level. This confluence of bearish signals makes it a high-probability setup in any comprehensive candlestick patterns cheat sheet.
For instance, if a stock has been rallying strongly and forms a Shooting Star right as it touches a major resistance zone, it provides a compelling signal that the rally may be over. Traders would then watch for bearish confirmation on the subsequent candle before considering a short position. The formation of this pattern is a key technique used in various strategies, including those for short-term price movements. You can learn more about using the Shooting Star for intraday trading.
Colibri Trader’s Insight: A Shooting Star is a warning flare, not a guaranteed sell signal. Its appearance at a well-defined supply zone or resistance level is where its true predictive power lies. This tells you that smart money is likely taking profits or initiating short positions.
Key Confirmation and Execution Rules
- Confirmation: Never act on the Shooting Star alone. Wait for the next candle to confirm the reversal, ideally with a bearish close below the Shooting Star's low.
- Volume: Increased volume on the Shooting Star candle strengthens the signal, indicating a significant battle where sellers ultimately won.
- Entry: A common entry strategy is to place a short order just below the low of the Shooting Star, but only after the bearish confirmation candle has closed.
- Stop-Loss: Set your stop-loss just above the high of the Shooting Star's long wick. This placement clearly defines your risk and invalidates the setup if buyers regain control.
10 Candlestick Patterns Comparison
| Pattern | 🔄 Complexity | ⚡ Resources / Requirements | ⭐ Expected outcome | 📊 Ideal use cases | 💡 Key tip |
|---|---|---|---|---|---|
| Hammer | Simple — single candle after downtrend | Prior downtrend + volume confirmation preferred | Bullish reversal; moderate→high when confirmed ⭐⭐⭐⭐ | Bottoms/support levels; all timeframes | Wait for confirmation close above hammer's open; stop-loss below wick |
| Hanging Man | Simple — identical to hammer shape at highs | Strong prior uptrend + volume on confirmation | Bearish reversal warning; moderate reliability ⭐⭐⭐ | Tops/resistance on daily+ charts | Require bearish close below body with volume before shorting |
| Engulfing Pattern | Medium — two-candle engulf requirement | Clear preceding trend + volume on second candle | Strong reversal; high reliability (≈60–70%) ⭐⭐⭐⭐⭐ | Any timeframe; strong at support/resistance and post-news moves | Ensure second candle fully engulfs and wait for next-bar confirmation |
| Doji | Simple but ambiguous — single indecision candle | Context (trend/support/resistance) + follow-up candle needed | Neutral/indecision; reversal warning, not standalone ⭐⭐⭐ | At S/R levels or during trend exhaustion; combine indicators | Never trade alone — wait for breakout or confirming candle |
| Morning Star | Higher — three-candle pattern with gap | Downtrend + gap/volume surge on third candle | Very reliable bullish reversal (70%+) ⭐⭐⭐⭐⭐ | Daily/weekly market bottoms; swing trades | Buy when third closes above first's midpoint with volume |
| Evening Star | Higher — three-candle top reversal with gap | Strong uptrend + gap and volume on third candle | Very reliable bearish reversal (70%+) ⭐⭐⭐⭐⭐ | Daily/weekly tops; exit signals for longs | Short when third closes below first's midpoint with volume |
| Harami Pattern | Medium — two-candle contained-body pattern | Trend context + confirmation; volume often decreases on second | Moderate reversal signal (55–65%) ⭐⭐⭐ | Scalping/swing on 4H+ charts; turning points | Wait for confirmation; Harami Cross is a stronger variant |
| Piercing Line Pattern | Medium — two-candle bullish reversal | Strong prior downtrend + volume on second candle | Strong bullish reversal when >50% penetration ⭐⭐⭐⭐ | Daily/weekly bottoms and support zones | Prefer second candle closing 50–75% into prior body with volume |
| Dark Cloud Cover Pattern | Medium — two-candle bearish reversal | Strong prior uptrend + volume on second candle | Strong bearish reversal when >50% penetration ⭐⭐⭐⭐ | Tops/resistance on daily/weekly charts | Require second candle to close significantly below midpoint with volume |
| Shooting Star | Simple — single top-reversal candle with long upper wick | Confirming bearish candle + resistance/volume | Bearish reversal warning; moderate reliability ⭐⭐⭐ | Resistance levels, round numbers, all timeframes | Wait for bearish confirmation and place stop above wick |
From Cheat Sheet to Trading Strategy
You now possess a powerful visual guide, your very own candlestick patterns cheat sheet, designed not just to be learned, but to be applied. We've dissected ten of the most essential patterns, from the decisive Hammer and Shooting Star to the complex narratives of the Morning and Evening Star formations. Each pattern tells a story of the market's internal struggle between buyers and sellers, offering clues that precede significant price moves.
However, the true value of this guide isn't in memorizing shapes. It lies in understanding the psychology behind them and integrating that knowledge into a coherent trading plan. The Engulfing pattern isn't just two candles; it's a sudden, violent shift in market sentiment. The Doji isn't just a cross; it's a moment of pure indecision and a potential turning point where the previous trend has run out of steam.
Key Takeaways: Beyond the Patterns
To transition from simply identifying patterns to trading them profitably, internalize these core principles we've discussed:
- Context is King: A Hammer pattern is meaningless in the middle of a choppy, directionless market. Its power is only unlocked when it appears at a significant support level after a clear downtrend. Always analyze the where and why a pattern forms.
- Confirmation is Non-Negotiable: A potential reversal pattern is just that, potential. You must wait for confirmation, whether it's the next candle closing in the anticipated direction or a break of a key structural level. Acting on an unconfirmed pattern is gambling, not trading.
- Confluence Creates Confidence: The most reliable signals occur when multiple factors align. A Bullish Engulfing pattern at a historical support zone, coinciding with a moving average crossover and a bullish divergence on an oscillator, is an A+ setup. Your goal is to find these points of technical confluence.
By moving beyond rote memorization, you begin to see the market not as a series of random wiggles but as a dynamic auction process. Each pattern in your candlestick patterns cheat sheet becomes a vocabulary word, allowing you to read the language of price action with greater fluency.
Actionable Next Steps: Building Your Trading Edge
Knowledge without application is useless. It's time to put this cheat sheet to work and build your practical skills.
- Chart Annotation: Go back in time on your trading platform. Pick a major currency pair or stock and start marking up every Hammer, Doji, and Engulfing pattern you can find. Note the context, whether it was confirmed, and what the market did next. This historical analysis is your training ground.
- Develop Your Rules: For two or three of the patterns covered, write down specific, objective rules for entry, stop-loss placement, and take-profit targets. For example: "For a Shooting Star, I will enter short only if it forms at a resistance level and the next candle closes below its low. My stop loss will be placed 10 pips above the Shooting Star's high."
- Demo Trading: Apply these rules in a demo account. The goal isn't to make hypothetical money but to execute your plan flawlessly and build the discipline required for live trading. Track your results in a journal, noting not just the outcome but also your emotional state during the trade.
Mastering these patterns is a foundational step toward becoming a discretionary price action trader. It moves you away from relying solely on lagging indicators and closer to understanding the real-time dynamics of supply and demand. This cheat sheet is your map, but you must walk the path through dedicated practice, disciplined execution, and continuous refinement.
Ready to elevate your understanding of price action beyond basic patterns? The principles of supply, demand, and market structure discussed here are the core of the professional trading strategies taught at Colibri Trader. Visit Colibri Trader to see how our comprehensive courses can help you integrate this candlestick patterns cheat sheet into a complete, rule-based trading system.