


A Trader’s Guide to the Candlestick Pattern Evening Star

The Evening Star is a classic three-candle pattern that screams "potential bearish reversal" from the top of an uptrend. Think of it as the market's sunset; a bright day of rising prices gives way to a moment of twilight and uncertainty, right before night falls with a decisive drop. For traders, it’s a critical flare warning that the bulls are losing steam and sellers might be about to take over.
Decoding the Market Sunset Signal
In the world of technical analysis, chart patterns aren't just squiggles on a screen. They're visual stories showing the raw battle between buyers and sellers. The Evening Star tells one of the most compelling stories: a clear psychological shift from bullish optimism to bearish pessimism. It’s a heads-up that a solid uptrend could be on its last legs.
This pattern is a cornerstone for price action traders because it provides a distinct, rule-based signal. Instead of relying on lagging indicators, the Evening Star gives you real-time insight into what the market is thinking. Its power lies in its structure.
Core Components of the Signal
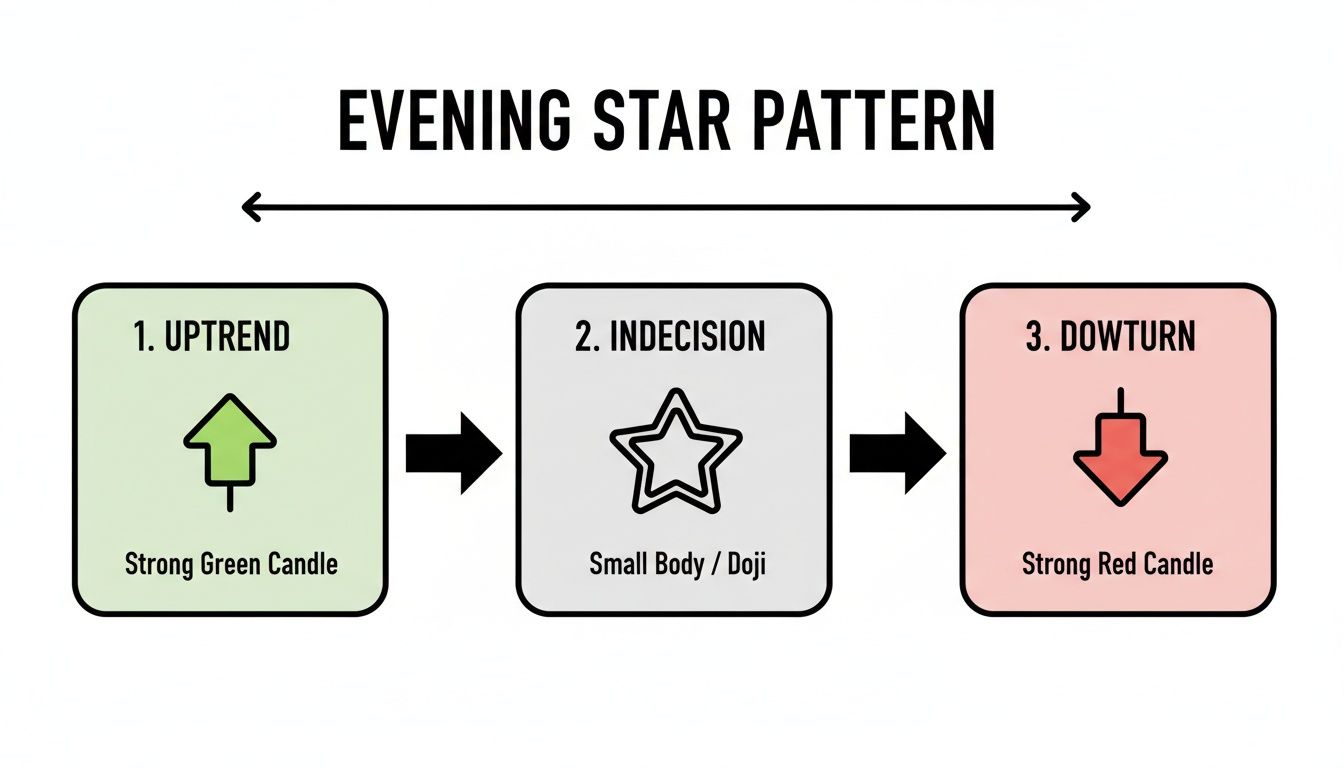
To really get this pattern, you have to see it as a three-act play. Each candle has a specific role in telling the story of the reversal:
- The Bullish Surge: The first candle is a big, strong bullish candle. This represents the last gasp of buyer confidence, pushing the established uptrend even higher.
- The Moment of Indecision: The second candle is the "star." It's a small-bodied candle that signals a pause. Buyers are suddenly not so sure of themselves, and the market hesitates.
- The Bearish Takeover: The third candle is a decisive bearish candle that closes deep into the body of the first candle. This is the confirmation—sellers have grabbed control.
This logical sequence is what gives the Evening Star its predictive punch. It's not just a random shape; it's a visual diary of power changing hands.
Here’s a quick breakdown to help you spot it faster.
Evening Star Pattern at a Glance
| Component | Description | Market Implication |
|---|---|---|
| Candle 1 | A strong, long bullish candle continuing the uptrend. | Bullish momentum is still in control. |
| Candle 2 | A small-bodied candle (the "star") that gaps up. | A pause or hesitation; buyers are losing conviction. |
| Candle 3 | A strong bearish candle closing below the midpoint of Candle 1. | Confirmation that sellers have taken over. |
This table neatly summarizes the transition from bullish euphoria to bearish reality, making it a powerful tool for anticipating trend changes.
The Evening Star isn't just a pattern; it's a visual representation of the market changing its mind. It captures that precise moment when confidence evaporates and sellers rush in.
Historical data backs this up. Studies by sources like LuxAlgo show that the Evening Star has a success rate of around 72% in forecasting bearish reversals across major markets. A number like that explains why traders sit up and pay close attention when this formation appears on their charts.
Ultimately, mastering the Evening Star is about more than just memorizing a shape. It’s about learning to read the market's story and understanding the subtle clues that come before major trend changes. As you get deeper into charting, you'll find that patterns like this are fundamental building blocks for any solid trading strategy. To broaden your knowledge, check out our comprehensive guide on Japanese candlestick patterns.
The Anatomy Of An Evening Star Formation
Understanding the Evening Star goes beyond a textbook label; it’s about reading minute shifts in trader sentiment like clues in a mystery. Each of the three candles tells us whether buyers still hold the reins or the bears are gearing up. Mastering these nuances helps you filter out noise and focus on high-probability reversals.
The chart below breaks the pattern into three clear chapters: the last bullish push, a flash of indecision, and the decisive bearish turn.
This visual strolls through trader psychology—from the uptrend’s climax to the momentary pause and, finally, to sellers seizing control.
Candle One: The Final Bullish Surge
The opening candle arrives with full conviction. A long real body and minimal wicks show buyers still driving the trend. Think of it as the last triumphant push before the tide turns.
Key Features:
- Long Real Body confirms strong buying pressure
- Small Wicks indicate little resistance to higher closes
- High Close well above the open cements bullish sentiment
Candle Two: The Star Of Indecision
This middle candle is the pattern’s namesake—a star of hesitation. Its small real body signals that buyers and sellers are on an uneasy truce. Often it gaps up from the prior close, hinting at a burst of enthusiasm that quickly fizzles.
Key Takeaway: This candle marks a stalling point. The uptrend’s momentum has officially paused, and neither side has clear control.
Common Variations:
- Spinning Top: Tiny body with upper and lower wicks, showing equal push and pull
- Doji: Open and close are nearly identical—the purest sign of indecision. Learn more in our guide What Is a Doji Candle?
- Small Bullish or Bearish Candle: The color matters less than the small body signaling fading momentum
Candle Three: The Bearish Confirmation
The final candle delivers the verdict: sellers have taken over. A robust bearish body closing below Candle One’s midpoint confirms a genuine reversal. The deeper it penetrates that initial candle, the stronger the bearish conviction.
Volume often spikes here, adding weight and showing broad participation in the new downtrend.
Backtesting Highlights:
- Timeframe: S&P 500 data from 1960–2023
- Penetration: Day-three close cuts into over 60% of Candle One’s body
- Performance: This classic Evening Star consistently outperforms simpler bearish setups—see the full research on Capital.com
Reading the Market Psychology Behind the Pattern
A candlestick pattern is much more than just a few bars on a chart. It’s a visual story of the constant battle between buyers (bulls) and sellers (bears). The Evening Star pattern is a particularly gripping tale because it captures a dramatic plot twist—a sudden, decisive shift in market power from the bulls to the bears.
Understanding this psychological narrative is what separates traders who just follow signals from those who can truly read the market's intentions.
Think of the pattern as a three-act play unfolding at the peak of an uptrend. Each candle represents a distinct chapter in the story, revealing the shifting emotions of traders. By breaking down this sequence, we can see exactly why this pattern is such a potent bearish signal.
Act One: The Climax of Optimism
The first candle of the Evening Star is a long, powerful bullish candle. This isn't just another green bar; it represents the final, explosive surge of optimism. Buyers are in complete control, pushing prices higher with confidence. The uptrend feels unstoppable.
This candle is the very definition of peak euphoria. Latecomers might be jumping in, driven by FOMO (fear of missing out), while those already long feel completely vindicated. At this point, any bearish thought has been pushed to the sidelines. The market looks like it has a one-way ticket to the moon.
Act Two: The Moment of Doubt
The second candle, the "star," is the turning point. It's a small-bodied candle that often gaps up, which at first glance suggests the bullish party is set to continue. But that small body reveals a critical shift: indecision.
Despite the initial gap up, buyers can't push the price significantly higher. The market essentially hits the brakes and stalls. This hesitation is the first crack in the bullish armor. Sellers start to tentatively test the waters, and the once-dominant buyers are suddenly unable to keep the rally going. It's a moment of equilibrium where the conviction that drove the uptrend simply evaporates.
The star candle acts like a traffic light turning from green to yellow. It's a clear warning that the unchecked bullish momentum has hit a major roadblock and a change in direction is now a very real possibility.
This pause is psychologically crucial. It plants a seed of doubt in the minds of the bulls and gives the bears a chance to regroup and plan their counter-attack. The market is holding its breath, waiting for the next move.
Act Three: The Bearish Takeover
The final act brings the dramatic conclusion. The third candle is a long, decisive bearish bar that opens lower and closes deep within the body of the first bullish candle. This is the confirmation—the power has officially shifted.
This candle represents a wave of selling pressure that completely overwhelms the buyers. The doubt that started with the star has now snowballed into widespread selling. Traders who bought near the top are now trapped and scrambling to cut their losses, adding even more fuel to the selling fire.
The sheer strength of this candle sends a clear message: sellers are now in command. The deeper this candle closes into the first candle's body, the more emphatic the rejection of higher prices is, and the stronger the bearish signal becomes. This completes the story of the Evening Star—a journey from euphoria, through crippling doubt, to a confirmed bearish reversal.
How to Trade the Evening Star Pattern
Spotting an Evening Star is one thing. Actually making money from it? That's a whole different ball game. Just seeing the pattern and jumping in without a plan is a quick way to lose capital. What you need is a structured, repeatable process.
This is your playbook for turning this powerful bearish signal into an actionable trade, covering everything from the precise entry trigger to managing your risk like a pro.
Think of it like a pilot's pre-flight checklist. Every step is there for a reason: to confirm the signal, minimize risk, and give your trade a clear destination. Skip the checklist, and you’re just flying blind.
Pinpointing Your Entry Point
The biggest mistake I see traders make is getting in too soon. An Evening Star isn’t a complete signal until that third bearish candle closes. Patience is everything here.
A solid, conservative entry trigger is to go short once the price breaks below the low of that third candle. This break is your final confirmation. It tells you the sellers have enough momentum to keep pushing the price down, validating the entire reversal pattern you've been watching.
If you enter any earlier, you're trading an incomplete pattern and taking on risk you don't need to. For more ideas on timing your trades, our guide on how to enter a trade covers some great techniques.
Setting a Protective Stop Loss
No pattern is foolproof. That’s why your stop-loss isn't optional—it's your safety net. It's what protects your capital when the market inevitably does something unexpected.
For the Evening Star, the most logical place to set your stop-loss is just above the high of the second candle (the "star"). This point was the peak of the bull's failed attempt to push higher. If the price breaks back above that level, the entire bearish idea is invalidated. That's your signal to get out and cap the loss.
Defining Your Profit Targets
Knowing when to take your profits is just as critical as knowing when to get in. A clear target ensures you actually bank your winnings before the market decides to turn around again.
Here are a few practical ways to set your targets:
- Key Support Levels: Look left on your chart for previous major price floors or swing lows. These are natural spots where buyers might step back in, making them perfect areas to take profit.
- Fibonacci Retracement: If the pattern formed after a long, sustained uptrend, try drawing Fibonacci levels. The 38.2% or 50% retracement levels often act as magnets for price and serve as excellent targets.
- Risk-to-Reward Ratio: This is about discipline. Aim for a target that gives you a healthy risk-to-reward ratio. For instance, if your stop-loss is 50 pips from your entry, your first target should be at least 100 pips away, giving you a clean 1:2 risk-reward.
Pro Tip: Don't get greedy. It's almost always a better idea to aim for the first major support level as your primary target. Trying to squeeze every last pip out of a move often results in giving back your hard-won profits.
The Power of Confirmation
The Evening Star is a solid pattern on its own, but its reliability skyrockets when other signals agree with it. Trading with "confluence"—stacking multiple reasons in your favor—is what separates amateurs from consistent pros.
Before you pull the trigger, scan for these confirming factors:
- High Volume on the Third Candle: A surge in volume on that big bearish third candle is a huge tell. It shows strong conviction and participation from the sellers.
- Formation at a Resistance Level: An Evening Star appearing at a major resistance zone, a key moving average, or a long-term trendline is infinitely more powerful. It’s like the market is screaming that sellers are taking control right where you'd expect them to.
- Bearish Divergence on an Oscillator: Glance at an indicator like the RSI or MACD. Is the price making a new high while the indicator is making a lower high? That's bearish divergence, a classic sign that the underlying bullish momentum is fading fast, which adds serious weight to the reversal signal.
Sidestepping False Signals and Common Traps
Let's be honest: the real world of trading is messy. Candlestick patterns rarely show up in their perfect, textbook form, and the Evening Star is no exception.
Learning to filter out the market noise and sidestep the usual traps is what separates traders who get whipsawed by false signals from those who can consistently find high-probability setups.
Think of yourself as a detective. You've spotted a prime suspect—the Evening Star—but you need to gather more evidence before you can be sure. Acting on an incomplete or flawed signal is one of the fastest ways to hurt your trading account. A top-tier setup needs more than just the right shape; it needs the right context.
This section is your field guide to building that discerning eye, helping you spot the subtle red flags that can turn a picture-perfect pattern into a losing trade.
The Low Volume Trap
One of the most common mistakes traders make is completely ignoring volume. A beautiful Evening Star that forms on weak or declining volume is a massive warning sign. It’s like hearing a lion's roar without seeing a lion—it might just be a recording.
For a reversal to have any real power behind it, it needs widespread participation from other traders.
- Weak Confirmation: If that third, big bearish candle forms on low volume, it’s telling you there’s very little conviction behind the sell-off. Sellers aren't stepping in with any real force, which makes the reversal far more likely to fizzle out.
- Strong Confirmation: On the flip side, a big spike in volume on that third candle is exactly what you want to see. It’s powerful proof that a significant number of market participants are aggressively selling, adding serious weight to the bearish signal.
Always glance at the volume bars below your price chart. An Evening Star that’s accompanied by a surge in selling volume on its third candle is a significantly higher-probability setup.
The Choppy Market Mirage
Context is everything in trading. The Evening Star is a reversal pattern, which means you should only trust it when it appears after a clear, established uptrend.
When you spot something that looks like an Evening Star in the middle of a choppy, sideways market, it’s not a valid signal. It's just noise.
In a range-bound market, price action is erratic and lacks direction. Patterns like this pop up all the time without leading to any meaningful move. Trading them is like trying to predict the next ripple in a bathtub—the movements are mostly random.
A true Evening Star needs a trend to reverse. Without one, it's meaningless.
Recognizing Subtle Variations
Textbooks show you the "perfect" pattern, but in live markets, you'll constantly run into variations. Knowing which ones are still valid and which ones to ignore is a critical skill.
Common Valid Variations:
- The Evening Doji Star: This is an even more potent version where the second candle is a Doji. A Doji represents pure indecision—a total standoff between buyers and sellers—making the subsequent bearish takeover even more significant.
- Overlapping Candles: Sometimes, the bodies of the three candles might overlap slightly. That's usually fine. As long as the core psychological story—bullish push, hesitation, strong bearish takeover—remains intact, the pattern is often still valid.
- The Failed Follow-Through: This is a major red flag to watch for after the pattern completes. If the very next candle after the third bearish bar is a strong bullish one, the pattern has likely failed. This tells you that buyers have immediately stepped back in to defend that price level, invalidating the entire bearish signal.
Seeing the Evening Star in the Wild: Real Chart Examples
Theory is one thing, but seeing a pattern play out on a live chart is where the real learning happens. This is how you forge a trader’s instinct. By analyzing the Evening Star candlestick pattern in real-world scenarios, you'll start to internalize the rules, understand the entries, and get a feel for managing the risk.
Think of each chart as a story about a battle between buyers and sellers—and in these cases, the sellers won decisively. Let's dig into a few examples from different markets to see what these high-probability setups look like in their natural habitat.
Stock Market Example: Apple Inc. (AAPL)
You can often find clean, textbook patterns on major tech stocks like Apple, mainly because so many eyes are watching them and the liquidity is sky-high. In this case, an Evening Star appeared on the daily chart right after a long, grinding uptrend.
It was a picture-perfect setup:
- Context: The pattern didn't just appear out of nowhere. It formed right at a key historical resistance level—a price ceiling where sellers had stepped in before.
- The Pattern: First came a strong, confident bullish candle. It was followed by a small spinning top (the "star"), screaming indecision after the long run-up. Then came the knockout punch: a powerful bearish candle that closed deep into the body of the first candle, confirming sellers were now in complete control.
- Confirmation: The volume on that third candle was noticeably higher than the days prior, adding another layer of proof to the reversal.
- The Result: Once the pattern completed, the price rolled over and began a significant downtrend. For traders who recognized the signal, it was a prime shorting opportunity.
This AAPL chart drives home a crucial lesson: The most potent Evening Star patterns pop up at pre-existing areas of major resistance. The location of the pattern is often just as critical as the pattern itself.
Forex Market Example: EUR/USD
The forex market is famous for its powerful trends, which makes it another great hunting ground for reversal patterns like the Evening Star. On the 4-hour chart of EUR/USD, a classic Evening Star marked the exhausted peak of a strong bullish rally.
Here’s how a trade could have played out:
- The Trend: The pair was in a clear uptrend for several days, consistently printing higher highs and higher lows. Buyers were in charge.
- The Signal: An Evening Star formed, but with a twist. The second candle was a perfect Doji, showing absolute equilibrium and confusion at the top. This is known as an Evening Doji Star, an even stronger variation of the pattern.
- The Entry: A trader could have placed a short entry as soon as the price broke below the low of the third bearish candle, confirming the downward momentum.
- The Stop-Loss: A logical spot for a stop-loss would be just a few pips above the high of the Doji star, protecting the position from a failed reversal.
- The Target: An initial profit target could be set at the most recent swing low created during the prior uptrend.
This forex example shows just how versatile the pattern is, working across different asset classes and timeframes. It also shows how a small variation, like the Doji star, can give you that much more conviction in a trade.
By studying these real charts, you start to move beyond simply memorizing a pattern. You begin to think like a professional trader—assessing context, demanding confirmation, and managing risk with every single setup.
Frequently Asked Questions
Let's tackle some of the most common questions that pop up when traders start working with the Evening Star candlestick pattern. Getting straight answers to these practical points can really help cement your understanding and give you the confidence to use the pattern effectively.
What Is the Success Rate of the Evening Star Pattern?
Historically, the Evening Star is a pretty reliable pattern. In my experience and through various backtests, it tends to show a success rate of around 72% in calling bearish reversals, especially in liquid markets like major stocks and forex pairs.
But here's the key: you should never trade it in a vacuum. Its real power is unleashed when you have other technical factors backing it up.
- High Volume: A big spike in selling volume on that third candle? That adds some serious weight to the signal.
- Key Resistance: When the pattern forms right at a major historical resistance level, it's a much more powerful sign.
- Indicator Divergence: Seeing a bearish divergence on an oscillator like the RSI at the same time is a fantastic layer of confirmation.
Does the Evening Star Pattern Work on All Timeframes?
Yes, absolutely. The Evening Star is one of those universal patterns that you'll spot on everything from a 5-minute chart all the way up to the weekly or monthly. The psychology it represents—that shift from bullish confidence to bearish takeover—is the same no matter the timeframe.
Key Takeaway: While you can find it anywhere, patterns on higher timeframes (like the daily and above) carry a lot more weight. They represent a much larger, more significant shift in market sentiment and usually lead to bigger, more sustained moves.
How Is the Evening Star Different From a Bearish Engulfing Pattern?
Both patterns scream "bearish reversal," but they tell slightly different stories about the market's psychology. A Bearish Engulfing pattern is a quick, two-candle knockout punch. A huge bearish candle completely swallows the previous bullish one, showing an abrupt and brutal shift in power.
The Evening Star, on the other hand, is a three-candle story that shows a more gradual, and you could argue more detailed, transition. That little "star" candle in the middle is your early warning sign—it shows indecision and stalling momentum before the big, decisive bearish candle confirms the reversal.
Ready to stop relying on confusing indicators and master pure price action? At Colibri Trader, we teach a straightforward, effective approach to trading. Unlock your trading potential with our proven strategies today.