


A Trader’s Guide to the Candlestick Gravestone Doji
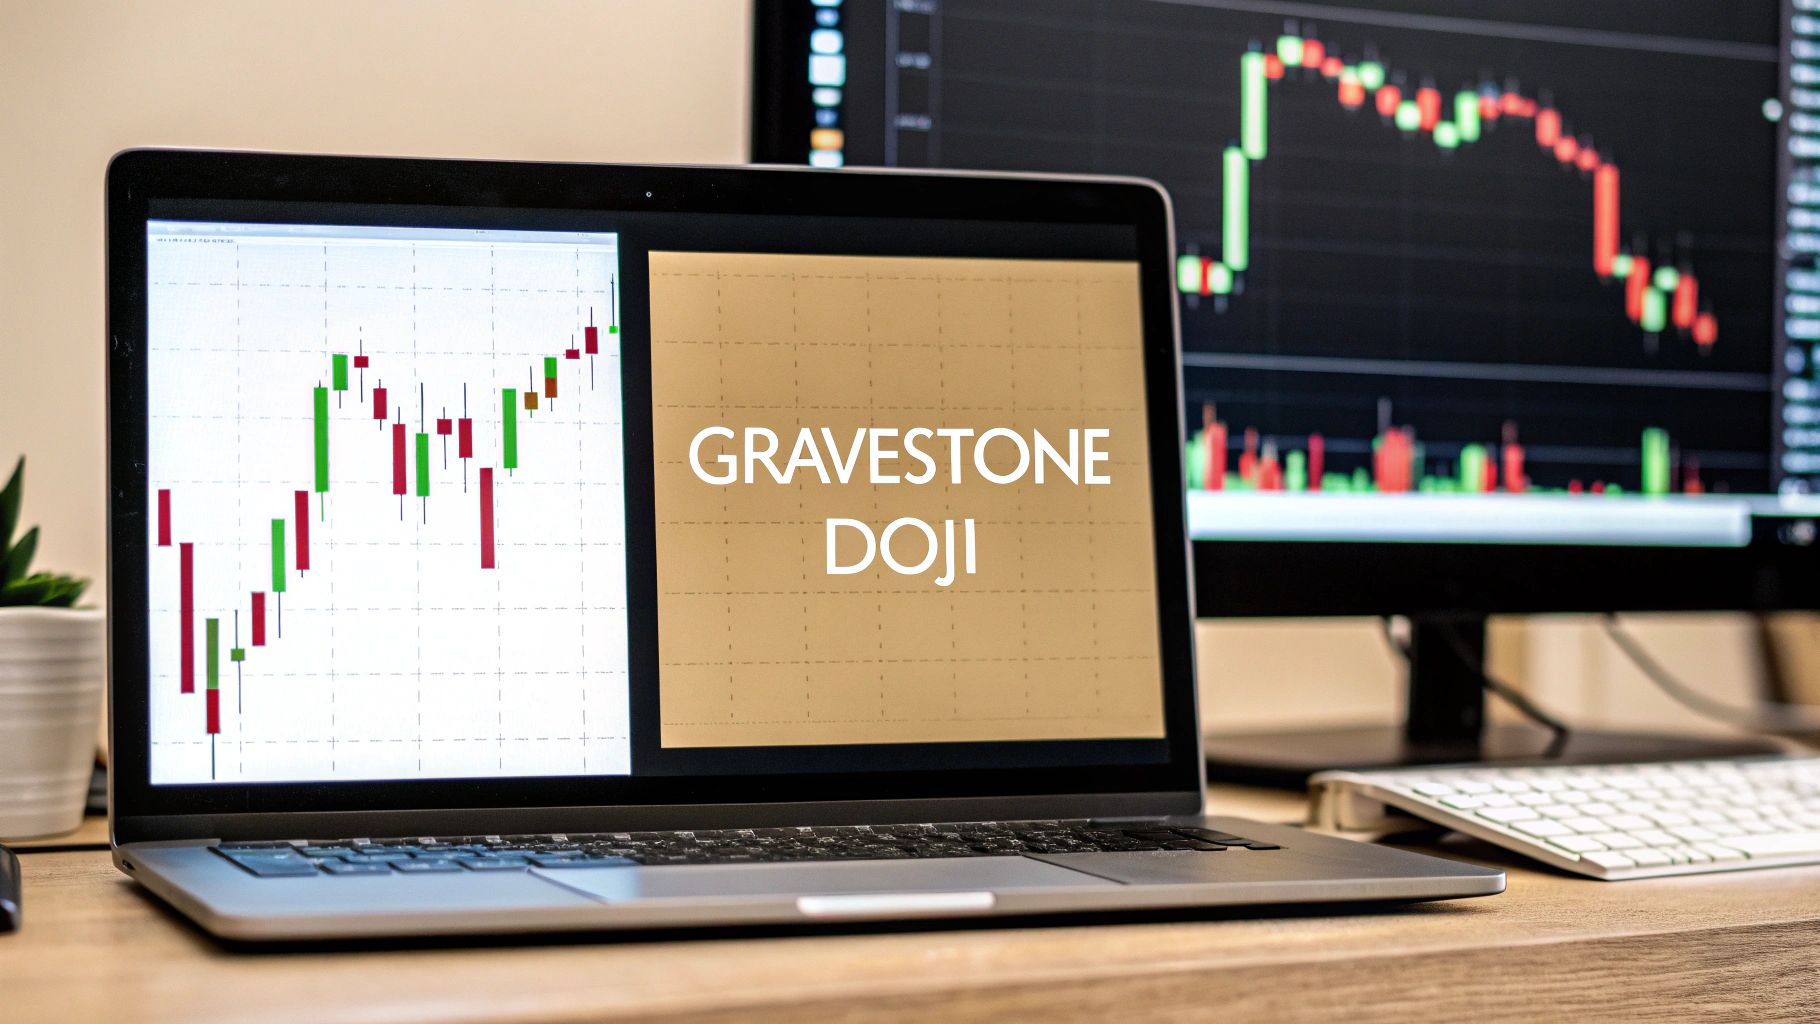
When you see a Gravestone Doji candlestick on a chart, it's a powerful bearish signal that a top might be forming in an uptrend.
Picture this: buyers initially shove prices way up, full of confidence. But then, sellers storm the gates, seize total control, and slam the price right back down to where it started. What's left is a distinct inverted 'T' shape—a stark warning to traders that the bullish party might be over.
What Is a Gravestone Doji Candlestick
The Gravestone Doji tells a dramatic, single-session story of a market battle where the bears walk away as the undisputed champs.
Think of it like a tug-of-war. The session opens, and the optimistic bulls grab the rope, yanking prices higher and higher. This upward pull creates that long upper shadow, or "wick," and represents their all-out effort to keep the uptrend running.
But at the peak of the session, the tables turn—hard. Sellers (the bears) flood the market with overwhelming force. They don't just stop the bulls' advance; they aggressively drive the price all the way back down. By the time the session closes, they've wiped out every bit of the bulls' progress, forcing the close to be at or extremely close to the open and the low.

The Anatomy of the Signal
This intense struggle leaves behind a candlestick with very specific traits. Getting a handle on these components is the first step to spotting this potent signal. Of course, before you can identify specific patterns, you need a solid grasp of the basics of how to read crypto charts, as this knowledge is the foundation of any good technical analysis.
The key features of a true Gravestone Doji are pretty straightforward:
- Minimal to No Real Body: The open, low, and close prices are all virtually the same. This creates what looks like a thin horizontal line at the very bottom of the candle's range.
- Long Upper Shadow: This wick needs to be noticeably long. It’s the visual proof that bulls made a serious, but ultimately failed, attempt to push prices higher.
- Little to No Lower Shadow: There’s almost no price action below the open. This reinforces the idea that the day's battle was fought and lost entirely at the session highs.
To make these characteristics easier to remember, here’s a quick summary table.
Key Characteristics of a Gravestone Doji
| Component | Description | Market Implication |
|---|---|---|
| Real Body | Almost non-existent; open, low, and close are nearly identical. | Extreme indecision, with the session ending in a stalemate at the low. |
| Upper Shadow | Very long, representing the majority of the session's trading range. | Bulls attempted a rally but were decisively rejected by sellers. |
| Lower Shadow | Non-existent or extremely short. | Sellers maintained control, preventing any price drops below the open. |
| Psychology | A failed rally; buyers lost control to sellers at the session's peak. | Signals a potential shift in momentum from bullish to bearish. |
This table neatly lays out what you're looking for visually and what it means for market psychology—a strong rejection of higher prices.
Historical Roots and Meaning
This pattern isn't some new-fangled indicator; its roots run deep. The Gravestone Doji goes all the way back to 18th-century Japan, where the legendary rice trader Munehisa Homma first developed candlestick charting.
Its name is fittingly morbid, coming from its resemblance to a tombstone. It poetically symbolizes the "death" of an uptrend.
At its core, the Gravestone Doji is a clear visual warning. It shows a complete failure by buyers to hold onto higher ground and a powerful takeover by sellers. While it's technically a form of indecision, as you can learn in our guide on what is a doji candle, it carries a heavy bearish bias, strongly hinting that market sentiment is souring.
The Market Psychology Behind the Pattern
That simple inverted 'T' shape tells a dramatic, often violent, story about a single trading session. It's more than just a pattern; it’s a snapshot of a fierce battle between buyers and sellers, showing a sudden and decisive shift from greed to fear.
Picture this: the session kicks off with incredible bullish confidence. The market's been trending up, and the buyers (the bulls) feel completely in charge. They start pushing prices higher and higher, setting new session highs and creating a wave of euphoria for anyone who's long. This initial buying frenzy is what carves out that long upper shadow.

The Battle for Control
But right at the peak of this charge, something snaps. Sellers (the bears), who might have been lying in wait at a key resistance level or just felt the price was getting way too stretched, storm the market with overwhelming force. They don't just soak up the buying pressure—they completely steamroll it.
This sudden flood of selling triggers a panic. The same bulls who were buying confidently just moments before are now trapped at terrible prices. As the price plummets back toward the opening level, these trapped traders have to dump their positions to cut their losses, which just pours more fuel on the selling fire.
The Gravestone Doji isn't just a moment of indecision; it's a clear signal of bullish exhaustion. It represents a session where buyers gave it their all, hit a peak, and were smacked down hard by a stronger selling force.
This brutal rejection of higher prices is the core message of the pattern. By the end of the session, every single gain has been wiped out. The price closes right back where it started, leaving behind a "gravestone" that marks the high point of that failed rally.
The Transfer of Power
What you're left with is a clear sign that power has shifted from the buyers to the sellers. This is exactly why truly understanding what is market sentiment is so critical for any price action trader. The Gravestone Doji shows that sellers have successfully defended their territory and seized control, at least for that session.
This one candle tells you several things about the market's mindset:
- Bullish Failure: The buyers ran out of gas and couldn't hold the higher ground.
- Bearish Dominance: The sellers showed up with enough muscle to erase an entire session's worth of gains.
- Trapped Traders: A lot of traders who bought near the high are now underwater and feeling the pain.
This psychological story is what gives the Gravestone Doji its predictive punch. It’s a stark warning sign that the uptrend is in trouble and the bears are now in a position of strength, possibly signaling the start of a serious move lower.
How to Accurately Identify a Gravestone Doji
Spotting something that looks like a Gravestone Doji is easy. Knowing if it's a real, tradeable signal is a completely different ballgame. Not every long-legged, inverted 'T' on your chart is worth your attention. To separate the high-probability signals from the fakes, you need a sharp eye and a strict set of rules.
A genuine Gravestone Doji has two unmissable features. First, it has a tiny body—or none at all. This means the open, low, and close prices are all stacked right on top of each other, creating that flat line at the bottom of the candle.
Second, that long upper shadow isn't just a small wick; it needs to be pronounced. It tells a clear story of buyers trying to stage a major rally, only to get slammed back down by sellers before the session closed.
The Litmus Test: Location And Context
Here's the most important part: a Gravestone Doji floating aimlessly in the middle of a choppy, sideways market means next to nothing. Its power comes from where it shows up.
Think of it like a "Danger: Cliff Ahead" sign. That sign is useless on a flat, straight highway, but it's critical when you're driving up a mountain. In the same way, a candlestick gravestone doji is a powerful warning sign when it appears at the peak of a strong, established uptrend. It’s the market screaming that the bullish party just hit a brick wall.
The predictive power of a Gravestone Doji goes through the roof when it forms right at a known resistance area. This could be a previous swing high, a major moving average, or a key Fibonacci level.
When a Gravestone forms at one of these critical levels, it's not just a one-off moment of indecision. It’s a powerful rejection of price exactly where sellers were expected to show up in force. This confluence of signals is what turns a simple pattern into a high-odds reversal setup.
Validating the Signal with Data
The numbers back this up. Looking at S&P 500 daily charts from 1993-2023, a study found that 62% of Gravestone Dojis resulted in downside moves of over 2% within 10 days. That’s a real edge compared to a random 45% chance.
Even better, in ideal setups—where the Gravestone is preceded by two green candles and confirmed by a red candle right after—the success rate jumps to an impressive 71%. You can dig deeper into these Gravestone Doji candlestick pattern statistics yourself.
This is exactly why sticking to the rules is so critical. A properly identified Gravestone, appearing in the right context, isn't just another shape on the chart. It's a statistically proven signal that deserves your full attention.
Confirming the Signal to Avoid Trading Traps
Spotting a lone candlestick gravestone doji is a powerful warning shot from the market. But let's be clear: it's not a direct command to sell or short. One of the biggest traps new traders fall into is treating it as an isolated, standalone signal. That's a quick way to get chopped up by false positives.
A professional trader sees it as a flashing yellow light. It means "pay attention, something is changing." It demands patience and, most importantly, confirmation before you even think about putting capital at risk.
So, how do we get that confirmation? The most reliable proof comes from what happens next. We need to see the very next candlestick validate our suspicion.
If the candle that forms immediately after the Gravestone Doji is bearish—meaning it closes below the low of the Doji—that's our confirmation. It’s the market telling us that sellers didn't just win a small skirmish; they've taken control and are now actively pushing prices down. This confirmation candle is the evidence we need to believe the reversal has truly begun.
Using Volume for an Extra Layer of Proof
Volume is another crucial piece of the puzzle. A Gravestone Doji that appears on a spike of significantly higher-than-average trading volume is a much bigger deal. Why? Because high volume means a huge number of participants were involved in that battle at the peak. The sellers' victory wasn't a quiet affair; it was a decisive and meaningful rout.
Think of it like this: a quiet rejection of a price level is interesting. But a loud, high-volume rejection is a statement. It signals a strong, committed shift in market sentiment. On the flip side, a Gravestone Doji that forms on low volume is far less convincing. It could just be market noise, not a genuine reversal signal.
This decision tree breaks down the simple, yet critical, process for confirming the signal before you act.
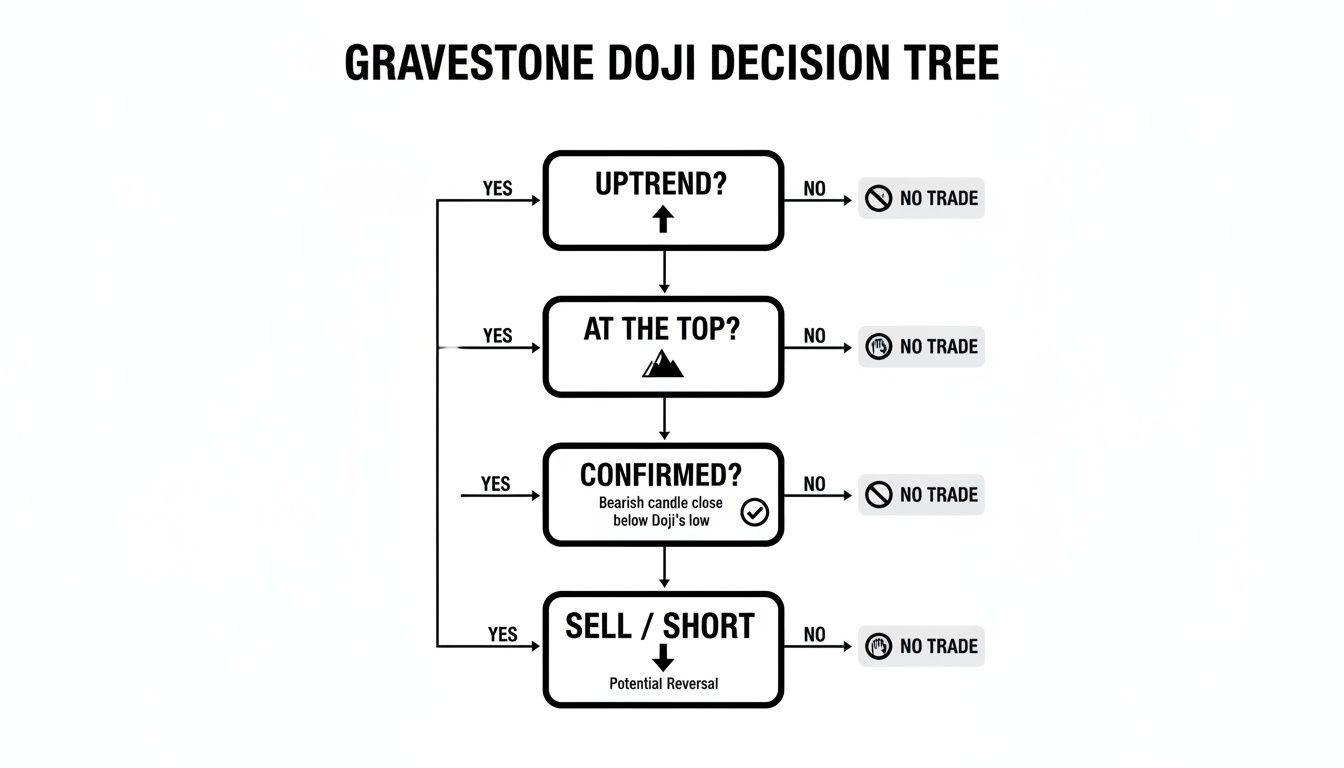
The key takeaway is that the pattern is only potent when it shows up in the right place—at the top of an uptrend—and is backed up by what the price does next.
Adding Technical Indicators to Your Arsenal
Technical indicators can help you build an even stronger case for a reversal. When you spot a Gravestone Doji, take a quick look at an oscillator like the Relative Strength Index (RSI). If the RSI is screaming "overbought" (typically a reading above 70), it suggests the uptrend was already running on fumes and was vulnerable to a pullback.
An even more powerful signal is bearish divergence. This is when the price pushes to a new high (forming our Gravestone Doji), but the RSI makes a lower high. This discrepancy is a huge red flag. It shows that the momentum driving the price up is fading fast, adding serious credibility to the bearish reversal signal.
When you combine a clean candle pattern with a clear divergence signal, you've got a high-probability setup on your hands. Ultimately, any pattern is most effective when it forms near a key price level. For more on this, you can learn how to identify support and resistance to further refine your analysis.
Getting Practical: How to Actually Trade the Gravestone Doji
Spotting a candlestick gravestone doji is one thing. Having a rock-solid plan to trade it is something else entirely. This is where we stop staring at charts and start building a disciplined framework for getting in, managing risk, and getting out. Without a plan, you're just guessing.
First things first: patience. Once you've identified a clean Gravestone Doji at the top of a rally, you don't jump in right away. You wait for proof. The classic entry trigger is to place your short (sell) order after the very next candle closes firmly below the low of the Doji itself. This extra candle tells you the sellers who showed up at the peak weren't a fluke—they have follow-through.
Defining Your Entry and Exit Points
Once that confirmation candle closes, it's time to define your risk. This is non-negotiable. Your stop-loss order goes just a few ticks above the high of the Gravestone Doji's long upper shadow. Why there? Because that peak is where sellers first slammed the brakes on the buyers. If the price breaks above that level, the entire bearish idea is wrong, and you want to be out of the trade immediately.
With your escape hatch set, you can think about the fun part: profits. A realistic profit target is just as critical as your stop-loss. Don't just pick a random number; look for logical places on the chart where the falling price might hit a speed bump.
- Previous Support Levels: Where did the price bounce up from on its way to the top? That old swing low or consolidation zone is a magnet for buyers.
- Major Moving Averages: Big-boy moving averages sitting below the price (like the 50-day or 200-day) often act like a floor. Traders are watching them.
- Fibonacci Extensions: If you're comfortable with them, Fibonacci tools can project potential downside targets based on the size of the prior uptrend.
A disciplined trading plan isn't about finding the perfect entry. It's about knowing your maximum pain point (stop-loss) and your realistic goal (profit target) before you even click the sell button.
A Quick Hypothetical Trade
Let's walk through a simple scenario. Imagine a stock has been ripping higher and prints a Gravestone Doji right at a known resistance level of $105. The absolute high of that Doji's shadow is $106.
- Confirmation: The next candle is a big red one, closing at $104, well below the Doji's low. That's our green light.
- Entry: You enter a short position right around that $104 close.
- Stop-Loss: You immediately place a stop-loss order at $106.10, just a bit above the Doji's peak to avoid getting wicked out.
- Profit Target: Looking left on the chart, you see the last major bounce happened at $98. That becomes your primary target to take profits.
This is how you turn a simple pattern into a complete, actionable trade with a clear risk-to-reward profile. Statistical analysis across thousands of backtests shows that the Gravestone Doji's bearish accuracy can hit 65% with proper confirmation, especially when it forms on high volume. For a deeper dive into the numbers, check out the Doji pattern performance data on Strike.money. By sticking to a repeatable plan, you put those statistical odds in your favor.
Putting Theory Into Practice: Real-World Gravestone Doji Examples
It's one thing to read about a candlestick pattern, but seeing the Gravestone Doji pop up on a live chart is where the rubber really meets the road. When you can spot these signals in the wild and understand the story they're telling, you start building the kind of confidence that's essential for real-time trading.
Let's dive into a few examples and see how this powerful bearish reversal pattern actually behaves in different markets.
A classic Gravestone Doji setup usually unfolds like this: you've got a clear uptrend, and then the doji appears right at a peak or a known resistance level. But the pattern itself is just the warning shot. The real confirmation comes from what happens next—typically a big, bold bearish candle that closes below the doji's low. That's your sign that sellers have wrestled control away from the bulls.
A Stock Market Reversal In Action
The stock market is littered with examples of the Gravestone Doji doing its thing. A picture-perfect case unfolded recently in the Indian market with Sail (Steel Authority of India Limited). After a powerful 25% uptrend, the stock printed a textbook Gravestone Doji right at the top.
The session opened at 95.35 INR, ripped higher to a peak of 98.30 INR, but then the sellers came in with overwhelming force. They completely crushed the rally, pushing the price all the way back down to close right where it started at 95.35 INR. This was a classic rejection. What followed was a swift 15% plunge over the next two weeks, perfectly illustrating the pattern's predictive power. You can see a full breakdown of this Doji pattern case study on Strike.money.
Dissecting A Forex Chart Example
Now, let's switch gears to the fast-moving world of forex, where these patterns are just as potent.
- The Setup: Picture the EUR/USD pair chugging along in a steady daily uptrend. It's approaching a major psychological resistance level, let's say the big round number of 1.1000.
- The Signal: Right as it kisses that resistance, a Gravestone Doji forms. This tells us buyers made a valiant push to break through that key level, but they were swatted down decisively.
- The Confirmation: The very next day, a strong bearish candle appears, closing well below the doji's low. This is the green light.
This setup is a trader's dream because it's a confluence of signals. You have a clear pattern (the Gravestone Doji) appearing at a significant area of resistance (1.1000), followed by clear bearish confirmation. This offered a high-probability short entry. A smart trader could have placed a stop-loss just a few pips above the doji's high and aimed for a previous support level to take profits, capturing the resulting reversal.
Clearing Up Common Gravestone Doji Questions
Even after you get the hang of this pattern, a few questions always seem to pop up. Let's tackle them head-on to clear up any lingering confusion and really cement the core ideas.
What’s the Difference Between a Gravestone Doji and a Shooting Star?
This is a great question, and it trips up a lot of traders. They look almost identical and both scream "bearish reversal," but the devil is in the details—specifically, the real body.
A Gravestone Doji has virtually no real body. The open, low, and close are all stacked on top of each other. This shows a complete stalemate right at the session's low point. A Shooting Star, on the other hand, has a small but noticeable real body at the bottom of the candle.
Think of it this way: while both patterns show that sellers aggressively rejected higher prices, the Gravestone Doji signals a more dramatic failure by the bulls and a deeper level of market indecision. It’s a slightly purer, more intense signal of exhaustion.
Does a Gravestone Doji Work in a Downtrend?
In a word: no. This pattern completely loses its meaning and predictive power in a downtrend.
The whole point of a Gravestone Doji is that it appears at the top of a sustained uptrend. That's where it gets its power—signaling that the buying frenzy has run out of steam and a reversal is likely.
If you spot this shape smack in the middle of a downtrend, it’s not a reversal signal. It's just a brief pause, a moment of indecision before the trend likely continues downward. Context is everything in trading; for this pattern to mean anything, it must show up after a clear move up.
Which Timeframe Is Best for This Pattern?
You can find a Gravestone Doji on any chart, from a one-minute scalping setup to a weekly overview. But as a rule of thumb, its reliability skyrockets on higher timeframes.
A Gravestone Doji on a daily or weekly chart tells a much bigger story. It reflects the collective psychology of thousands of traders over a long period, filtering out all the intraday noise. This makes the reversal signal far more robust and often points to a major, more sustainable shift in the market's direction.
At Colibri Trader, we teach you to master price action and trade with confidence, free from confusing indicators. Our action-based programs provide the clear, practical skills you need to achieve consistent results in any market. Discover your trading potential by visiting us at https://www.colibritrader.com.