


A Trader’s Guide to Candlestick Forex Patterns
Candlestick forex patterns are visual stories that show you the constant tug-of-war between buyers and sellers. These patterns, built from one or more candlesticks, are a core part of price action trading, helping traders get a feel for market sentiment and spot potential turning points.
Learning the Language of Forex Charts
Trying to trade off a chart without understanding candlesticks is like listening to a conversation in a language you don't speak. You see things happening, but you have no idea what they mean.
Each candle and pattern is a word, translating the complex battle between the bulls (buyers) and bears (sellers) into a simple, visual story. These aren't just random shapes on your screen; they're the language of market psychology.
Interestingly, this powerful method isn't some modern, computer-driven invention. Candlestick patterns actually came out of 18th-century Japan. A brilliant rice trader named Munehisa Homma developed them to get a more intuitive grasp of price movements. His techniques were a closely guarded secret for a long time before finally making their way to the West in the 20th century, where they became essential to technical analysis.
By learning this language, you can start to see the emotions driving the market—like greed, fear, and indecision—that a simple line chart could never show you.
The Anatomy of a Single Candlestick
Before you can make sense of the bigger patterns, you have to understand the building blocks. Every single candlestick is made of four key pieces of information, telling a complete story for that specific period, whether it’s a minute, an hour, or a full day. To really get the big picture, you first need to learn how to read candlestick charts on this micro level.
Here’s a quick rundown of what makes up each candle.
| Anatomy of a Candlestick | |
|---|---|
| Component | What It Represents |
| The Body | The range between the opening and closing price. A green (or white) body signifies a bullish period where the price closed higher than it opened. A red (or black) body is bearish, meaning the price closed lower. |
| The Upper Wick | The thin line above the body, marking the highest price reached during the period. Also called the upper shadow. |
| The Lower Wick | The thin line below the body, marking the lowest price reached during the period. Also called the lower shadow. |
| The Color | Instantly shows the directional outcome. Green/White = Bullish. Red/Black = Bearish. |
Thinking about these components helps you see the story within each candle.
-
The Body: This is the main, rectangular part of the candle. It shows you the net result of the battle for that period. A green body means the bulls won, and a red one means the bears took control.
-
The Wicks (or Shadows): These are the thin lines poking out from the top and bottom of the body. They represent the extremes—the highest and lowest prices hit before the period closed. Long wicks are a huge clue, often pointing to volatility and a struggle for control.
The real power of candlestick patterns is their ability to translate raw price data into a visual narrative. A long upper wick, for instance, tells you buyers tried to rally and push prices higher, but sellers fought back hard and pushed the price back down by the close. It’s a story of a failed bullish attack.
Grasping these individual parts is the absolute foundation. They are the letters of the alphabet you need to know before you can read the more complex, multi-candle patterns we’ll explore next. They provide critical clues about who’s running the show in the market.
Identifying Bullish Reversal Patterns
Picture a long, relentless downtrend. The market feels heavy, and sellers are clearly in the driver's seat. Bullish reversal patterns are the very first clues that this downward momentum is starting to run out of steam. Think of them as the market quietly hinting that the balance of power is about to shift.
Spotting these formations early can give you a real edge. It’s your chance to get positioned for a potential buy just as the sellers start getting exhausted and the bulls begin to wake up. These candlestick forex patterns are the footprints left behind by this changing of the guard.
But context is everything. A bullish reversal pattern is only meaningful if it shows up after a clear, established downtrend. A perfect Hammer appearing in the middle of a choppy, sideways market doesn't carry the same weight. It needs that preceding bearish move to tell its story.
To really get a feel for these patterns, you have to understand what a candlestick is actually telling you. This image breaks it down beautifully.
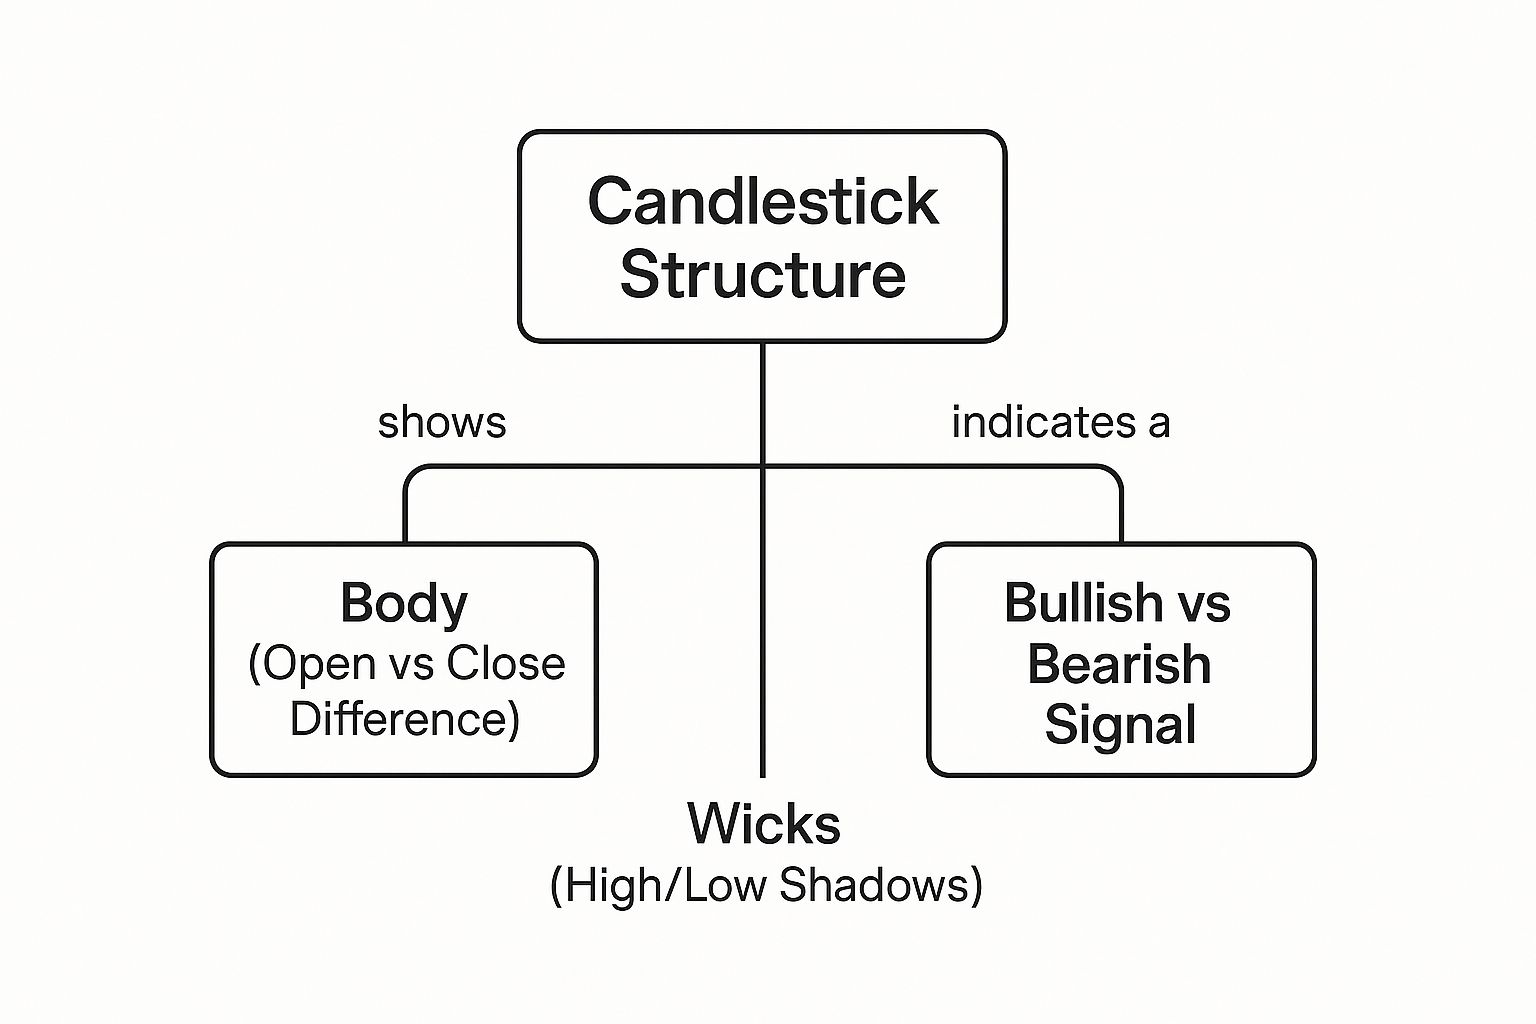
The body shows you who won the battle for that session, while the wicks (or shadows) reveal the emotional extremes—how far fear pushed the price down or how far greed pushed it up.
The Hammer: A Symbol of Rejection
The Hammer is one of the most classic single-candle signals for a bullish reversal. It's easy to spot because it looks exactly like its name: a small body perched at the top of a long lower wick, with little to no upper wick.
The story this candle tells is powerful. It shows that during the session, sellers managed to push the price way down, continuing the existing downtrend. But then, the buyers stepped in with conviction. They aggressively rejected those lower prices and drove the price all the way back up to close near where it opened.
The long lower wick is the most critical part of a Hammer. As a rule of thumb, it should be at least twice the size of the candle's body. That long shadow is a visual sign of a strong rejection of lower prices—a clear signal that bulls are finding their footing.
Remember, for a Hammer to be a valid signal, it must appear after a downtrend. While a green-bodied Hammer is considered slightly more bullish, the color is less important than its shape and, most importantly, its location on the chart.
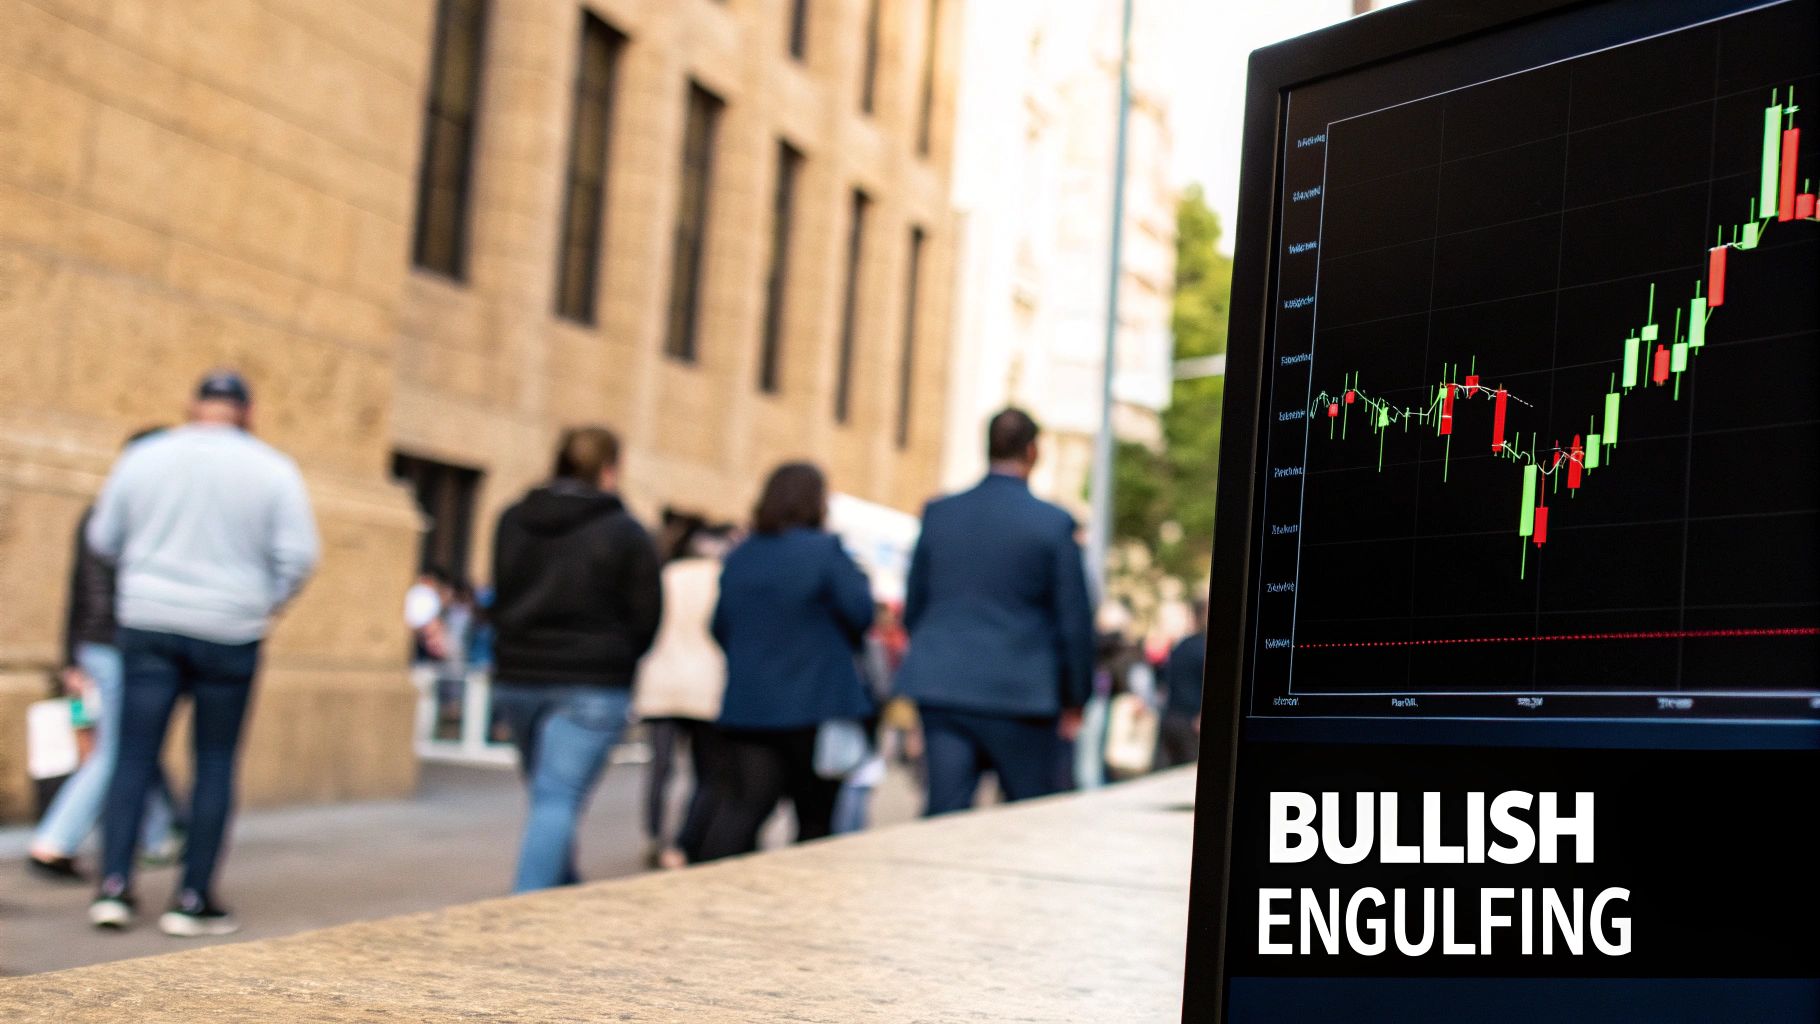
The Bullish Engulfing Pattern: A Total Takeover
If the Hammer is a story of rejection, the Bullish Engulfing pattern is a story of a complete and hostile takeover. This is a very strong two-candle reversal signal that's hard to ignore.
It forms when a small bearish candle is immediately followed by a large bullish candle that completely "engulfs" the body of the prior candle. This means the big green candle opens lower than the previous day's close and closes higher than its open.
What’s the market psychology here?
- Bears are still in control: The first small red candle suggests the downtrend is continuing as usual.
- Bulls launch a surprise attack: The second candle opens, and buyers don't just stop the bleeding—they reverse all of the previous session's losses and then some, pushing prices much higher.
- A decisive shift in power: This dramatic price action shows that the sellers have completely lost control. The bulls are now calling the shots.
It's a clear, visual representation of a major momentum shift. The bigger the engulfing candle is in relation to the previous one, the more powerful the signal. For a deeper dive, many excellent guides on candlestick patterns in forex can provide even more nuance on patterns like this.
The Morning Star: Hope on the Horizon
The Morning Star is a three-candle pattern that acts like a sign of hope for the bulls, much like its namesake star appears just before the sun rises. It suggests a bottom might be in place after a dark period of selling.
This pattern plays out in three distinct acts:
- The Large Bearish Candle: The first candle is long and red, confirming the downtrend is still in full force. The bears are confident.
- The Small Indecision Candle: The second candle is a small-bodied candle (like a doji or spinning top) that ideally gaps down from the first. This "star" represents indecision. The sellers are losing their nerve, but buyers haven't seized control just yet. It's a pause in the action.
- The Large Bullish Candle: The third candle is a strong, green candle that closes deep into the body of the first day's bearish candle. This is the confirmation that the bulls have taken over and the reversal is on.
The Morning Star is so highly regarded because it doesn't just show a sudden reversal; it shows a gradual but decisive transfer of power from sellers to buyers. This makes it a very reliable indicator of a potential new uptrend.
Recognizing Bearish Reversal Patterns
For every move in the market, there’s usually an opposite reaction waiting just around the corner. While bullish patterns can signal that a downtrend is losing steam, bearish reversal patterns are your flashing red light, warning you that a strong uptrend might be running out of gas.
Think of these formations as the market tapping you on the shoulder to say, “The party might be ending soon.”
Learning to spot these signals is an essential skill for any serious trader. They don’t just flag potential shorting opportunities; they also help you protect your profits on long positions by telling you when it might be time to get out. These bearish candlestick forex patterns pop up when the balance of power starts to tip away from the buyers and towards the sellers.
Like their bullish cousins, the power of these patterns comes from their context. A bearish signal is only truly meaningful when it appears after a sustained uptrend. Spotting a Shooting Star during choppy, sideways price action means very little. Seeing one form at a brand new high after a long rally? That's a different story entirely. The prior trend is what gives the reversal pattern its meaning.
The Shooting Star: A Failed Bullish Assault
The Shooting Star is a potent, single-candle bearish reversal pattern. Its look is unmistakable: a small body at the bottom of the candle, a very long upper wick, and almost no lower wick. It really does look like a star falling back to earth, a fitting image for the story it tells.
This pattern reveals a dramatic battle within a single trading session. The long upper wick shows that, for a moment, buyers were in complete control, pushing prices significantly higher and trying to continue the trend. But this surge was met with overwhelming selling pressure. The bears stepped in aggressively, rejecting those higher prices and shoving the price all the way back down to close near its open.
A valid Shooting Star tells a story of pure buyer exhaustion. The bulls made one last, powerful push to drive the market higher, but they failed spectacularly. That long upper wick—which should be at least twice the length of the body—is the visual proof of this failed rally and a powerful bearish rejection.
This one candle captures a critical moment of struggle. It suggests momentum has shifted, and sellers are now grabbing the upper hand, making it a reliable signal for a potential top.
The Bearish Engulfing Pattern: An Aggressive Counterattack
While the Shooting Star hints at exhaustion, the Bearish Engulfing pattern signals a decisive and aggressive counter-punch by the sellers. This is a powerful two-candle formation that often marks a major market top and is one of the easiest candlestick forex patterns to spot.
The pattern happens when a smaller bullish candle is completely "engulfed" by a larger bearish candle right after it. The body of the second, red candle opens higher than the previous candle's close and closes lower than its open, swallowing it whole.
Let's unpack the psychology here:
- Initial Bullish Confidence: The first small green candle shows the uptrend is still chugging along, and buyers feel good.
- A Sudden Turnaround: The second candle opens even higher, luring in more bulls. But then, sellers storm the market with overwhelming force. They don't just erase the day's gains; they drive the price well below the previous day's open.
- Sellers Seize Control: This action shows a complete reversal of sentiment in one session. The buyers have been steamrolled, and sellers are now firmly in charge.
The sheer dominance of that second candle is a clear visual warning. The bigger the engulfing candle is compared to the first one, the more powerful the bearish signal becomes.
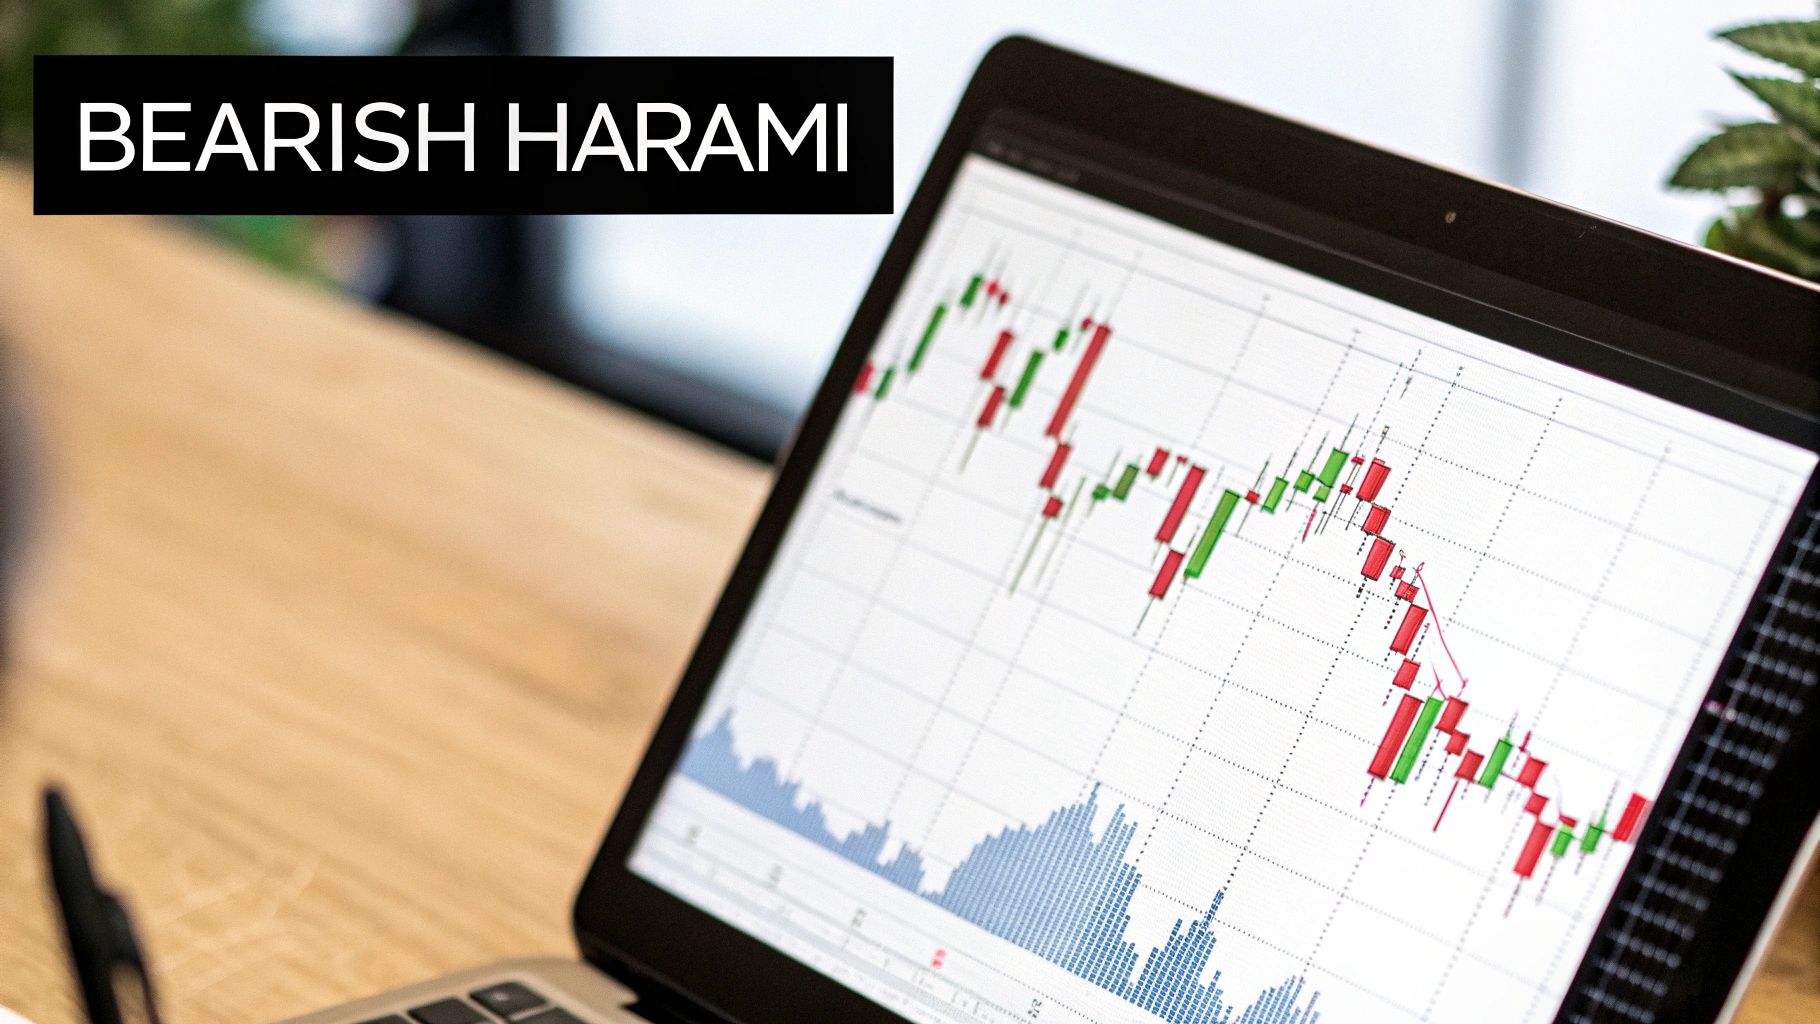
The Evening Star: Darkness on the Horizon
The Evening Star is a three-candle bearish reversal pattern, the ominous counterpart to the bullish Morning Star. It signals a potential peak with more deliberation than a single-candle pattern, showing a gradual shift from buying to selling pressure.
The pattern unfolds over three sessions:
- The Large Bullish Candle: The first candle is a long green one, confirming the uptrend is healthy and buyers are in the driver's seat.
- The Small Indecision Candle: The second candle is small-bodied (a "star"), often a spinning top or a doji. It usually gaps up from the first candle, showing initial bullish excitement that quickly fizzles out into indecision.
- The Large Bearish Candle: The third candle is a strong red candle that closes well into the body of the first candle. This confirms that sellers have taken over and the reversal is on.
The Evening Star is so highly regarded because it paints the full picture of a market top: bullish conviction, followed by hesitation, and finally, bearish confirmation. This methodical transfer of power makes it one of the more reliable bearish reversal signals a trader can have in their arsenal.
Capitalizing on Trend Continuation Patterns
Not every big candlestick pattern is screaming that the market’s about to pull a U-turn. In fact, some of the most dependable and profitable candlestick forex patterns tell you the exact opposite. They show you that a strong trend is just taking a breather before picking up steam again.
These are what we call continuation patterns. Think of them like a pit stop in a Formula 1 race, not the end of the race itself. For a trader, being able to spot these pauses is a massive advantage. It's what separates traders who get scared and jump out of a great trade too early from those who confidently ride the wave for much bigger gains.
When you can tell the difference between a healthy pause and a real reversal, you gain the confidence to stay in your winning trades longer. You stop making that classic, costly mistake of closing a perfectly good position just because the market took a little break.
The Rising Three Methods
The Rising Three Methods is a classic bullish continuation pattern. You'll find it smack in the middle of a clear uptrend, and it tells a great little story about the bears trying to take control but failing miserably.
Here’s how the action plays out on your chart:
- The Big Green Candle: First, you see a long, strong bullish candle. This confirms the uptrend is in full force.
- The Bearish Counter-Attack: Next, a few small red candles appear—usually three, sometimes two. The key here is that these bearish candles must trade within the high and low range of that first big green candle. They can't break its boundaries.
- The Bulls Roar Back: The fifth and final candle is another powerful green candle. It closes above the high of the very first candle, proving the bulls have soaked up all the selling and are ready to push higher.
What this pattern shows you, plain as day, is that the bears’ attempt to reverse things was weak and got shut down. The underlying uptrend is still very much in charge.
At its heart, the Rising Three Methods is all about resilience. The market pauses, lets some nervous traders take small profits, and then barrels forward in its original direction. It’s a loud and clear signal of serious underlying bullish strength.
When you look at the stats, these patterns are pretty impressive. Research on the Rising Three Methods shows it has a success rate of around 74% in predicting that an uptrend will continue. Its bearish cousin is similarly reliable. It’s worth digging into these success rates to really understand the statistical edge they can offer.
The Falling Three Methods
You've probably already guessed it—the Falling Three Methods is the mirror image of the pattern above. It shows up during a solid downtrend and signals that, after a quick pause, the sellers are about to get back to work.
Just like its bullish twin, it’s a five-candle story:
- The Big Red Candle: The pattern kicks off with a long bearish candle, showing the downtrend has serious momentum.
- The Bullish Counter-Attack: This is followed by a few small green candles—a weak little rally. Crucially, these candles have to stay within the range of that first big red candle.
- The Bears Take Over (Again): The last candle is another long, aggressive red candle that closes below the low of the first one. This is the proof that the bears have swatted away the buyers and are pushing the market down again.
The Falling Three Methods tells you the buyers’ attempt at a rally was pathetic and didn't last. It confirms the downtrend is the dominant force, giving you the confidence to hold your short positions or even look for a spot to add to them.
Building a Robust Candlestick Trading Strategy
Spotting a perfect Hammer or a textbook Bearish Engulfing pattern feels like a major win. I get it. But honestly, that’s just the first play in a much larger game.
Relying on candlestick forex patterns in isolation is like trying to navigate a new city with just one street sign. Sure, it gives you a clue, but you’re still missing the bigger picture. A pattern by itself is just a signal, not a complete, tradable system.
To graduate from simply spotting shapes to building a high-probability trading approach, you absolutely must learn to demand confirmation. This means fusing your candlestick signals with other technical analysis tools, making sure multiple factors are all pointing in the same direction. Think of it like a detective building a case; the more independent witnesses that agree, the stronger your argument becomes.
This process of lining up multiple, non-correlated signals is what experienced traders call confluence. It's the secret sauce that transforms a basic pattern into a trade setup worth risking your capital on.
Layering Confirmations for Stronger Signals
So, you've found a promising candlestick pattern. Before you even think about hitting the "buy" or "sell" button, your first question should be: where did it form? A bullish pattern is far more powerful if it shows up at a significant level you've already marked on your chart.
From there, you start layering on other tools to see if they back up the candlestick's story. This disciplined process is what filters out the weak, low-probability signals and dramatically improves the quality of the trades you end up taking.
Here are the essential confirmation techniques I use every day:
- Support and Resistance Levels: A Hammer is interesting. A Hammer that forms precisely at a major historical support level? Now that's a high-priority signal. That support level is a proven battlefield where buyers have shown their strength before.
- Moving Averages: What if your Bullish Engulfing pattern forms right as the price bounces cleanly off a key moving average, like the 50-period EMA? This adds a dynamic layer of support to your static price level, seriously strengthening the bullish case.
- Trend Lines: An Evening Star appearing right at the upper boundary of a descending trend line is a massive red flag for buyers. It's powerful confirmation that the bears are actively defending their territory.
- Oscillator Divergence: Let's say you spot a Morning Star. Your next move should be to glance at an oscillator like the Relative Strength Index (RSI). If the price is carving out a lower low but the RSI is making a higher low (bullish divergence), it's a huge tell. It signals that selling momentum is drying up—a story that aligns perfectly with the reversal told by your candlestick pattern.
A candlestick pattern without confluence is just market noise. A pattern with confluence—popping up at a key level with indicator confirmation—is a strategic opportunity. This is the foundation of a professional price action trading strategy.
Defining Your Trade Parameters
Once you have a confirmed signal, the final piece of the puzzle is building a clear, mechanical plan for how you'll actually trade it. This is what keeps emotion out of the equation and ensures you're managing your risk like a pro.
Your plan needs these three core components, no exceptions:
- Entry Trigger: Don't just jump in the second a pattern closes. A much safer entry trigger is to wait for the next candle to trade above the high of a bullish pattern (for a long) or below the low of a bearish one. This confirms that the market is actually starting to move in your intended direction.
- Stop-Loss Placement: Your stop-loss is your non-negotiable safety net. A logical place for it is just below the low of a bullish reversal pattern (like a Hammer) or just above the high of a bearish one (like a Shooting Star). If price hits this level, your trade idea was wrong. Simple as that.
- Profit Target: Know where you're getting out before you even get in. A straightforward approach is to target the next significant resistance level for a long trade or support level for a short one. I always aim for a risk-to-reward ratio of at least 1:2 to make the trade worthwhile.
Avoiding Common Candlestick Trading Mistakes
Getting a handle on candlestick patterns is a huge step forward in your trading, but even the most textbook-perfect setups can bleed your account dry if you use them the wrong way. So many new traders make the same predictable mistakes, thinking a pattern is some kind of magic bullet that works all on its own.
The truth is, knowing what not to do is just as important as knowing what to do.
Think of a candlestick pattern like a single clue in a detective story. It's interesting, for sure, but it’s not enough to crack the case. You need to build a complete picture with more evidence. In the same way, trading a pattern without looking at the bigger market story is a fast track to frustration.
Trading Without Context
The single biggest mistake I see is trading patterns without any market context. A perfect Hammer candlestick that shows up in the middle of nowhere on your chart is basically useless. Its real power comes from where it appears.
A Hammer that forms after a long, grinding downtrend and bounces perfectly off a major weekly support level? Now that tells a powerful story. It screams that sellers are finally exhausted and buyers are stepping in with force.
A candlestick pattern is an effect, not a cause. Its significance is directly tied to the price level where it forms. A pattern appearing far from a known support or resistance zone is often just random market noise, not a tradable signal.
So, before you even think about placing a trade on a pattern, you have to ask yourself:
- Where is this pattern forming? Is it bouncing off a major support or resistance level? A key trend line? A significant moving average?
- What's the bigger trend doing? Are you trying to trade a bullish reversal pattern when the market is in a screaming-fast downtrend?
Ignoring these questions is like trying to paddle a canoe against a raging river. You're just going to get swept away.
The Pitfall of No Confirmation
Here's another classic error: jumping the gun. A trader sees a beautiful Shooting Star pop up at a resistance level, signaling a potential top, and immediately hits the sell button. But the market can easily shrug that off and keep pushing higher.
This is where patience becomes your greatest asset.
A disciplined trader always waits for confirmation.
- For a bullish pattern: You want to see the next candle close above the high of the pattern. This is your proof that buyers are serious and have follow-through strength.
- For a bearish pattern: You need to wait for the next candle to close below the low of the pattern. This confirms that sellers have taken control and are ready to push the price down.
This one simple step will filter out a ton of false signals and save you from countless premature entries. The best setups are the ones where the market proves your analysis right before you put any of your hard-earned capital on the line. Learning from these kinds of trading mistakes can fuel your investment journey because they teach you the discipline needed to survive and thrive long-term.
Ignoring Market Volume
Finally, it’s amazing how many traders completely ignore volume. Volume is the fuel that powers price moves. It shows conviction. A strong pattern should, ideally, be backed by a spike in trading volume.
Think about it. A huge Bearish Engulfing pattern that forms on massive volume is telling a much different story than one that forms on weak, anemic volume. The first is an aggressive takeover by sellers—a real power shift. The second just suggests a lack of interest, making the pattern far less reliable.
Always check if the volume supports the story your candlestick pattern is telling you. It's a critical piece of the puzzle.
Your Candlestick Questions, Answered
Even after you get a handle on the major patterns, questions always pop up when you're trying to use this stuff on a live forex chart. It’s one thing in theory, another in practice. So, this section tackles the most common things traders ask me, giving you clear answers so you can use candlestick forex patterns with more confidence.
Think of this as your quick-fire guide for those moments of doubt.
Can I Use Candlestick Patterns on Any Timeframe?
Yes, absolutely. Candlestick patterns are what we call "fractal." That just means they show up on all timeframes, from the buzzing 1-minute charts all the way to the slow-and-steady monthly charts. A Hammer on a 5-minute chart is telling you the exact same story of price rejection as one on a daily chart.
But here’s the crucial part: their reliability gets a lot better on higher timeframes. A pattern that forms on a daily or 4-hour chart carries much more weight. Why? Because it represents a longer, more significant battle between buyers and sellers.
Day traders might live on the shorter timeframes, but swing or position traders will always give more importance to signals on the higher timeframes. It gives a much clearer, less "noisy" picture of what the market is really thinking.
What Is the Most Reliable Candlestick Pattern?
This is the million-dollar question, but the honest answer is there isn't one "most reliable" pattern that's a guaranteed winner 100% of the time. The power of any pattern comes down to context. Where is it forming? What was the trend doing right before it appeared?
That said, in my experience, multi-candle patterns are usually more robust than single-candle ones. They just give you a more developed story about the shift in momentum.
Key Insight: Patterns like the Bullish and Bearish Engulfing are held in high regard for a good reason. They show a very decisive and powerful reversal of sentiment in just a couple of candles. When you see a huge engulfing candle, it’s a clear sign that one side has completely taken over from the other, making the signal very hard to ignore.
Do Professional Traders Actually Use These Patterns?
Without a doubt. A lot of professional price action traders I know use candlestick patterns as a core part of their analysis. They don't see them as some kind of magical signal, but as a visual language. It's how the market communicates psychology and points out potential turning points.
What separates the pros is that they never use patterns in isolation. They are masters at combining these candlestick signals with other classic tools—like support and resistance levels, trend lines, and even volume—to build a complete, high-probability trade setup. They use patterns to confirm their ideas at critical price levels, helping them make much sharper decisions on when to get in, when to get out, and how to manage their risk.
Which Forex Pairs Are Best for Candlestick Trading?
Candlestick charting works brilliantly in the major forex markets. Major pairs like EUR/USD, USD/JPY, and GBP/USD are fantastic because their massive liquidity and trading volume lead to cleaner, more recognizable patterns. You get fewer weird gaps and jerky movements, which makes reading the price action much more straightforward.
Plus, the huge amount of historical data available for these pairs means you can really dig in and backtest your strategies. Want to see for yourself? You can analyze decades of historical forex price data to see how certain patterns have played out over time.
Ultimately, the "best" pair is the one you know inside and out. Every pair has its own personality and volatility. Get to know one or two really well, and you'll have a much better feel for how they behave.
Ready to stop relying on confusing indicators and start reading the market like a pro? At Colibri Trader, we teach a pure price action approach that simplifies your trading and focuses on what truly matters. Transform your trading performance with our proven strategies today!