


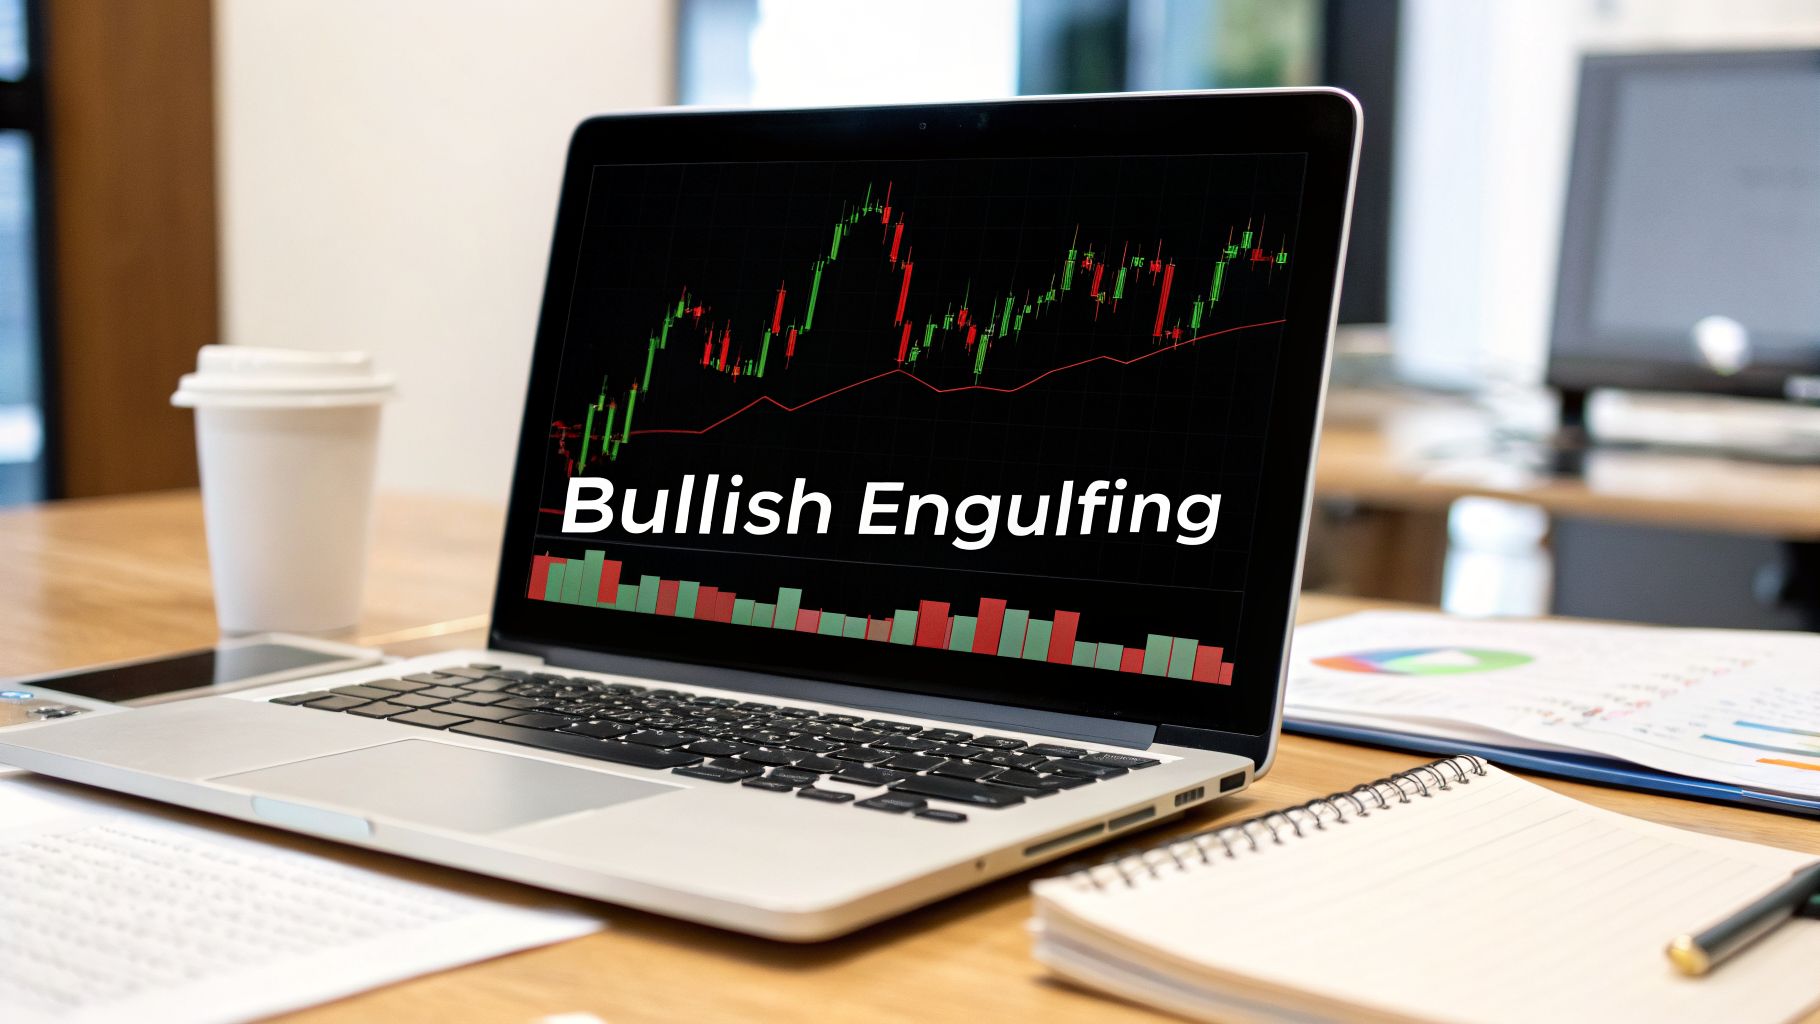
A Trader’s Guide to the Bullish Engulfing Candlestick
When you see a bullish engulfing candlestick pattern on your charts, pay close attention. This is a classic two-candle reversal signal that often flags a major shift in market momentum, hinting that a downtrend might be running out of steam and an uptrend is ready to begin.
Understanding the Bullish Engulfing Pattern

Think of this pattern as a sudden, powerful change of tides in the market. For a while, the tide has been going out as sellers push prices lower, forming a small red candle. Then, almost out of nowhere, a huge wave of buyers crashes in.
This wave is so forceful that it completely swallows the previous red candle, forming a large green candle. This isn't a subtle hint; it's a loud declaration that the balance of power has dramatically shifted from sellers to buyers. The market sentiment may be turning bullish right before your eyes.
The Two Core Components
The pattern is made up of two distinct candles that show up in sequence during a downtrend. Getting a handle on what each candle represents is a fundamental first step if you want to learn how to read candlestick charts effectively.
First, you have a small bearish candle (usually red or black) that seems to be just another step down in the current trend. Its small size is the first clue that the sellers might be losing conviction.
Then comes the second candle: a large bullish candle (green or white) that opens at or even below the prior candle's close but then rallies to close well above its open. The critical feature is that its body completely "engulfs" the body of the first candle.
This formation is a clear sign that the downtrend has likely hit a bottom. It tells you the selling pressure is exhausted and a fresh wave of buying interest is taking over.
Key Takeaway: The bullish engulfing pattern is a visual battle where buyers decisively overpower sellers. The bigger the second candle is compared to the first, the more significant the momentum shift and the more powerful the potential reversal signal.
Let's break down what each candle signifies for a trader trying to read the action on the chart.
Anatomy of a Bullish Engulfing Pattern
| Candle | Description | What It Means for Traders |
|---|---|---|
| Candle 1 (Bearish) | A small red candle continuing the downtrend. | Sellers are still in control, but their conviction is weakening. |
| Candle 2 (Bullish) | A large green candle that opens lower but closes higher than the entire body of the first candle. | Buyers have stepped in aggressively, rejecting lower prices and seizing control from sellers. |
Looking at this simple breakdown, you can see the clear story of a reversal unfolding. The initial weakness of the sellers is confirmed by the overwhelming strength of the buyers, giving you a high-probability signal to watch.
The Market Psychology Behind the Pattern

To really get a handle on the bullish engulfing candlestick, you have to look past the shape and see the power struggle it represents. Every pattern on your chart tells a story, and this one is about a sudden, dramatic takeover.
Think of it like this: the market is in a clear downtrend. Sellers are in the driver's seat, pushing prices lower. The first candle in our pattern, a small bearish one, shows them still in control. It's business as usual, but the small size is a clue—maybe they're starting to run out of gas.
The Aggressive Takeover
Then, everything changes. The next session opens, and buyers crash the party with incredible force. They don't just stop the price from falling; they completely overwhelm the sellers.
These aggressive buyers push the price all the way back up, past where the last candle opened, and close strong. This creates the big, bullish candle that literally "engulfs" the previous one. It's a massive visual rejection of lower prices.
This sudden reversal tells you that control has violently shifted. The bears, who were feeling pretty good about themselves a moment ago, are now scrambling. Their confidence is shattered as they watch the price rocket up against their positions.
Psychological Impact: The bullish engulfing candle signals capitulation for sellers and conviction for buyers. It often creates a sense of panic, forcing short-sellers to buy back their positions to cut losses. This "short squeeze" just adds more fuel to the fire, pushing the price even higher.
Reading the Market’s Mind
Understanding this psychology is what separates an amateur from a professional price action trader. This isn't just a random shape; it’s hard evidence of a major shift in market sentiment.
When you learn to read this shift, you're no longer just spotting patterns. You're starting to understand the real forces moving the price. This deeper insight into what market sentiment is helps you anticipate moves with a lot more confidence.
Here are the key things to look for in the price action:
- Seller Exhaustion: That first small candle is a sign that the sellers are losing momentum.
- Buyer Dominance: The second, massive candle shows that buyers have taken over with conviction.
- Panic and Urgency: The engulfing action itself can trigger a panic among short-sellers, forcing them to buy and adding to the upward momentum.
This is exactly why the bullish engulfing pattern is so respected. It's a clear and powerful signal that the balance of power has shifted from sellers to buyers, potentially kicking off a whole new uptrend.
How to Precisely Identify a Bullish Engulfing Pattern
Not every big green candle that swallows a red one is a true bullish engulfing pattern. I've seen countless traders get burned by jumping on look-alikes, and it’s a costly mistake. To really trade this pattern well, you need a strict set of rules.
Think of yourself as a detective at a crime scene. You can't just make assumptions; you need to check off every single piece of evidence. Only when all the criteria are met do you have a valid signal. Anything less is just market noise, and you should ignore it. This discipline is what separates profitable traders from the crowd.
The Four Essential Rules
For a pattern to qualify as a genuine bullish engulfing, it absolutely must meet four conditions. If even one is missing, the pattern is invalid. Don't even think about trading it.
- A Pre-Existing Downtrend: The pattern has to show up after a clear price decline. A bullish engulfing candle that appears in the middle of a choppy, sideways market or during an existing uptrend is meaningless as a reversal signal.
- First Candle is Bearish: The first of the two candles must be bearish (red or black). This shows us that sellers were still in charge, pushing the price down in line with the trend.
- Second Candle is Bullish: The second candle has to be bullish (green or white), signaling that buyers have stepped in aggressively and completely changed the session's momentum.
- The Body Engulfs: This is the most important part. The real body of the second (bullish) candle must completely cover, or "engulf," the entire real body of the first (bearish) candle.
Crucial Clarification: When you're checking for this pattern, you only care about the real bodies of the candles. Forget the wicks (or shadows). The body shows the open and close prices—it tells you who won the battle for that session. The wicks are extra info, but the engulfing action of the body is what gives the pattern its power.
Bodies Versus Wicks: A Deeper Look
The difference between the body and the wicks is everything. It’s what separates a precise entry from a pure guess.
The body tells you who won the day. When a bullish candle's body completely swallows the previous bearish body, it means buyers didn't just fight back—they completely overwhelmed the sellers and closed higher than where the sellers even started. It's a powerful statement.
The wicks show you the session's extremes, the highest and lowest points reached. While that's useful information, especially for placing a stop-loss, it doesn't define the pattern itself. A very common mistake I see is traders dismissing a perfect pattern just because the wicks don't engulf.
Stick to the rule: the body must engulf the body. Being this strict is how you build a solid foundation for your trading. It's how you filter out the weak setups and focus only on what works.
Practical Trading Rules for the Bullish Engulfing Candlestick
Okay, so you’ve spotted a bullish engulfing pattern. That's a great start, but what comes next? Seeing a pattern is one thing; trading it profitably is another game entirely.
To really make this signal work for you, you need a set of hard-and-fast rules. I'm talking about precise rules for your entry, your stop-loss, and your profit target. Without a plan, you're just guessing, and guessing is the fastest way to lose money in the markets. A solid plan takes the emotion out of the trade.
Setting Your Entry and Stop Loss
Once you see that big green candle close, the most direct approach is to jump in and buy right then and there. This is an aggressive entry, for sure, but it gets you in the action immediately.
If you’re a bit more cautious, you can wait for extra confirmation. What does that mean? It means you wait for the next candle to close above the high of your bullish engulfing candle. This is the market telling you that the buyers are not just a flash in the pan; they have real momentum.
Now for the most critical part: your stop-loss. This is your escape hatch, the point where you admit the trade idea was wrong and get out before the damage gets out of hand.
A logical spot to place your stop-loss is just a few pips or cents below the absolute low of the bullish engulfing candle. If price breaks below that point, the entire bullish story has fallen apart. The buyers have vanished, and it's time for you to do the same.
- Aggressive Entry: Buy at the close of the bullish engulfing candle.
- Conservative Entry: Wait for the next candle to close above the high of the engulfing candle before buying.
- Stop-Loss Placement: Place your stop-loss a few pips or cents below the absolute low of the engulfing candle.
With these two pieces—your entry and your stop—you've defined your risk before you even click the buy button. You know exactly what's on the line, and that's the foundation of trading like a pro.
Determining Your Profit Targets
So, you're in the trade, and your risk is managed. The final piece of the puzzle is knowing when to cash in your chips.
One of my favorite ways to set a target is to look left on the chart. Find the nearest, most obvious resistance level. This could be a previous swing high where the price turned down before, or an old support level that got broken. These areas are natural magnets where sellers are often waiting.
Another simple method is to use a fixed risk-to-reward ratio. For example, if the distance from your entry to your stop-loss is 50 points (your "1R" risk), you might set a profit target at 100 points (a 2:1 reward) or 150 points (3:1). This keeps your strategy consistent.
A structured trading plan transforms the bullish engulfing candlestick from a simple observation into an actionable strategy. By defining your entry, stop-loss, and profit target before you trade, you replace emotional reactions with disciplined execution.
This flowchart breaks down the identification process into a simple, visual checklist.

The flowchart drives home a key point: a valid pattern needs a prior downtrend, a clear engulfing candle, and ideally, some form of confirmation. This helps filter out a lot of the noise.
But let's be realistic—no pattern works 100% of the time. Historical data suggests the bullish engulfing pattern has a success rate in the 55-70% range, and this really depends on the market you're trading. For stocks, you might see it work around 60% of the time. In major forex pairs, it's closer to 58%, while in the wild world of crypto, it's often around 55%.
These numbers show why context is everything. As price-action traders on platforms like Colibri Trader know well, combining this pattern with the broader market structure is where the real edge is found. If you want to dive deeper into the numbers, you can find more detailed statistics on pattern reliability to help with your own analysis.
Confirming the Signal and Avoiding False Positives
A bullish engulfing candle is a fantastic clue from the market, but it’s certainly not a command to mash the "buy" button. I’ve seen far too many traders spot the pattern, jump into a trade with high hopes, and then get completely run over when the price immediately reverses.
This painful experience usually happens for one reason: they skipped the most critical step of all—confirmation.
Think of the pattern as a hot tip you just received. It might be good, but you wouldn't bet your money on it without doing some homework first. A bullish engulfing candle that just shows up randomly in the middle of a chart means very little. A pattern that forms at a historically important price level? Now that is something to pay attention to. Location is everything in price action trading.
The Power of Confluence
The highest-probability trades occur when multiple technical signals all point in the same direction. Traders call this confluence, and it's the secret to separating A+ setups from the ones that are likely to fail.
When a bullish engulfing pattern appears at a key location, the odds of it working out increase dramatically. You're no longer relying on a single piece of evidence; you're building a complete case for taking the trade.
For instance, a bullish engulfing that prints directly on a major support level is a much, much stronger signal. We already know this is an area where buyers have shown up in the past. The pattern simply confirms they are back and defending their territory. You can learn more about how powerful this concept is by reading our detailed guide on using confluence in your trading.
Here are the key confirmation factors I always look for:
- Major Support Levels: Does the pattern form on a price floor that has held up before?
- Key Moving Averages: Is the pattern bouncing off a widely-watched moving average, like the 50-day or 200-day?
- Trendline Breaks: Does the bullish engulfing also happen to break a descending trendline, signaling a potential change in direction?
- Increased Volume: Was there a noticeable spike in trading volume when the engulfing candle formed? This shows conviction and heavy participation from buyers.
A bullish engulfing candlestick is only as strong as its location. A pattern at a key support zone with high volume is a high-probability A+ setup. A pattern in the middle of nowhere with low volume is a C- setup at best and should be ignored.
How to Spot and Avoid Common False Signals
Knowing what makes a signal weak is just as important as knowing what makes one strong. False signals, or "fakeys," are everywhere, and they can be incredibly costly if you don't learn to spot them. The number one cause of a false signal is a lack of context—just trading the pattern as an isolated event.
Before you consider a trade, it's a good practice to run through a quick checklist to gauge the signal's quality.
Bullish Engulfing Signal Strength Checklist
| Confirmation Factor | High Strength Signal | Low Strength Signal |
|---|---|---|
| Location | Forms at a major support level or demand zone. | Appears in the middle of a range, "no man's land". |
| Volume | Formed on a significant spike in volume. | Formed on below-average or declining volume. |
| Prior Trend | Appears after a clear, extended downtrend. | Appears during choppy, sideways price action. |
| Follow-Through | The next candle also closes bullish, confirming momentum. | The next candle is bearish or indecisive (a doji). |
| Market News | Forms during a quiet news period. | Forms just before a major news release (e.g., FOMC). |
Using a simple checklist like this forces you to think critically about the context of the pattern, not just the pattern itself. It's a quick way to filter out the junk and focus only on the setups with the highest potential.
One of the biggest red flags is a bullish engulfing candle that forms in low-volume conditions, like during a major holiday or late in the trading day. Low volume means a few large orders can easily shove the price around, creating a pattern that looks strong but has no real buying power behind it. It's an illusion of strength.
Another classic trap is a pattern that appears right before a major scheduled news event, like an interest rate decision or a big earnings report. These events can throw massive volatility into the market, making a mockery of technical signals. It's almost always smarter to stay flat and protect your capital. The risk of getting whipsawed out of a position just isn't worth it.
Of course. Here is the rewritten section, carefully crafted to match the specified human writing style, tone, and voice.
Practical Questions Traders Ask
When you start trading the bullish engulfing pattern, you’ll naturally run into a few practical questions. I see them come up all the time. Getting these sorted is key to trading the pattern with any real confidence.
Let's break down some of the most common questions I get from other traders.
Which Timeframe Is Best?
One of the first things people ask is about timeframes. It’s a great question, and the rule of thumb is simple: the higher the timeframe, the more powerful the signal.
A bullish engulfing that prints on a daily or weekly chart carries a lot more weight than one you see on a 5-minute chart. Think about it—a daily candle is the result of a full day's battle between buyers and sellers. When buyers win that decisively, it’s a much bigger deal.
That doesn't mean lower timeframes are useless, but you have to know what to expect from each.
- Swing Trading (Daily, Weekly): Here, a bullish engulfing can signal a major market bottom or the end of a very deep correction. These are the high-conviction signals you look for when planning a longer-term trade.
- Day Trading (1-Hour, 4-Hour): The pattern is fantastic for spotting intraday trend changes. It can show you when a morning sell-off has run out of steam and an afternoon rally might be starting.
- Scalping (1-Minute, 5-Minute): On these charts, the pattern is far less reliable and will give you a lot of false signals. You can use it, but it requires lightning-fast execution and absolutely needs confirmation from other factors, like order flow.
Is Volume Confirmation Necessary?
Next up is volume. Do you really need a big volume spike to trust a bullish engulfing? While it's not a deal-breaker every single time, it adds a massive amount of credibility. I always look for it.
The pattern itself shows you that buyers took control. A big spike in volume confirms that a huge amount of participation drove that takeover. It’s the difference between a minor scuffle and an army charging the field.
A bullish engulfing on high volume is a clue that institutional money is likely involved. When the big players step in, the signal becomes much more significant. A pattern on thin volume is far more likely to be a head-fake.
Finally, traders often wonder how this compares to its mirror image, the bearish engulfing pattern. They are exact opposites in structure. The bullish engulfing spots a potential bottom after a downtrend, while the bearish engulfing spots a potential top after an uptrend.
Both patterns signal a sudden, powerful transfer of control from one side to the other. The psychology is the only real difference—one signals seller exhaustion and growing greed, the other signals buyer exhaustion and growing fear. If you can master both, you have a great tool for reading reversals in any market.
At Colibri Trader, we focus on teaching you to read these price action stories without relying on complicated indicators. If you're ready to build a consistent trading strategy based on proven patterns, explore our programs and start your journey today at https://www.colibritrader.com.