


A Price Action Guide to the Broadening Wedge Pattern
A broadening wedge pattern is one of those classic chart formations that screams market indecision. You'll see it take shape as two diverging trendlines—one connecting a series of higher highs and the other connecting lower lows. The result looks a lot like a megaphone, signaling that volatility is expanding and a battle is raging between buyers and sellers.
Understanding the Broadening Wedge Pattern
Picture a tug-of-war where, instead of one team tiring out, both suddenly get a second wind. The bulls pull the price to a new high, and just when you think they've won, the bears drag it down to an even lower low. This escalating, back-and-forth struggle is exactly what the broadening wedge shows on your chart.
This is pure price action trading at its finest. The pattern tells a story without needing a single lagging indicator. The expanding price swings are a clear sign that the market is getting ready for a big, decisive move once one side finally throws in the towel. Grasping this dynamic gives you a serious edge.
The Psychology Behind the Volatility
So, what’s happening in the minds of traders to create this pattern? It’s a clash of two very determined groups.
- Aggressive Buyers: The bulls are full of confidence. They see every dip as a buying opportunity and are constantly pushing the price to new highs.
- Determined Sellers: At the same time, the bears are just as convinced the rally is over. They aggressively sell every new high, forcing the price down to fresh lows.
- Rising Indecision: The result is controlled chaos. Neither side can hold control for long, which causes the wild price swings and the classic "megaphone" shape as volatility spikes.
This escalating fight is a double-edged sword. It creates huge opportunities, but it also comes with plenty of risk. This is a pattern that rewards patience and a well-defined plan.
The broadening wedge is a visual cue that the market is losing its composure. The orderly, predictable movements of a trend are gone, replaced by wild, emotional swings. It's a massive warning sign that the old trend is breaking down.
To get a quick overview, here are the essential characteristics in one place.
Broadening Wedge Pattern at a Glance
| Characteristic | Description |
|---|---|
| Shape | Looks like a megaphone, with diverging trendlines. |
| Trendlines | The upper line connects higher highs; the lower line connects lower lows. |
| Volatility | Continuously increases as the pattern develops. |
| Market Psychology | Represents intense conflict and indecision between buyers and sellers. |
| Breakout Direction | Can break out in either direction, making it a neutral pattern until confirmed. |
This table serves as a great cheat sheet when you're scanning charts for this powerful formation.
What the Data Reveals
Here's where it gets really interesting. The pattern itself doesn't lean bullish or bearish. Historical data shows that upward breakouts happen about 49% of the time, with downward breakouts occurring the other 51% of the time. It's virtually a coin flip.
But here’s the key: once a breakout does happen, the resulting move is often substantial. The average price move following a breakout is around 20%. This highlights why waiting for clear confirmation is so critical. For those who want to dive deeper into the numbers, comprehensive backtests from sources like Ultima Markets offer more detailed performance statistics.
How to Tell a Rising Wedge from a Falling One
Not all broadening wedges are created equal. The pattern splits into two distinct flavors, and each one tells a completely different story about what's happening behind the scenes: the ascending (rising) wedge and the descending (falling) wedge. Getting this distinction right is everything if you want to anticipate the market's next move.
The real secret is in the tilt of the megaphone shape. If you can spot whether the whole pattern is slanting up or down, you're a long way toward understanding the psychology driving the price.
This concept map breaks down the tug-of-war between buyers, sellers, and volatility.
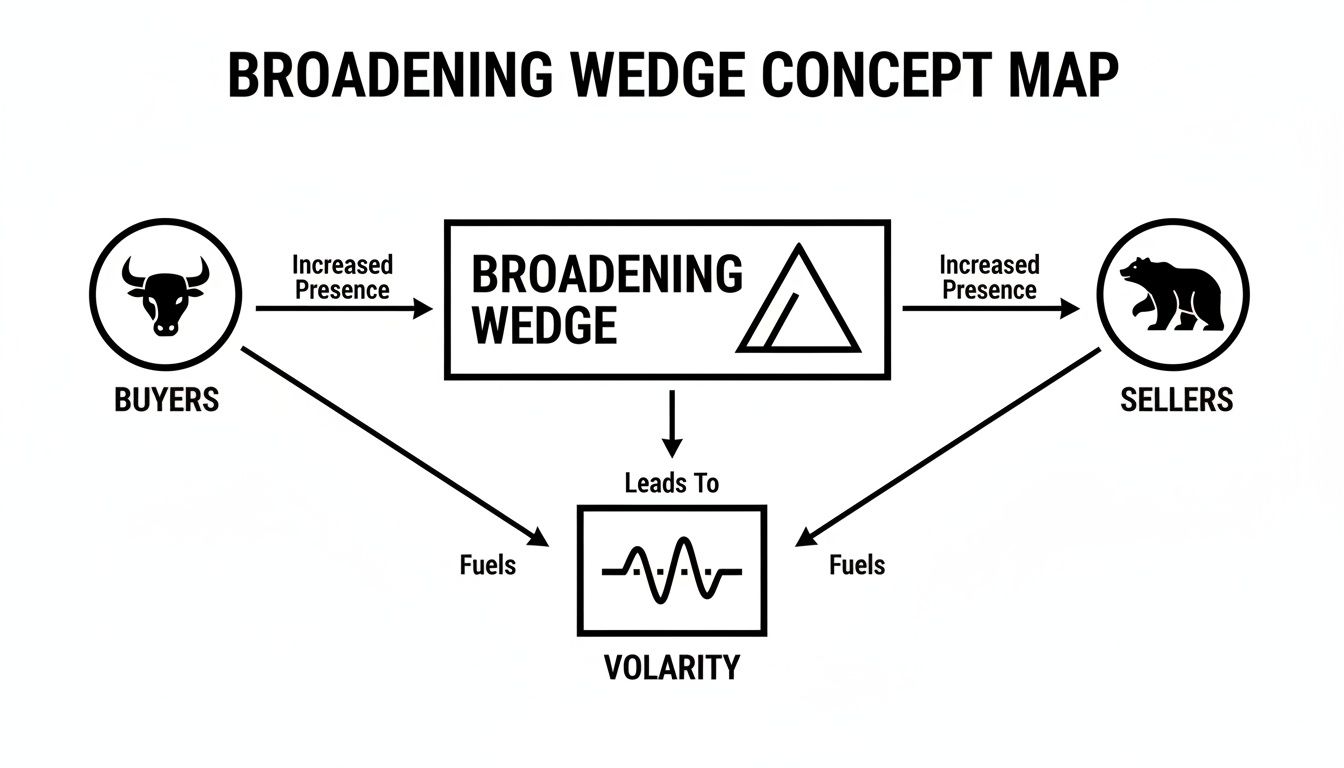
As you can see, the fight gets more intense as volatility expands. Eventually, one side gets worn out, and that's when you get the breakout.
The Ascending Broadening Wedge
Think of the ascending broadening wedge as a bull run that's starting to lose its mind. You'll see two trendlines, both sloping upwards but also fanning out. The key here is that both the highs and the lows are creeping higher, creating a megaphone shape that’s tilted up.
On the surface, it looks bullish, right? Higher highs and higher lows. But here’s the twist: it’s often a powerful bearish reversal signal. The wild, expanding swings tell you that while buyers are still pushing for new highs, they’re struggling to maintain control. Each push is met with more aggressive selling, a sign that the uptrend is running on fumes.
An ascending broadening wedge loves to show up at market tops. It’s a picture of buyer desperation clashing with opportunistic sellers. That frantic, expanding action is a huge red flag that the trend's foundation is weak.
The Descending Broadening Wedge
On the flip side, we have the descending broadening wedge. This one usually pops up during a downtrend and often signals that a bullish reversal is brewing. Here, both trendlines are sloping downwards and diverging. You’ll see a series of lower lows and lower highs.
The story here is one of sellers losing their nerve. Sure, they’re still managing to push the price to new lows, but the widening pattern shows that buyers are jumping in with more and more conviction on every dip. This expanding battle suggests the bears are losing their grip, and a strong rally could be just around the corner.
Of course, none of this works if your lines are wrong. Knowing how to draw trendlines with precision is the first and most critical skill for identifying these patterns.
For instance, that descending broadening wedge is often where you see big players quietly building their positions as volatility picks up. AI-backed studies have even put a 58% confidence level on its bullish outcome, with targets often set by adding the pattern's height to the breakout point. You can dig into more of this kind of bullish pattern analysis on tickeron.com.
A Step-by-Step Plan for Trading Breakouts
Knowing what a pattern is and knowing how to trade it are two very different things. This is where a solid, repeatable plan comes in, turning chart analysis into an actual trade. A plan acts as your roadmap, guiding you through the chaos of live markets and keeping emotion out of the driver's seat.

The goal here is to think like a pro—wait for high-probability setups, define your risk upfront, and execute without hesitation. Let's walk through the exact steps for trading the breakout when the expanding volatility finally snaps.
Step 1: Confirm the Pattern Structure
First things first: you have to be sure you're looking at a legitimate broadening wedge. A sloppy, ill-defined pattern is just noise, and trading noise is a quick way to lose money.
The gold standard for confirmation is the five-touch rule. This means the price must hit the trendlines at least five separate times. For example, that could be three touches of the upper line and two on the lower one, or vice-versa. This tells you the tug-of-war between buyers and sellers is real and has had time to mature. Anything less is often just random price action, not a tradable setup.
Step 2: Pinpoint Your Entry Trigger
Your entry is everything. Jump in too early, and you get caught in a fakeout. Wait too long, and your potential reward shrinks while your risk grows. You need a clear, unmistakable signal that the battle is over and one side has won.
The most reliable trigger is a strong candle closing cleanly outside the pattern's trendline.
- For a bullish breakout: You’re waiting for a full candle to close above the upper resistance line.
- For a bearish breakout: You need a candle to close decisively below the lower support line.
A surge in trading volume on that breakout candle is the best confirmation you can ask for. It’s like a crowd roaring its approval, showing there's real money and conviction pushing the price. Digging into different techniques for how to trade breakouts can give you even more tools for spotting these valid signals.
A breakout on weak volume is a major red flag. It suggests the big players aren't participating, and the move is far more likely to fail and snap back inside the pattern.
Step 3: Place a Protective Stop-Loss
The moment you enter a trade, your primary job shifts from finding an opportunity to protecting your capital. A stop-loss is your non-negotiable safety net. It’s what keeps one bad trade from derailing your progress.
A great spot for your stop-loss is just on the other side of the recent price structure. For a bullish breakout, you can place it just below the last swing low formed inside the wedge. For a bearish breakout, it would go just above the last swing high. This gives the trade room to breathe without exposing you to catastrophic risk.
Step 4: Set Your Profit Target
You need an exit plan before you even enter. The most time-tested method for setting a target on a broadening wedge is the "measured move." It’s beautifully simple and takes the guesswork out of when to take profits.
Here’s the two-step process:
- Measure the Height: Find the widest point of the pattern. Calculate the vertical distance from the highest peak to the lowest trough within the formation.
- Project the Target: Take that exact distance and project it from the breakout point in the direction of your trade.
This technique uses the pattern's own volatility to create a logical, data-driven target. It stops you from bailing on a good trade too early out of fear or getting greedy and watching your profits evaporate.
Trading Plan Comparison for Bullish vs Bearish Breakouts
To make this crystal clear, let's compare the trading plans for both a bullish and a bearish scenario side-by-side. Notice how the core principles remain the same, but their application is mirrored depending on the direction of the trade.
| Trading Step | Bullish Breakout (From Descending Wedge) | Bearish Breakout (From Ascending Wedge) |
|---|---|---|
| Pattern Confirmation | At least 5 touches of the converging trendlines. | At least 5 touches of the converging trendlines. |
| Entry Trigger | A strong candle closes above the upper resistance line. | A strong candle closes below the lower support line. |
| Stop-Loss Placement | Place the stop just below the most recent swing low inside the pattern. | Place the stop just above the most recent swing high inside the pattern. |
| Profit Target | Measure the pattern's height and project it upward from the breakout point. | Measure the pattern's height and project it downward from the breakout point. |
Having this clear, logical framework for both scenarios ensures you can act decisively, no matter which way the market breaks. It's this kind of systematic approach that separates consistent traders from the crowd.
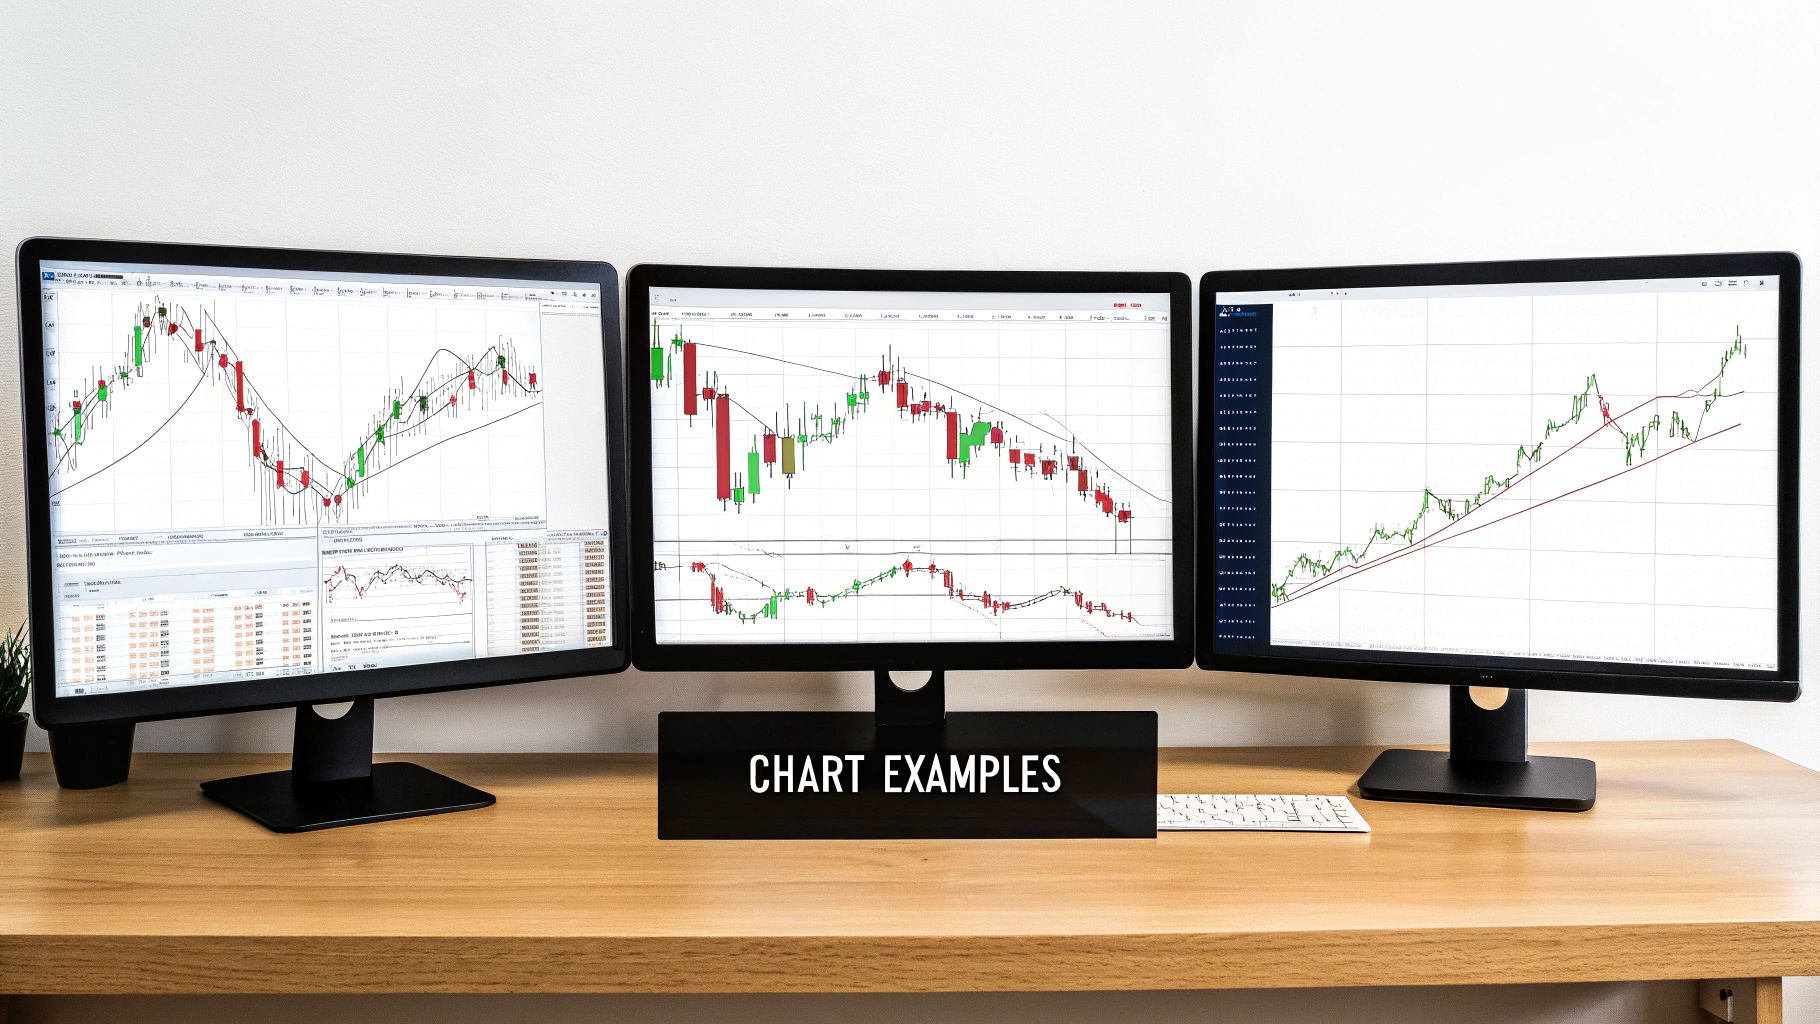
Seeing the Wedge Pattern on Real Charts
Theory is great, but nothing cements a trading concept like seeing it play out on a live chart. Let's move beyond the diagrams and look at how broadening wedge patterns actually behave in the wild. Watching price action tell its story is how you'll truly get a feel for these high-volatility setups.
It's just as important to study the patterns that fail as it is to study the ones that work. A winning trade builds your confidence, sure, but a losing one forces you to learn critical lessons about risk and the patience required to wait for real confirmation.
Example 1: A Classic Bullish Breakout
Here we have a perfect example of a descending broadening wedge that appeared on the 4-hour chart of a major crypto pair. You can clearly see the series of lower lows and lower highs, painting a picture of a downtrend that's running out of gas. Each dip was met with more aggressive buying.
- Pattern Formation: The price tagged the lower support line three separate times and the upper resistance line twice. That gives us our five required touches, confirming the tug-of-war between sellers and incoming buyers.
- The Breakout: The signal came from a strong bullish candle that closed firmly above the upper trendline. Just as importantly, you can see the spike in volume that came with it. That was the green light to go long.
- Trade Management: A stop-loss was tucked just beneath the last swing low created inside the pattern. The profit target was set using the measured move—projecting the pattern's height up from the breakout point—and the trade hit its target cleanly.
This is a textbook case of how a well-formed descending wedge can signal seller exhaustion and kick off a powerful bullish reversal.
Example 2: A Failed Bearish Breakout
Now for a different story. This chart shows an ascending broadening wedge that formed on a popular stock during a very strong uptrend. The expanding volatility was there, but the breakout itself just didn't have any power behind it.
The breakout candle was a tiny bearish bar that squeaked just below the lower support line, and worse, it happened on declining volume. That’s a massive red flag. Sure enough, the price snapped back almost immediately, re-entering the wedge and stopping out anyone who went short.
This failed breakout is a perfect reminder that context is king. A bearish pattern popping up in the middle of a powerful, established uptrend needs overwhelming confirmation to be a high-probability trade. Ignoring weak volume on a breakout is a classic, costly mistake.
Broadening wedge bottoms, specifically, are known to be potent bullish reversal signals after a long downtrend. These setups usually form with three distinct bottoms and two tops before price finally breaks decisively higher. A great historical example is the bottoming wedge on the Nikkei 225 in 2023 after a yen crisis; it preceded a massive 28% annual rally. If you want to dive deeper into this specific formation, you can find more on broadening wedge bottoms at Futu HK.
Common Trading Mistakes and How to Avoid Them
The broadening wedge pattern can set the stage for some truly explosive moves, but that expanding volatility can also make it a minefield for an undisciplined trader. It's a pattern that preys on impulse. Even if you have a solid plan, a few common psychological traps can quickly turn a textbook setup into a frustrating loss.
Learning to sidestep these pitfalls is just as crucial as learning to spot the pattern in the first place.
Successfully navigating this pattern means recognizing where things can go wrong before they drain your account. Let's walk through the most frequent errors I see traders make and give you some simple, rule-based ways to stay on the right side of the trade.
Mistake 1: Trading Inside the "Megaphone"
By far, the most tempting mistake is trying to trade the swings within the wedge. I get it. The price swings are getting wider and wilder, and it looks like easy money to just buy the lows and sell the highs. This is a classic beginner's trap.
The entire point of this pattern is that volatility and uncertainty are escalating. It's an incredibly hostile environment for scalping. The risk of getting "whipsawed" back and forth is enormous, as the price can reverse violently without any warning, stopping you out again and again. Each new high and low is more extreme than the last, which makes setting reliable risk-to-reward trades inside the formation a fool's errand.
The Solution: Just stay out. Seriously. Your job isn't to play in the chaos; it's to wait patiently on the sidelines until the battle between the bulls and bears has a clear winner. The real, high-probability trade happens after the breakout, not during the fight.
Mistake 2: Chasing Unconfirmed Breakouts
Impatience is the account killer. You see the price just poke its head outside one of the trendlines, and that fear of missing out (FOMO) kicks in hard. You jump in, wanting to catch the very beginning of the move. This is a huge mistake. False breakouts, or "head fakes," are incredibly common with this pattern. A breakout without strong confirmation will often snap back inside the wedge just as fast as it left.
Think of it this way: a weak move on low volume isn't a signal, it's a warning. It tells you the big money—the institutions—aren't backing the move, which leaves it vulnerable to a swift and painful reversal.
Never front-run a breakout. The goal isn't to be the first one in; it's to be on the right side of a confirmed, powerful move. A little bit of missed profit is a small price to pay for avoiding a significant loss.
The Solution: Demand confirmation. You need to see a strong, full-bodied candle close decisively outside the pattern's trendline. That close is your proof. Ideally, this signal should come with a noticeable spike in trading volume, which shows there's real conviction and money behind the breakout.
Mistake 3: Ignoring the Broader Market Context
No chart pattern exists in a vacuum. A beautiful, bearish ascending broadening wedge that appears in the middle of a raging bull market is a low-probability trade, plain and simple. Similarly, a bullish descending wedge forming during a steep, prolonged downtrend needs way more confirmation before you should even think about going long.
Ignoring the primary trend is like trying to swim against a powerful current. You might make a little headway, but you're probably just going to get exhausted and swept away. While reversal patterns absolutely work, trading with the dominant market momentum will always put the odds more firmly in your favor.
The Solution: Always zoom out. Before you even consider placing a trade based on a 1-hour or 4-hour chart, pull up the daily or weekly chart. Get a feel for the primary trend. Is the market bullish, bearish, or just chopping sideways? Give far more weight to setups that align with that larger market direction.
Answering Your Questions About the Broadening Wedge
Even with a solid game plan, new questions always pop up when you start seeing a pattern on a live chart. The broadening wedge, with its signature expanding volatility, can definitely spark some confusion. Let’s tackle the most common questions I hear from traders trying to master it.
The idea here is to get you the practical, real-world answers you need to trade this pattern with confidence and clarity.
What’s the Best Timeframe to Trade This?
You’ll spot the broadening wedge everywhere, from the wild one-minute charts all the way up to the slow-and-steady weekly timeframe. But if you're just getting your feet wet with this pattern, I strongly suggest starting on the higher timeframes, like the 4-hour or daily chart.
Why? Because these slower charts cut through a ton of the market "noise," making the pattern’s structure much cleaner and more reliable. It also gives you breathing room—plenty of time to analyze the setup, plan your trade, and execute without feeling rushed. Once you're consistently nailing it on the higher timeframes, you can take those same price action skills down to the faster charts.
Just How Reliable Is This Pattern?
On its own, the pattern is pure indecision. The direction it will ultimately break is nearly a coin flip. The reliability doesn't come from the pattern itself, but from how you trade it. A trader who patiently waits for confirmation—say, a strong candle closing decisively outside the trendline on a surge of volume—will find it far more dependable than someone who jumps in on a whim inside the chaos.
The pattern isn't the strategy; it's a market condition. Your reliability comes from executing a disciplined plan around that condition.
Should I Slap Some Indicators on My Chart?
Some traders love to add indicators like the RSI to hunt for divergence, but I’ve found a pure price action approach is usually more effective. The entire story of the fight between buyers and sellers is already right there in the candlesticks and the pattern’s structure.
Adding lagging indicators often just creates conflicting signals, which leads to "analysis paralysis" right when you need to act. If you're going to add one extra tool, make it volume. A big spike in volume is one of the clearest signs you can get to confirm the strength and validity of a breakout. Master reading the price action first.
How Is This Different from a Triangle Pattern?
The core difference is volatility. A broadening wedge has diverging trendlines that fan out and move away from each other. This screams expanding volatility and market chaos. Think of it as a shouting match that’s getting louder and more out of control.
A triangle pattern is the exact opposite. It has converging trendlines that squeeze toward each other, showing contracting volatility as the market coils up before its next big move. It’s the quiet before the storm. They represent two completely different states of the market.
At Colibri Trader, we teach you how to read the story of the market directly from the price chart. If you're ready to build a profitable trading skillset without relying on confusing indicators, explore our action-based programs today at https://www.colibritrader.com.