


9 Best Breakout Trading Strategies for 2025
Welcome to the definitive guide on mastering breakout trading. In today's dynamic markets, identifying the precise moment a stock, currency, or commodity breaks free from a consolidation period is one of the most powerful skills a trader can possess. A successful breakout signals a potential shift in market sentiment and the start of a new, powerful trend. However, distinguishing a genuine, high-momentum breakout from a deceptive 'fakeout' is the difference between substantial profit and frustrating loss.
This article moves beyond generic advice to provide a detailed, actionable blueprint. We will dissect the top breakout trading strategies, each backed by specific entry and exit rules, robust risk management protocols, and real-world chart examples. Our focus is on clean, indicator-free analysis that empowers you to read the market's story directly from the charts.
Inside, you will learn how to:
- Identify high-probability consolidation patterns like triangles, channels, and flags.
- Confirm breakouts using volume and multi-timeframe analysis.
- Execute entries with precision to maximize potential gains.
- Manage risk effectively to protect capital from false moves.
By mastering these proven breakout trading strategies, you'll gain a repeatable edge. Prepare to learn the exact techniques used by professional traders to capitalize on market volatility and build a more consistent approach to capturing significant price movements.
1. Horizontal Support and Resistance Breakouts: The Foundation of Breakout Trading
The most fundamental of all breakout trading strategies is the horizontal support and resistance breakout. This classic technique revolves around identifying key price levels where an asset has historically struggled to move past. Resistance is a ceiling where selling pressure repeatedly overcomes buying pressure, while support is a floor where buyers consistently step in to prevent further price drops.
This method is the bedrock of price action trading, built on the market's psychological memory at specific price points. When the price finally pushes decisively through one of these established barriers, it signals a significant shift in the supply-and-demand dynamic. This "break" is the event that triggers a trade, as it suggests strong momentum will carry the price further in the breakout direction.

How to Implement This Strategy
A trader's first task is to identify and validate these horizontal levels on a chart. The more times a price touches and reverses from a level, the stronger that level is considered. For instance, Bitcoin’s historic break above the $20,000 resistance in late 2020 was a powerful signal because that level had held firm for years, creating immense psychological significance.
Once a valid level is found, the strategy involves waiting for a clean break. An entry is typically considered after a candle closes firmly beyond the level, not just when the price wicks through it momentarily.
Key Insight: The longer the period of consolidation below a resistance or above a support level, the more powerful and explosive the eventual breakout tends to be. This pent-up energy often leads to a sustained move.
Actionable Tips for Success
To effectively trade these foundational breakouts, focus on confirmation and risk management:
- Confirm with Volume: A true breakout should be accompanied by a significant spike in trading volume. This indicates strong conviction from market participants and reduces the chance of a "fakeout."
- Validate the Level: For a level to be considered strong, look for at least two to three distinct and clear touches where the price reversed.
- Manage Your Risk: For a long trade (breaking resistance), set your initial stop loss just below the old resistance level. That broken ceiling should now act as a new floor of support. This principle of polarity is a core concept you can explore further. To dive deeper into these foundational price action techniques, you can learn more about the support and resistance trading strategy on colibritrader.com.
2. Triangle Pattern Breakouts: Charting Market Indecision
Moving beyond simple horizontal levels, triangle pattern breakouts are among the most reliable breakout trading strategies for capturing explosive moves. These patterns form during a period of consolidation where price action creates converging trendlines, signaling a temporary battle between buyers and sellers. When the price finally breaks out of the triangle's boundaries, it indicates a decisive winner has emerged, often leading to a powerful move in the breakout direction.
This strategy is powerful because it visually represents market indecision coiling into a point of high tension. The narrowing price range compresses volatility, and like a coiled spring, the energy released upon the breakout is often significant. Classic chartists like Edwards and Magee identified three main types: ascending (bullish), descending (bearish), and symmetrical (neutral but often a continuation pattern).
How to Implement This Strategy
Implementation begins with correctly identifying and drawing the triangle on a chart. An ascending triangle has a horizontal resistance line and a rising support trendline, while a descending triangle has a horizontal support line and a falling resistance trendline. A symmetrical triangle has both a rising support and a falling resistance trendline.
Once the pattern is identified, a trader waits for a decisive candle close outside of the converging trendlines. For example, Tesla's stock formed a clear ascending triangle pattern throughout mid-2020 before its powerful breakout, signaling the start of a massive upward trend. Waiting for the close prevents getting caught in false moves, or "wicks," that pierce the trendline but fail to hold.
Key Insight: A common mistake is trading a breakout that occurs too close to the triangle's apex (the point where the trendlines converge). Breakouts that happen between the halfway point and three-quarters of the way through the pattern are generally more reliable and powerful.
Actionable Tips for Success
To trade triangle breakouts effectively, precision in entry, targeting, and risk management is crucial:
- Confirm with Volume: Just like horizontal breakouts, a genuine triangle breakout should be accompanied by a noticeable increase in trading volume. This confirms institutional participation and conviction.
- Measure for Profit Targets: A classic technique is to measure the height of the triangle at its widest part and project that distance from the breakout point. This provides a logical initial profit target.
- Manage Your Risk: For a bullish breakout from an ascending or symmetrical triangle, place a stop loss just below the broken upper trendline. For a bearish breakout, the stop loss would go just above the broken lower trendline, which should now act as resistance.
For a visual guide on identifying and trading these patterns, the following video offers a detailed explanation:
3. Channel Breakout Strategy
Expanding on the concept of support and resistance, the channel breakout strategy identifies when a price breaks out of a well-defined, parallel corridor. These channels can be ascending (a bull market), descending (a bear market), or horizontal (a ranging market). The upper trendline acts as resistance, and the lower trendline acts as support.
This method visualizes the "rhythm" of a market, where price action is contained between two parallel lines. A breakout from this channel signifies a potential disruption of this rhythm and either an acceleration of the current trend or a complete reversal. Pioneers like Richard Donchian developed early versions of this concept, recognizing that a break from a recent trading range was a powerful market signal.

How to Implement This Strategy
The first step is to draw the channel accurately. Connect at least two major swing lows to form the lower support trendline and two major swing highs for the upper resistance trendline. The lines should be parallel, or very close to it, to be considered a valid channel. For example, crude oil prices often trade within multi-month ascending or descending channels, and breakouts from these patterns can signal major shifts in global supply-and-demand sentiment.
Once the channel is established, the trader waits for the price to decisively close outside of it. A break above the upper line of a descending or horizontal channel triggers a long entry, while a break below the lower line of an ascending or horizontal channel signals a short entry.
Key Insight: The width of the channel can be a useful tool for setting initial profit targets. A common technique is to measure the channel's height and project that distance from the breakout point to estimate the potential price move.
Actionable Tips for Success
To improve the reliability of channel breakout trades, focus on confirmation and clear entry/exit rules:
- Confirm with Volume: Just like horizontal breakouts, a genuine channel break should be accompanied by a noticeable increase in trading volume. This confirms market participation and momentum behind the move.
- Validate the Channel: A strong, reliable channel should have at least two touches on each trendline (four touchpoints total). The more times the price respects these boundaries, the more significant a breakout becomes.
- Wait for the Close: Avoid entering a trade simply because the price "wicks" outside the channel intra-candle. Wait for a full candle body to close beyond the trendline to reduce the risk of a false breakout, or "fakeout."
- Manage Your Risk: For a bullish breakout, place a stop loss just inside the channel, below the broken upper trendline. For a bearish breakout, the stop loss would go just inside the channel, above the broken lower trendline. The old boundary should now serve as a new support or resistance level.
4. Flag and Pennant Breakouts: Riding the Momentum Wave
Among the most reliable breakout trading strategies are flag and pennant patterns. These are short-term continuation patterns that signal a brief pause or consolidation in a market after a strong, explosive price move. A flag is a rectangular consolidation sloping against the prevailing trend, while a pennant is a small, symmetrical triangle. Both represent the market catching its breath before the original trend is likely to resume.
This strategy is powerful because it capitalizes on existing momentum. The initial sharp move, known as the "flagpole," demonstrates strong directional conviction from either buyers or sellers. The subsequent consolidation is simply a temporary equilibrium before that same conviction re-engages, making the breakout from the pattern a high-probability entry point. Legendary traders like Mark Minervini and William O'Neil have championed these patterns for their effectiveness in high-growth stocks.
How to Implement This Strategy
The first step is to identify a "flagpole," which is a near-vertical price surge on high volume. Following this move, the price will enter a consolidation phase, forming either a rectangular flag or a triangular pennant. The key is that this consolidation should occur on lower, receding volume, indicating a lack of selling pressure, not a reversal of the trend.
An entry is triggered when the price breaks decisively out of the upper boundary of the flag or pennant in the direction of the original trend. For example, during its historic 2021 rally, GameStop (GME) formed several classic bull flag patterns. Each flagpole represented intense buying pressure, followed by a brief, orderly pullback that offered new entry points for traders before the next surge higher.
Key Insight: The target for a flag or pennant breakout can often be estimated by measuring the height of the initial flagpole and adding it to the breakout point. This technique provides a logical price objective for taking profits.
Actionable Tips for Success
To trade these momentum-based breakouts effectively, focus on the context of the move and disciplined execution:
- Confirm with Volume: The breakout from the flag or pennant must be accompanied by a surge in volume. This confirms that the momentum is returning and validates the trading signal.
- Context is King: These patterns are most reliable when they form after a break of a significant, longer-term consolidation or a key resistance level. The flagpole itself is a breakout, and the flag is the first pause after.
- Manage Your Risk: Place your stop loss just below the lowest point of the flag or pennant formation. If the price breaks down through the opposite side of the pattern, the signal is invalidated, and the position should be closed.
5. Volume Breakout Strategy: Confirming Conviction with Market Activity
While price action is paramount, the volume breakout strategy adds a crucial layer of confirmation by focusing on the force behind the move. This approach asserts that a price breakout without a significant increase in trading volume is suspect and has a higher probability of failing. It’s a powerful method for filtering out low-conviction moves and identifying breakouts driven by strong institutional participation.
This strategy is rooted in the work of market analysts like Richard Wyckoff and Tom Williams, who viewed volume as the "effort" and price movement as the "result." A legitimate breakout, therefore, should show a massive effort (high volume) leading to a significant result (a clean price break). When a stock like Zoom experienced its monumental breakout during the early days of the COVID-19 pandemic, the price surge was accompanied by an unprecedented explosion in trading volume, confirming the new trend's validity.
How to Implement This Strategy
The core of this strategy is comparing the volume on the breakout candle to its recent average. A trader first identifies a key price level, such as a horizontal resistance or a trendline, just as they would in other breakout methods. However, the trade trigger requires a dual condition: the price must close decisively beyond the level, and the volume for that period must be substantially higher than the recent norm.
For example, a trader might look for volume on the breakout candle to be at least 100% to 200% above its 50-day moving average. This surge indicates that a large number of market participants are aggressively entering positions, providing the fuel needed to sustain the new price trend. Without this volume spike, the breakout may just be noise or a "fakeout" designed to trap eager traders.
Key Insight: Volume often precedes price. A subtle increase in volume during a consolidation phase, even before the price breaks out, can be an early signal that large players are accumulating positions in anticipation of a move.
Actionable Tips for Success
To effectively incorporate volume analysis into your breakout trading strategies, focus on clear, quantifiable rules:
- Set a Volume Threshold: Establish a clear rule for what constitutes a volume spike. A common starting point is to require the breakout candle's volume to be at least double (2x) the 50-period average volume.
- Confirm, Don't Predict: Use volume to confirm the breakout, not to predict it will happen. Wait for the candle to close with both a price break and a volume surge before entering a trade.
- Analyze Post-Breakout Volume: Pay attention to the volume on the candles immediately following the breakout. Sustained high volume suggests follow-through momentum, while a sharp drop-off in volume could indicate the move is losing steam.
- Use the Volume Profile Tool: For a more advanced view, use the volume profile indicator. This tool shows how much volume has traded at specific price levels, helping you identify high-volume nodes that can act as future support or resistance, which is a key concept in the teachings of experts like Anna Coulling.
6. News-Driven Breakout Strategy
The news-driven breakout strategy fuses technical analysis with fundamental catalysts to capitalize on explosive price movements. This approach involves identifying assets that are coiled in a consolidation pattern just before a significant, scheduled news event like an earnings report, a central bank decision, or a major product announcement. The release of this new information acts as the trigger that can shatter pre-existing support or resistance levels with immense force.
Unlike purely technical strategies, this method requires a keen awareness of market-moving events and an understanding of how new fundamental data can rapidly shift investor sentiment. The core idea is to let the news provide the powerful momentum needed to sustain a breakout, creating a high-velocity trading opportunity. This makes it one of the most dynamic breakout trading strategies available.
How to Implement This Strategy
Implementation begins with an economic calendar and an earnings schedule. A trader identifies a stock or currency pair with a high-impact event on the horizon and then analyzes its chart to find clear consolidation patterns or key price barriers. For example, a pharmaceutical stock might trade in a tight range for weeks leading up to an FDA approval decision. A trader would mark the high and low of that range as potential breakout points.
When the news is released, the trader watches for a decisive price move and a surge in volume. An entry is made once the price breaks and closes beyond the identified level, with the news acting as a powerful confirmation of the move's legitimacy. A classic example is Tesla's stock frequently breaking key resistance levels immediately following the release of better-than-expected vehicle delivery numbers.
Key Insight: The market's reaction to the news is more important than the news itself. Bullish news doesn't always lead to a bullish breakout, and vice-versa. Focus on the price action first and use the news as the catalyst.
Actionable Tips for Success
Trading news events is notoriously volatile, so precision and discipline are paramount:
- Prepare in Advance: Identify critical support and resistance levels before the news is released. Don't try to find them in the heat of the moment when volatility is high.
- Use Smaller Position Sizes: The potential for slippage and extreme price swings is significant. Reduce your standard position size to manage the elevated risk associated with news-driven volatility.
- Monitor Pre-Market Activity: For events like earnings reports, pre-market and after-hours trading provide early clues about the market's initial reaction. This can help you anticipate the direction of the potential breakout when the main session opens.
- Have a Pre-Determined Exit Plan: Know exactly where your stop loss will be and where you plan to take profits before you even enter the trade. The speed of these moves leaves no time for indecision.
7. Bollinger Band Squeeze Breakouts
Developed by John Bollinger, this technique is one of the most popular volatility-based breakout trading strategies. It focuses on identifying periods of extremely low volatility, indicated when the upper and lower Bollinger Bands contract and move closer together. This "squeeze" signals that the market is consolidating and building energy for a significant move.
The core principle is that periods of low volatility are inevitably followed by periods of high volatility. When the price finally breaks out of this tight band constriction, it often triggers an explosive and sustained move as volatility rapidly expands. The direction of the break, whether above the upper band or below the lower band, signals the likely direction of the new trend.
How to Implement This Strategy
The first step is to apply Bollinger Bands to a chart, typically using the standard settings of a 20-period moving average and two standard deviations for the bands. A trader then watches for the bands to narrow significantly, creating the "squeeze." A common rule of thumb is to look for the band width to reach a multi-period low.
Once a squeeze is identified, the trader waits for a decisive candle to close outside of either the upper or lower band. For example, a stock might consolidate tightly before an earnings announcement. A powerful close above the upper band after the news release would be the trigger for a long entry, anticipating further upward momentum.
Key Insight: The Bollinger Band Squeeze is a purely mechanical signal that visualizes the transition from market equilibrium (low volatility) to disequilibrium (high volatility). The squeeze itself is neutral; it's the subsequent break that provides the directional bias.
Actionable Tips for Success
To trade Bollinger Band Squeeze breakouts effectively, focus on confirmation and precise entry/exit points:
- Wait for the Squeeze: Be patient and wait for the bands to become noticeably narrow. A premature entry during minor consolidation will likely fail.
- Confirm with Volume: A valid breakout from the bands should be accompanied by a surge in trading volume. This confirms market participation and conviction behind the move.
- Use the Middle Band for Risk Management: A common tactic is to place your stop loss on the other side of the 20-period moving average (the middle band). If the price breaks out upwards, the middle band should now act as dynamic support. If it fails, your risk is contained. Understanding how price interacts with moving averages is a key element of this method. To learn more about how this fits into a broader trading framework, you can read about a complete price action trading strategy on colibritrader.com.
8. Multi-Timeframe Breakout Strategy
One of the most powerful ways to increase the probability of a successful trade is by using a multi-timeframe breakout strategy. This sophisticated technique involves analyzing an asset across different timeframes simultaneously to filter out low-quality signals and identify high-conviction opportunities. It ensures a breakout on a shorter timeframe is not moving directly against a stronger, dominant trend on a longer timeframe.
The core principle, popularized by traders like Alexander Elder with his "Triple Screen" system, is to use the longer timeframe to establish the overall market direction and key levels. The intermediate timeframe is then used to identify a specific setup, like a consolidation pattern, while the shortest timeframe is used to pinpoint the exact entry. A breakout is only considered valid if all three timeframes are in alignment.
How to Implement This Strategy
To implement this strategy, you must first define your timeframes. A common rule of thumb is to use a ratio of 1:4 or 1:5 between them. For example, a swing trader might use the daily chart for the main trend, the 4-hour chart to identify a breakout pattern, and the 1-hour chart for the entry signal.
Imagine a stock is in a clear uptrend on the weekly chart. On the daily chart, it forms a tight consolidation pattern right below a key resistance level. A trader using this method would wait for a decisive breakout on the daily or 4-hour chart, knowing that the overarching weekly trend supports a move higher. This alignment drastically reduces the chances of entering a false breakout that quickly reverses.
Key Insight: A breakout on a lower timeframe that aligns with the dominant trend of a higher timeframe is one of the highest-probability setups in trading. The higher timeframe acts as a powerful tailwind, propelling the trade forward.
Actionable Tips for Success
To effectively integrate this approach into your breakout trading strategies, consider these rules:
- Establish a Hierarchy: Always start your analysis on the longest timeframe to determine the main trend and significant support or resistance zones. This provides the crucial context for any shorter-term trade.
- Seek Confirmation, Not Contradiction: The breakout on your entry timeframe must be in the same direction as the trend on your primary, longer timeframe. If the daily chart is bearish, avoid taking long breakouts on the 15-minute chart.
- Manage Your Trade Systematically: While the entry may occur on a short timeframe, key profit targets and major stop-loss levels are often best placed based on the structure of the longer timeframe chart.
- Use Proper Ratios: Stick to logical timeframe combinations like Monthly/Weekly/Daily for position trading or Daily/4-Hour/1-Hour for swing trading to maintain analytical clarity. You can learn more about how to effectively use multiple timeframe analysis in trading on colibritrader.com.
9. Multi-Timeframe Analysis for High-Probability Breakouts
One of the most powerful breakout trading strategies involves aligning trades with the dominant trend across multiple timeframes. This method, known as multi-timeframe analysis, prevents traders from taking breakouts that go against the larger market current. A breakout on a 15-minute chart might look promising, but if it opposes a strong downtrend on the daily chart, it's far more likely to fail.
The core principle is to use longer timeframes (like weekly or daily) to establish the primary market direction and identify major support or resistance zones. Shorter timeframes (like 4-hour or 1-hour) are then used to pinpoint precise entry points for breakouts that are in sync with that larger trend. This layered approach acts as a powerful filter, significantly improving the probability of success.
This infographic illustrates the top-down workflow for this strategy, showing how traders move from the big picture to a specific trade entry.
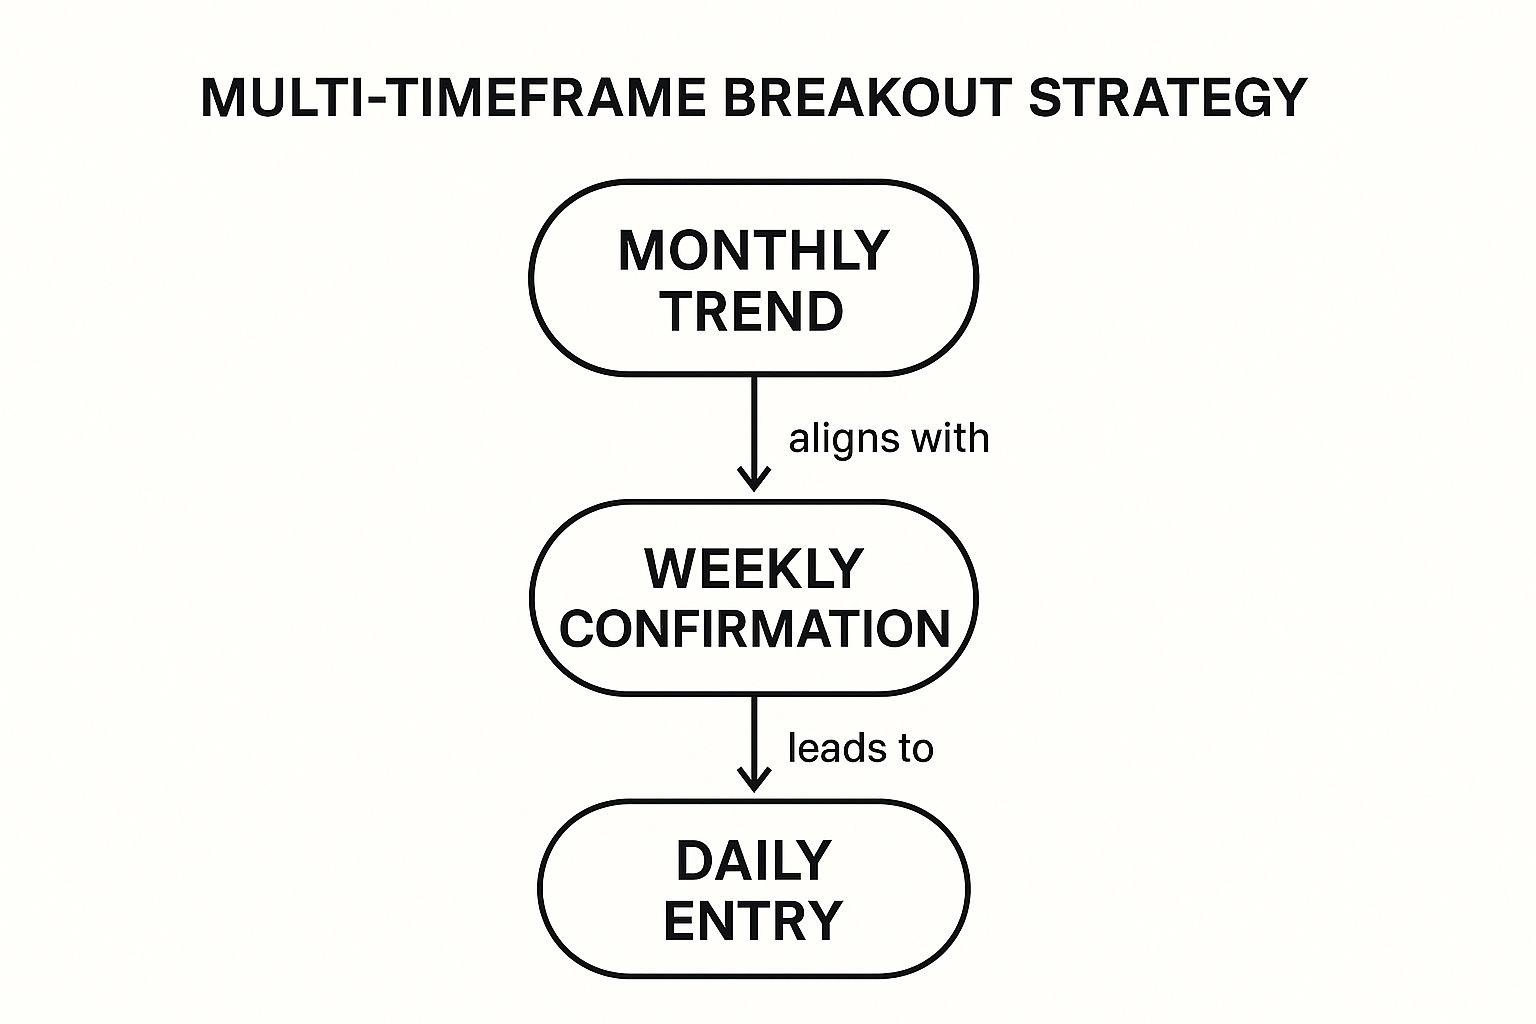
The visualization demonstrates how each lower timeframe must confirm the bias established by the higher timeframe, ensuring all signals are aligned.
How to Implement This Strategy
Start by analyzing a high timeframe, such as the weekly chart, to determine the overall market trend. Is the price making higher highs and higher lows (uptrend) or lower lows and lower highs (downtrend)? Once you've established this primary bias, drop down to a daily chart to find key horizontal levels or patterns forming in the same direction.
For example, if the weekly chart shows a clear uptrend, you would look for a bullish flag or a consolidation pattern under a key resistance level on the daily chart. The actual trade entry is then triggered on an even lower timeframe, like the 4-hour chart, when the price breaks out of that consolidation.
Key Insight: Trading with the trend on multiple timeframes is like swimming with the current instead of against it. It requires more patience but dramatically reduces the risk of being caught in a false breakout or a "bull trap."
Actionable Tips for Success
To effectively use multi-timeframe analysis for breakouts, follow a strict, top-down process:
- Define Your Timeframes: Use a consistent set of timeframes, such as Weekly for trend, Daily for setup, and 4-Hour for entry. This creates a systematic and repeatable process.
- Don't Force a Trade: If the timeframes are not in alignment, simply stay out of the market. The absence of a clear signal is itself a signal to be patient.
- Align Your Stop Loss: Place your stop loss based on the structure of your entry timeframe (e.g., the 4-hour chart), but ensure it makes sense in the context of the daily chart’s key levels. This protects you from short-term volatility while respecting the larger market structure.
Breakout Strategies: 9-Point Comparison
| Strategy | Implementation Complexity 🔄 | Resource Requirements ⚡ | Expected Outcomes 📊 | Ideal Use Cases 💡 | Key Advantages ⭐ |
|---|---|---|---|---|---|
| Horizontal Support and Resistance Breakouts | Low – simple entry/exit, subjective level identification | Low – basic chart reading and volume data | Moderate to high – momentum continuation | All timeframes, all market conditions | Easy to understand, clear risk levels |
| Triangle Pattern Breakouts | Medium – requires pattern recognition over weeks | Medium – trendlines, volume, and patience | Moderate – reliable continuation, measurable targets | Trend following, medium-term setups | Clear signals, measurable profit targets |
| Channel Breakout Strategy | Medium – needs drawing parallel trendlines | Medium – multiple touchpoint validation | Moderate to high – trend continuation or change | Trending stocks, commodities, forex majors | Multiple opportunities, strong moves |
| Flag and Pennant Breakouts | Low to medium – short, quick patterns | Low – volume and pattern identification | High – strong momentum continuation | Short-term, strong trending moves | High success rate, quick formation |
| Volume Breakout Strategy | Medium – volume and price combined analysis | Medium to high – real-time volume monitoring | High – filters false breakouts, confirms moves | All timeframes, institution-driven breakouts | Higher probability, reduces false signals |
| News-Driven Breakout Strategy | High – combines fundamental and technical analysis | High – constant news and volatility monitoring | High – explosive moves with fundamental backing | Event-driven, volatile markets | Strong catalysts, reduced false breakout risk |
| Bollinger Band Squeeze Breakouts | Medium – uses volatility contraction indicators | Medium – Bollinger Bands and confirmation tools | Moderate – captures beginnings of major moves | Any timeframe, volatile or consolidating markets | Objective entries, works in various conditions |
| Multi-Timeframe Breakout Strategy | High – requires alignment across multiple timeframes | High – multiple charts and in-depth analysis | Very high – reduces false signals, higher conviction | Trend alignment, higher probability setups | Better risk management, fewer whipsaws |
From Theory to Execution: Your Path to Mastering Breakouts
We have navigated the dynamic landscape of breakout trading, dissecting nine powerful strategies that form the bedrock of many successful trading careers. From the foundational clarity of horizontal support and resistance breaks to the nuanced timing of Bollinger Band squeezes, a powerful, unifying principle has emerged. True success with breakout trading strategies is not about finding a single "holy grail" pattern; it is about building a robust, evidence-based framework for market analysis.
Each strategy we've explored, whether it's a classic flag pattern or a volume-confirmed channel break, provides a unique piece of the market puzzle. However, their real potency is unleashed when they are layered together. The most compelling trading opportunities arise at the confluence of these techniques. Imagine spotting a perfect ascending triangle on the 4-hour chart. Now, what if that same pattern is also showing a significant volume spike, breaking out in the direction of the dominant trend on the daily chart? This is the difference between a speculative guess and a high-probability trade setup.
The Core Pillars of Successful Breakout Trading
To transition from theoretical knowledge to consistent execution, internalize these core pillars. They are the non-negotiable principles that separate amateur traders from seasoned professionals.
- Patience in Consolidation: The most explosive moves are born from periods of quiet indecision. Your first job as a breakout trader is not to trade, but to wait. Learn to identify and respect ranges, triangles, and channels, understanding that the longer the market consolidates, the more significant the eventual breakout is likely to be.
- Conviction Through Confirmation: A price move alone is just noise. A price move accompanied by a surge in volume is a statement of intent from the market. Volume confirmation is your primary tool for filtering out weak, unreliable "false breaks" or "head fakes." Never treat it as an afterthought; it is a critical component of your entry criteria.
- Risk as Your First Priority: Before you even consider potential profits, your first question must always be, "Where am I wrong?" Defining your stop-loss based on the market structure you are trading is paramount. Whether it's below a broken resistance level or outside the boundary of a channel, your stop-loss is your ultimate safety net. It protects your capital and allows you to survive to trade another day.
Your Actionable Path Forward
Knowledge without action is merely entertainment. To truly master these concepts, you must immerse yourself in practical application. Here are your next steps:
- Become a Chart Historian: Open your trading platform and go back in time. Scroll through historical charts of your favorite assets and actively hunt for the patterns we've discussed. Mark up every triangle, flag, and channel breakout you can find. Note what the successful ones had in common, and more importantly, what the failed ones looked like.
- Paper Trade with Purpose: Select one or two strategies that resonate most with you. Do not try to master all nine at once. Open a demo account and trade only those specific setups. Your goal isn't to make fake money; it's to build a flawless execution process, from entry and stop-loss placement to trade management.
- Develop a Trading Journal: Document everything. Screenshot your setups before, during, and after the trade. Record your entry price, stop-loss, take-profit, and the rationale behind the trade. This journal will become your single most valuable learning tool, revealing your personal strengths and weaknesses with unflinching honesty.
Ultimately, mastering breakout trading strategies is a journey toward reading the pure language of the market: price action. It’s about stripping away the noise of lagging indicators and focusing on the raw narrative of supply and demand. By developing this skill, you are not just learning a strategy; you are building a lasting and adaptable edge that can serve you across any market and any timeframe.
Ready to accelerate your learning curve with a proven, price-action-focused approach? The programs at Colibri Trader are designed to teach you how to read the market's story directly from the charts, just like the professional strategies we've discussed. Learn more about our comprehensive trading education at Colibri Trader.