


The Best Way to Learn Day Trading A Realistic Price-Action Guide
Before you even think about placing your first trade, we need to have a blunt, honest conversation. The Instagram posts of traders on yachts and the promise of "financial freedom" from a laptop paint a very misleading picture. It’s an incredibly seductive dream, but it often masks a brutal reality.
The truth is, most people who try day trading fail. They jump in, treat the market like a Vegas slot machine, and get wiped out faster than they can say "margin call."
Confronting the Reality of Day Trading
Let's look at the cold, hard numbers. They're not pretty. Studies show that only around 13% of traders manage to stay consistently profitable over a six-month period. Stretch that out to five years, and the number plummets to a mere 1%.
These aren't just abstract figures; they represent real people who lost real money. This is exactly why the "best way to learn" involves rigorous, simulated practice and a deep educational dive before you even consider risking a single dollar. If you want to dig deeper into these figures, you can explore more about these day trading statistics and see what separates the winners from the rest.
Why Do Most Traders Lose Money?
The reasons for failure are almost always the same, and they're rarely about the market being "rigged." They're self-inflicted wounds. Learning to trade successfully is really just learning to avoid these common, costly mistakes.
The classic account-killers include:
- No Real Education: Diving in without a clear, tested strategy. Many traders just click buttons based on a gut feeling or a tip from a chat room.
- Zero Risk Management: This is the big one. They risk way too much on a single trade, don't use stop-losses, and one bad position blows up their entire account.
- Trading on Emotion: Greed makes them hold a winner too long, and fear makes them sell at the worst possible time. They abandon their plan the second things get uncomfortable.
- Wild Expectations: They think huge, consistent profits should happen overnight. They haven't put in the screen time or the study required to build a real skill.
The market is a mirror. It reflects your discipline, your patience, and your emotional control. If you are a mess internally, your trading account will reflect it. Success isn't about finding some magic indicator; it's about mastering yourself.
This guide is built to tackle these failure points head-on. I'm not here to sell you a dream of easy money. My goal is to give you a realistic, step-by-step roadmap for building a durable skill set, grounded in price action, ironclad risk management, and structured practice.
This professional approach is your best defense against becoming another statistic. It’s the only reliable path I know to long-term success.
Learning to Read the Market with Price Action
This is where your real trading education begins. Forget those charts you’ve seen, cluttered with a dozen different indicators, oscillators, and acronyms. That’s the fast track to confusion. We’re going to ignore all of that noise.
The best way to learn day trading is to focus on the purest, most direct source of market information there is: price action.
Price action is simply the movement of price over time. Instead of relying on lagging indicators that are just old price data run through a formula, you’ll learn to read the story the market is telling you, candle by candle. Every tick up or down is a footprint left by the ongoing battle between buyers and sellers.
The Language of Candlesticks
Each candlestick on your chart is a snapshot of market psychology. It’s not just a red or green bar; it tells you where the price opened, where it closed, and the highest and lowest points it reached within that timeframe.
Learning to read these candles is like learning a new language. A long wick at the top, for example, isn't just a shape. It’s a story. It tells you that buyers tried to push the price higher, but sellers came in with overwhelming force and slammed it back down. That's a story of rejection and a potential clue that momentum is about to shift.
To really get this down, you need to understand the nuances of how to read price action, which breaks these concepts down in much more detail. This skill isn't optional; it's the foundation of a real trading career.
Think of indicators as someone telling you a secondhand story about what happened in the market yesterday. Price action is like watching the events unfold live, directly from the source. You get the pure, unfiltered truth.
Identifying Key Market Structure
Once you can read individual candles, the next step is to see how they come together to form the market’s broader structure. The market doesn’t move in straight lines. It ebbs and flows, creating areas where buyers and sellers agree—or disagree—on value. We call these areas support and resistance.
- Support: A price level where a downtrend tends to pause. This happens because there's a concentration of buying interest, creating a sort of floor that the price struggles to break through.
- Resistance: The opposite of support. This is a price level where an uptrend often stalls out, hit by a wall of selling pressure. Think of it as a ceiling.
Crucially, these are not exact lines but zones. Price will often poke through these levels before reversing. Your job as a price action trader is to first identify these critical zones on higher timeframes (like the daily or 4-hour chart). Then, you watch for specific candlestick patterns to form as price tests them, giving you a high-probability signal to enter a trade.
Imagine a stock is approaching a major resistance zone that has held firm for weeks. An amateur might short it immediately. A professional waits. If a massive bearish engulfing candle forms right at that zone, that's the confirmation. It tells you sellers are in control, and the trade has a much higher chance of working out.
Classic Chart Patterns and Their Meaning
As groups of candles form over time, they create recognizable patterns that show up again and again, across all markets and timeframes. These patterns are the visual representation of mass market psychology.
To tie it all together, here is a quick-reference guide to the essential concepts that form the bedrock of price action analysis.
Core Price Action Concepts for New Traders
| Concept | What It Reveals About the Market | Why It Is Crucial for Your Trading |
|---|---|---|
| Candlestick Patterns | The immediate psychology and momentum between buyers and sellers within a specific timeframe. | Provides high-probability entry signals at key levels, such as a pin bar showing rejection. |
| Support & Resistance | Key price zones where supply and demand have historically been strong, acting as floors and ceilings. | Helps you identify logical areas to place stop-losses and set profit targets for a trade. |
| Trend Analysis | The overall direction of the market (higher highs and higher lows for an uptrend; lower highs and lower lows for a downtrend). | Ensures you are trading with the dominant market flow, which dramatically increases your odds of success. |
| Chart Patterns | Larger formations like flags, wedges, and head and shoulders that signal potential continuation or reversal of a trend. | Offers a broader context for your trades, allowing you to anticipate bigger market moves. |
Learning to spot a "bull flag," for instance, isn't just about recognizing a shape. It's about understanding the story: the market is in a strong uptrend and is currently taking a breather (consolidating) before its next likely push higher. This insight allows you to position yourself for that next leg up with a clearly defined risk level.
By focusing your energy on this clean, powerful framework, you base every decision on what the market is actually doing, not what a lagging indicator thinks it might do. This is the core of a professional approach and the most effective way to build a lasting edge.
Honing Your Skills in a Simulated Environment
Knowing the theory of price action is one thing, but executing a trade flawlessly when real money and raw emotions are on the line? That's an entirely different beast.
This brings us to the most crucial phase of your development: simulated trading. So many aspiring traders get impatient and blow right past this step, thinking it's a waste of time. Trust me, that's a catastrophic, account-ending mistake.
Think of it this way: no pilot would ever dream of flying a real jet without logging hundreds of hours in a flight simulator first. The stock market is just as unforgiving. Your simulated, or paper trading, account is your personal training dojo—a place to build skill, test strategies, and make every mistake imaginable without losing a single dollar.
To get a better sense of how you'll apply your knowledge here, this flowchart breaks down the core process of reading price action, from individual candlesticks to broader market zones.
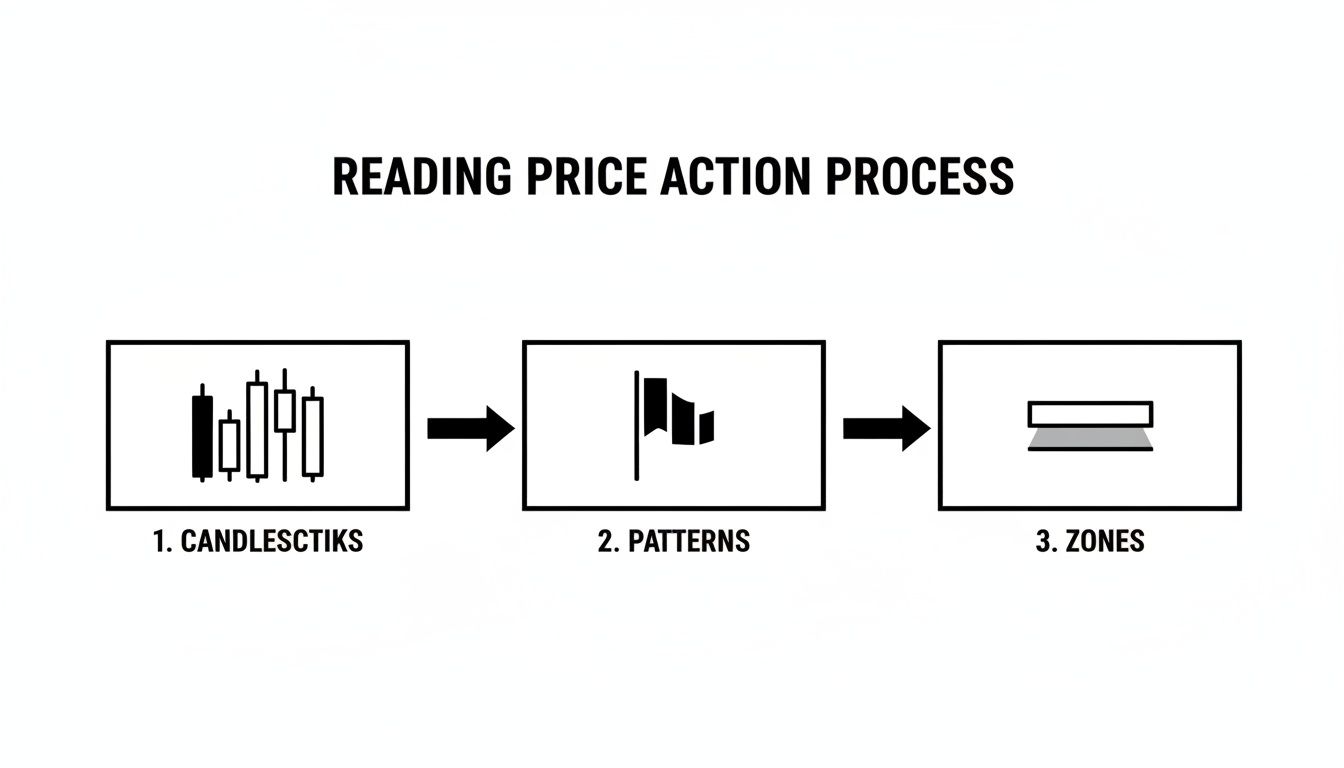
**, which explains the process in detail.
A Structured Approach to Practice
Simply placing random trades won't get you anywhere. You need a structured plan for your time in the simulator. This phase is your opportunity to gather cold, hard data on your own performance and refine your edge.
Your practice should be built around three core activities:
- Developing a Daily Routine: Show up at the same time every day, just as you would for a job. Do your pre-market analysis, identify potential setups based on your price action strategy, and execute your plan.
- Meticulous Trade Journaling: Log every single simulated trade. Record the setup, your reason for entry, the exit point, and a screenshot of the chart. Most importantly, write down the emotions you felt during the trade. This is non-negotiable.
- Consistent Backtesting: Use your platform’s tools to go back in time and "trade" your strategy over historical price data. This is an incredible way to quickly gather hundreds of examples of your setups and build rock-solid confidence in your system's effectiveness.
The data backs this approach up completely. Experts strongly recommend building skills over several months in a simulated environment. One analysis revealed that traders who practiced this way for 6-12 months before going live had retention rates 40% higher than novices who jumped straight in. The most successful traders, those in the elusive 1-4% bracket, often log over 1,000 simulated hours, diligently backtest strategies, and maintain a detailed journal.
Setting Your Graduation Criteria
So, how do you know when you're ready to move on from the simulator? The answer is simple: data. Your trading journal is your report card, and you cannot graduate to live trading until you have proven, objective evidence that you are consistently profitable.
Set clear, non-negotiable goals for yourself. For example, your criteria to go live might be:
- Achieve a net positive return for three consecutive months.
- Maintain a win rate above 50% on at least 100 trades.
- Execute your trading plan with 95% accuracy, meaning no emotional or impulsive trades.
This process can't be rushed. It will likely take several months, and for many, it can take over a year. But this period of disciplined practice is the single greatest investment you can make in your trading career. It’s where you build the foundation that will support you through the inevitable challenges of the live market, all without risking a cent of your capital.
Building Your Ironclad Risk Management Rules
If a winning price action strategy is the engine of your trading business, then your risk management is the unbreakable frame holding it all together. You can have the best engine in the world, but it's worthless if the whole thing can fall apart at the first bump in the road.
This is the single biggest separator between pros who last for years and gamblers who are gone in a month. Protecting your capital isn't just part of the job—it's Job #1. Making money comes second. You have to adopt a defensive mindset first, ensuring you can survive the inevitable losing streaks to trade another day.
The Non-Negotiable 1 Percent Rule
Let's start with the cornerstone of your entire risk plan: the 1% Rule. It's simple, powerful, and absolutely not up for debate.
You will never risk more than 1% of your total account balance on a single trade. Period.
Have a $10,000 account? The absolute most you can lose on any given trade is $100. If your account grows to $12,000, your max risk ticks up to $120. This rule is your circuit breaker. It forces discipline and prevents the kind of catastrophic loss that emotionally and financially cripples new traders.
This defensive posture is what keeps you in the game long enough to find your footing and let your edge play out. It turns a potential account-ending disaster into just a small, manageable loss—a simple cost of doing business.
Calculating Your Position Size Correctly
Amateur traders often just buy a random number of shares that "feels right." Professionals don't guess. They calculate their position size for every single trade based on their stop-loss and that non-negotiable 1% rule. This is how you control risk with precision.
Here’s the simple formula you need to burn into your brain:
Position Size = (Total Account Value x 1%) / (Entry Price – Stop-Loss Price)
Let's walk through a real-world scenario. Imagine you're eyeing a setup:
- Account Size: $20,000
- Max Risk (1%): $200
- Stock: XYZ Corp
- Entry Price: You plan to buy at $50.00
- Stop-Loss Price: You've identified a key support level and place your stop-loss just below it at $49.50
- Risk Per Share: $50.00 – $49.50 = $0.50
Now, you plug it into the formula: $200 / $0.50 = 400 shares.
You would buy 400 shares of XYZ. If the trade turns against you and hits your stop, you will lose exactly $200 (plus commissions), which is precisely 1% of your account. This systematic approach strips emotion and guesswork out of the equation.
The market will give you endless opportunities to make money, but it only takes one catastrophic loss to take you out of the game permanently. Your first and most important job is to ensure that one loss never happens.
Prioritizing a Favorable Risk-to-Reward Ratio
Okay, so you've learned to cap your downside. The final piece of the puzzle is making sure the potential upside justifies the risk you're taking.
Before you ever click the "buy" button, you have to ask: "Is the potential profit significantly greater than my potential loss?"
A common minimum standard is a 2:1 risk-to-reward (R:R) ratio. This simply means for every $1 you risk, you are aiming to make at least $2 in profit.
Let's use our previous example:
- Your risk is $0.50 per share.
- To get a 2:1 R:R, your profit target must be at least $1.00 above your entry price ($0.50 risk x 2).
- Your profit target should be set at or above $51.00.
This isn't just theory; it's how profitable traders operate. Statistics from industry research show that 88% of successful traders consistently use stop-loss orders, and 62% emphasize position sizing as a core pillar of their strategy. By building these habits, you're not just trading—you're aligning yourself with the practices of pros.
For more details on these findings, you can read the full research about day trader success metrics.
Using a Trading Journal to Accelerate Your Growth
You can’t fix what you don’t track. A journal turns each trade—good or bad—into actionable insights, and bridges the gap between guessing and true skill.

Logging profit and loss alone won’t cut it. The real breakthrough comes when you dig into the motives behind every move.
What a Professional Journal Tracks
Think of your journal as a performance database. The more context you capture, the sharper your edge becomes. Try tools with quick capture and note-taking features to keep every detail within reach.
Every entry should cover:
- The Setup: Why did this opportunity stand out? Attach a chart screenshot and highlight your key levels.
- Entry Rationale: Which precise price-action trigger initiated your position?
- Exit Rationale: What pulled you out? A profit target, a stop-loss, or a sudden emotion?
- Emotional State: Were you calm, anxious, or chasing FOMO at entry and exit? Be brutally honest.
- Potential Improvements: Once the trade closes, note what could have gone smoother.
A journal isn’t a diary of feelings; it’s a lens on your habits. By converting opinions into data, you expose patterns you’d otherwise miss.
These notes keep you honest. They’ll flag if frustration drives you past your rules or if your strongest setups cluster at certain times of day.
The Weekly Review Process
Data alone won’t change your trading. It’s during the weekly recap—when you set aside distraction—that real progress happens.
Bulleting every flaw and every win lets you spot trends:
- Are you clipping winners too early?
- Do fear-driven stop adjustments eat into profits?
- Do losses cycle around the same setup?
From there, sketch out a simple action plan to address each issue in the week ahead. For a turn-key format, check out the Excel-based trading journal template. This structured review habit is hands-down the fastest way to sharpen your edge and speed up your learning curve.
Making the Cautious Transition to Live Trading
Alright, you've proven you can be consistently profitable in a sim account. The numbers don't lie. But now, the real test begins. Making the jump to live trading isn’t a leap of faith; it's a careful, measured step into a completely different arena.
I can't overstate this: the psychological shift when your own hard-earned money is on the line is intense. It changes everything.
Your first live account should be funded with an amount you are 100% prepared to lose. This isn't being pessimistic; it's the mindset of a professional. Think of this initial capital as your tuition for the final, most important part of your trading education. By mentally writing it off before you even place a trade, you start to neutralize the emotional power that fear and greed have over your decisions.
Managing the Psychological Pressure
The biggest challenge from here on out isn't your strategy—you've already proven that works. The battle is now inside your own head. The emotional weight of watching a real P&L swing into the red feels profoundly different than seeing a simulated loss.
Your heart will race. You’ll feel a visceral urge to break your rules, maybe by snatching a small profit on a winning trade way too early, terrified it will turn against you. Or worse, you'll hold onto a losing trade, praying it will come back, because closing it makes the loss real. This is the crucible where true discipline is forged.
The key is to start ridiculously small. Even if your tested trading plan calls for a 1% risk per trade, I'd strongly recommend cutting your position size down by 50-75% for at least your first month of live trading. Your goal right now isn't to make big money. It's simply to get your sea legs and acclimate to the emotional storm of executing with real capital.
This transition is the final exam of your initial training. It’s where you prove that the discipline you built over months of practice can withstand the raw, unfiltered emotions of the live market. Treat it with the respect it deserves.
The Learning Never Stops
Going live isn't the finish line; it’s the real starting line of your professional career. The learning curve only gets steeper from this point forward. This is often when traders who are serious about their craft seek out mentors or join dedicated trading communities to continue sharpening their edge.
Ultimately, treating this journey like a full-time job—with daily 4-6 hour sessions over the course of a year—is what separates the vast majority who fail from the tiny fraction who succeed. Research shows that only around 4% of traders with mentors and sufficient capital ever sustain a living from the markets. The work is just beginning.
Common Questions New Day Traders Ask
When you're just starting out, a handful of questions always seem to pop up. Getting straight answers to these can save you a ton of time and money, and more importantly, set your expectations right from the very beginning. Let's tackle the big ones I hear all the time.
How Much Money Do I Actually Need to Start?
This is easily the most common question, and it has two different answers: the legal one and the practical one.
First, the legal stuff. In the United States, if you're classified as a "pattern day trader" (PDT), you're required by law to keep a minimum of $25,000 in your account. This rule kicks in if you make more than three day trades within a five-day trading period.
But the practical answer is what really matters for a beginner. You should only ever start with capital you are 100% prepared to lose. For most new traders, this is somewhere in the $1,000 to $5,000 range. Yes, this is under the PDT rule, but it's a smart amount. It’s enough to let you practice with real skin in the game—and feel the very real emotional pressure that comes with it—while keeping your initial risk manageable.
How Long Does It Realistically Take to Become Profitable?
Forget the flashy ads promising overnight riches. The reality of trading is a slow grind, not a lottery win.
You should plan to spend a bare minimum of 6 to 12 months trading in a simulator. This isn't just about learning the buttons; it's about proving to yourself that your strategy has an edge and that you have the discipline to follow it. Only then should you even think about putting real money on the line.
From that point, finding consistent profitability can easily take another one to two years, sometimes even longer. This journey is a marathon. Success is built over years of dedicated screen time, meticulous review, and learning from mistakes—not weeks of lucky guesses.
Trading is the best and most expensive self-development program you will ever enroll in. The market magnifies all of your emotions and serves as a mirror to reflect on firsthand. In order to succeed, you need good control of your emotions and discipline.
Can You Learn to Day Trade on Your Own?
It's definitely possible, but man, it is a tough, lonely, and expensive road. The learning curve is incredibly steep, and the market provides feedback in the most brutal way possible: by taking your money.
Frankly, the best way to learn day trading is usually a mix of dedicated self-study and some form of structured guidance.
There's no shortage of information out there, but the real challenge is finding a clear, logical path to follow. Seeing how structured learning is applied in other markets, like in guides such as The Ultimate UK Starter Guide to Learn Crypto Trading, highlights the value of a roadmap. A good combination of quality education, mentorship, and a community of other serious traders can dramatically shorten your learning curve and help you sidestep the pitfalls that wipe out most beginners. The journey is yours, but you don't have to walk it completely alone.
At Colibri Trader, we provide a clear, no-nonsense path to mastering price action. Our programs are built to give you the skills and discipline needed to trade confidently, without relying on confusing indicators. Discover your trading potential by visiting us at https://www.colibritrader.com.