


Master the Bearish Pennant Pattern for Successful Trading
Decoding the Bearish Pennant Pattern

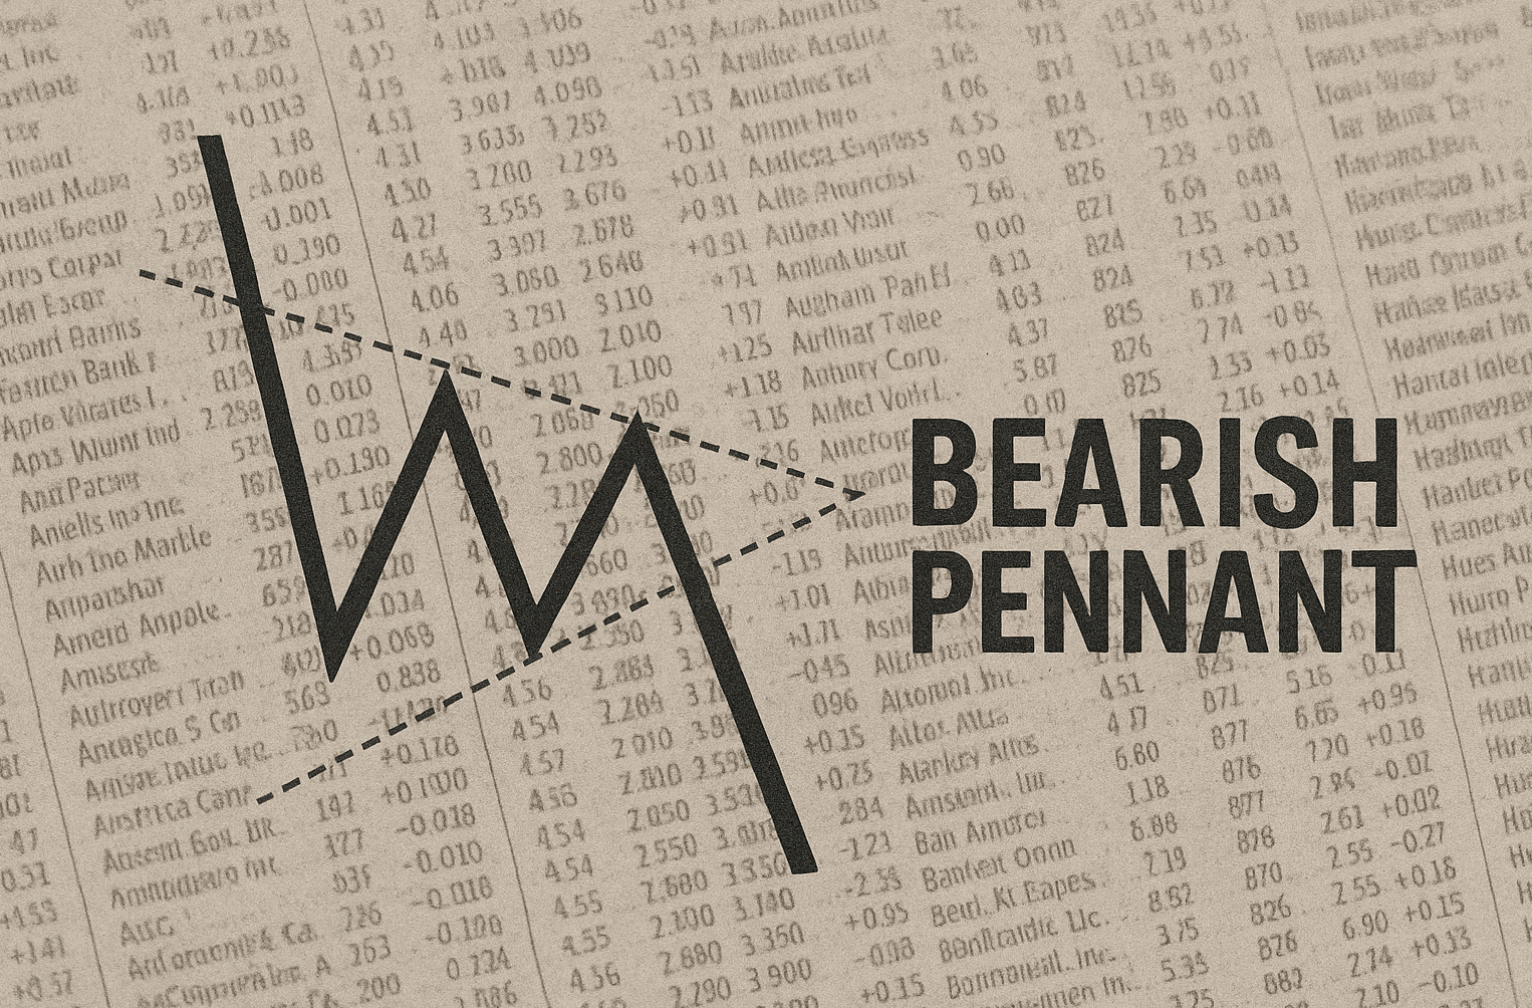
The bearish pennant pattern offers traders valuable insight into potential downtrend continuations. This pattern signifies a pause, a brief period of market indecision, before the downward momentum resumes. It’s like a short ceasefire where sellers regroup and prepare for the next push lower.
This pause allows sellers to consolidate and new sellers to enter the market, often leading to a substantial price drop. Understanding this pattern is essential for navigating market complexities.
Understanding the Psychology Behind the Pattern
The bearish pennant reflects a particular market psychology. The initial sharp drop (the flagpole) is followed by a period of consolidation, as sellers pause. However, this consolidation doesn’t signal a trend reversal. It often indicates a gathering of sellers before the downtrend resumes.
This consolidation appears as a triangular shape, narrowing as buyers and sellers briefly balance. Once this balance breaks, selling pressure typically pushes the price down, resuming the downtrend. This pattern is especially relevant in volatile markets marked by sharp movements and consolidation periods.
Key Characteristics of a Bearish Pennant
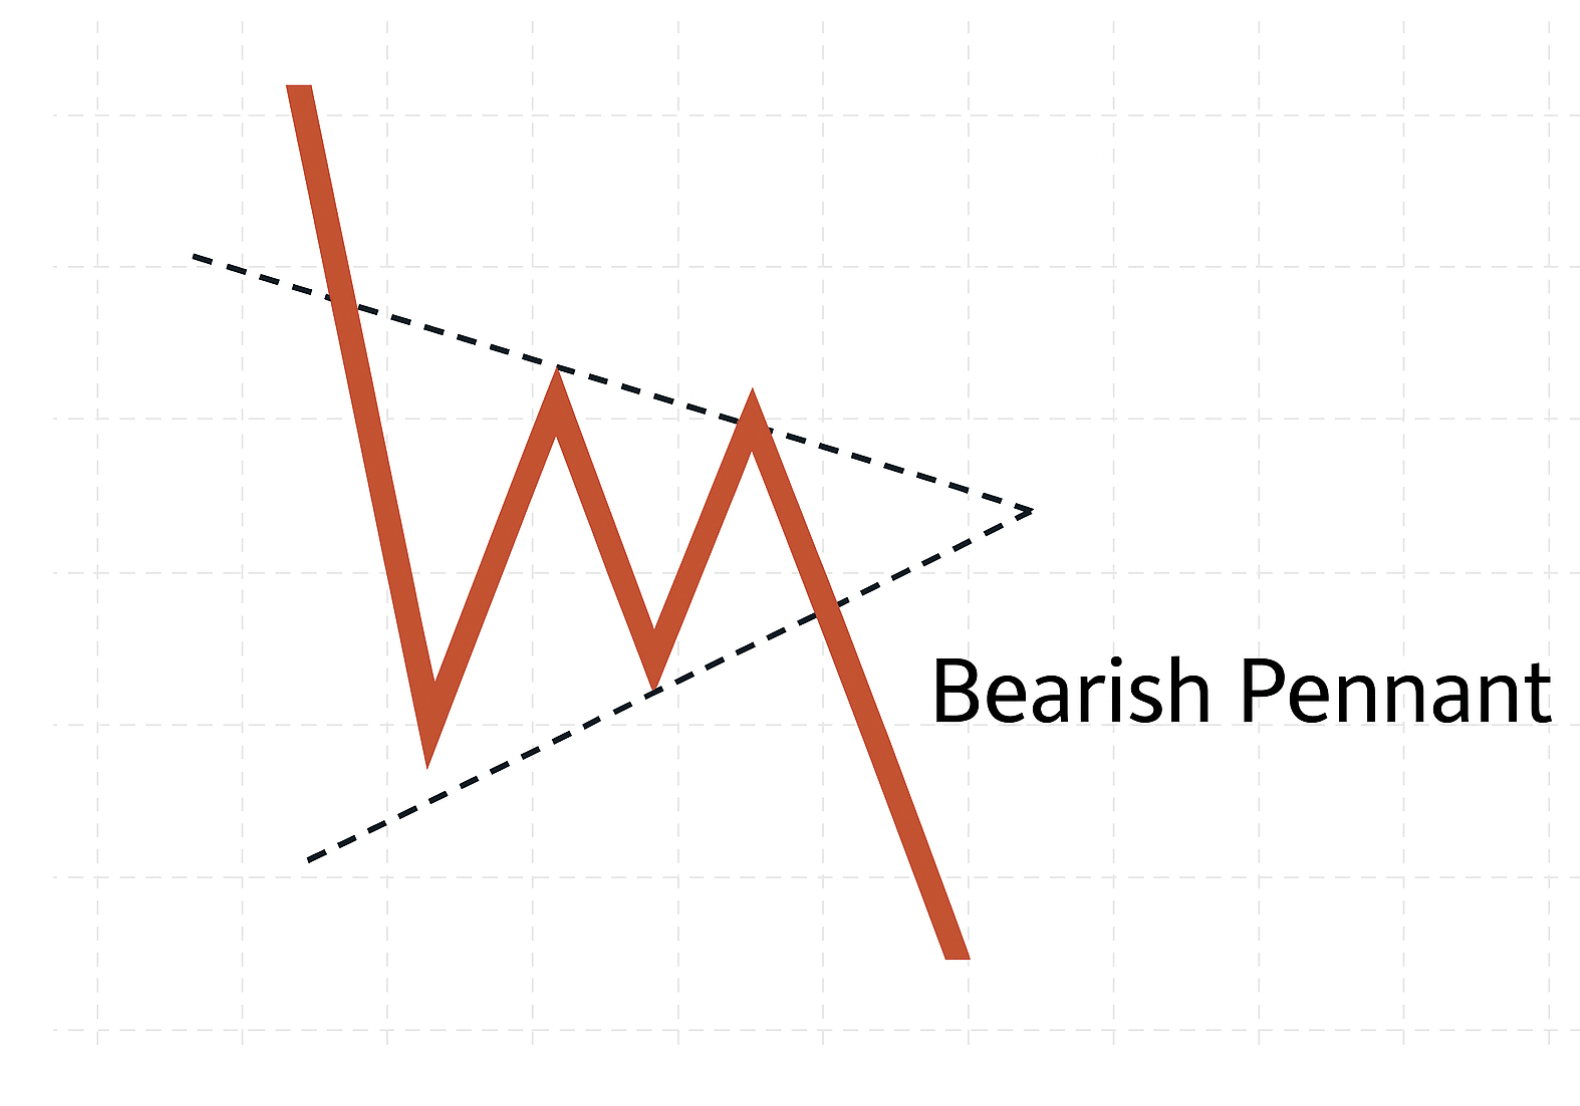
A bearish pennant has two defining features: the flagpole and the pennant. The flagpole is the initial steep price decline, showcasing strong selling pressure. The pennant follows, a consolidation period marked by converging trendlines that form a symmetrical triangle.
These lines represent the narrowing price range as buyers and sellers struggle for control. The bearish pennant is vital in technical analysis, especially for traders anticipating a downtrend continuation. It often signals growing investor concern about a potential downward trend.
For example, prices in a falling pennant move within a narrowing, converging range. A breakout below this pattern signals a likely downtrend continuation. This presents opportunities for short selling or buying put options.
The target price is usually calculated by subtracting the pattern’s height from the breakout price. Trading volume typically decreases during pennant formation, then increases on the breakout, confirming the downtrend’s resumption.
Differentiating Pennants From Other Patterns
While bearish pennants resemble flags and wedges, key differences exist. Bearish flags show parallel trendlines during consolidation, like a rectangle tilted against the trend. Wedges, however, have converging trendlines, but with a steeper slope than pennants, suggesting faster price changes.
These differences in shape and structure are important for interpreting the pattern. Recognizing these nuances helps traders accurately identify bearish pennants and use them effectively. Mastering these distinctions allows for better anticipation of market moves and more informed trading decisions.
Spotting Perfect Bearish Pennant Formations
Identifying a true bearish pennant pattern amidst market fluctuations is crucial for successful trading. This skill helps distinguish experienced traders from those just starting out. Understanding chart patterns is key to identifying potential trading opportunities. A good starting point is to familiarize yourself with common day trading chart patterns. This section provides a step-by-step guide used by professional traders to locate high-probability setups using the bearish pennant.
Identifying Key Components of the Pattern
The first step is identifying the critical elements of a bearish pennant. It begins with a sharp, decisive downtrend, known as the flagpole, which signifies substantial selling pressure. After this, the market enters a period of consolidation called the pennant. This phase is marked by converging trendlines that create a symmetrical triangle shape.
Another element to watch is trading volume. Volume usually decreases during pennant formation, reflecting a temporary equilibrium between buyers and sellers. However, this balance is typically fleeting. The decreased volume highlights the market’s uncertainty during consolidation. A subsequent volume increase when the price breaks below the lower trendline often confirms the downtrend’s resumption, indicating that sellers have regained control.
Distinguishing Pennants From Similar Patterns
It’s essential to distinguish bearish pennants from similar patterns, such as flags and wedges. Bearish flags have parallel trendlines during consolidation, resembling a rectangle tilted against the current trend. Wedges, conversely, have converging trendlines like pennants, but at a steeper angle, indicating faster price movements.
These subtle differences are crucial for accurate pattern recognition. Confusing a pennant with a flag or wedge could lead to misinterpreting market signals and potentially entering trades at inopportune moments. A solid understanding of these differences enables traders to make well-informed decisions.
Using Data Charts for Confirmation
Analyzing data charts offers deeper insights into identifying genuine bearish pennants. The chart below visualizes the performance characteristics of bearish pennants under various market conditions.
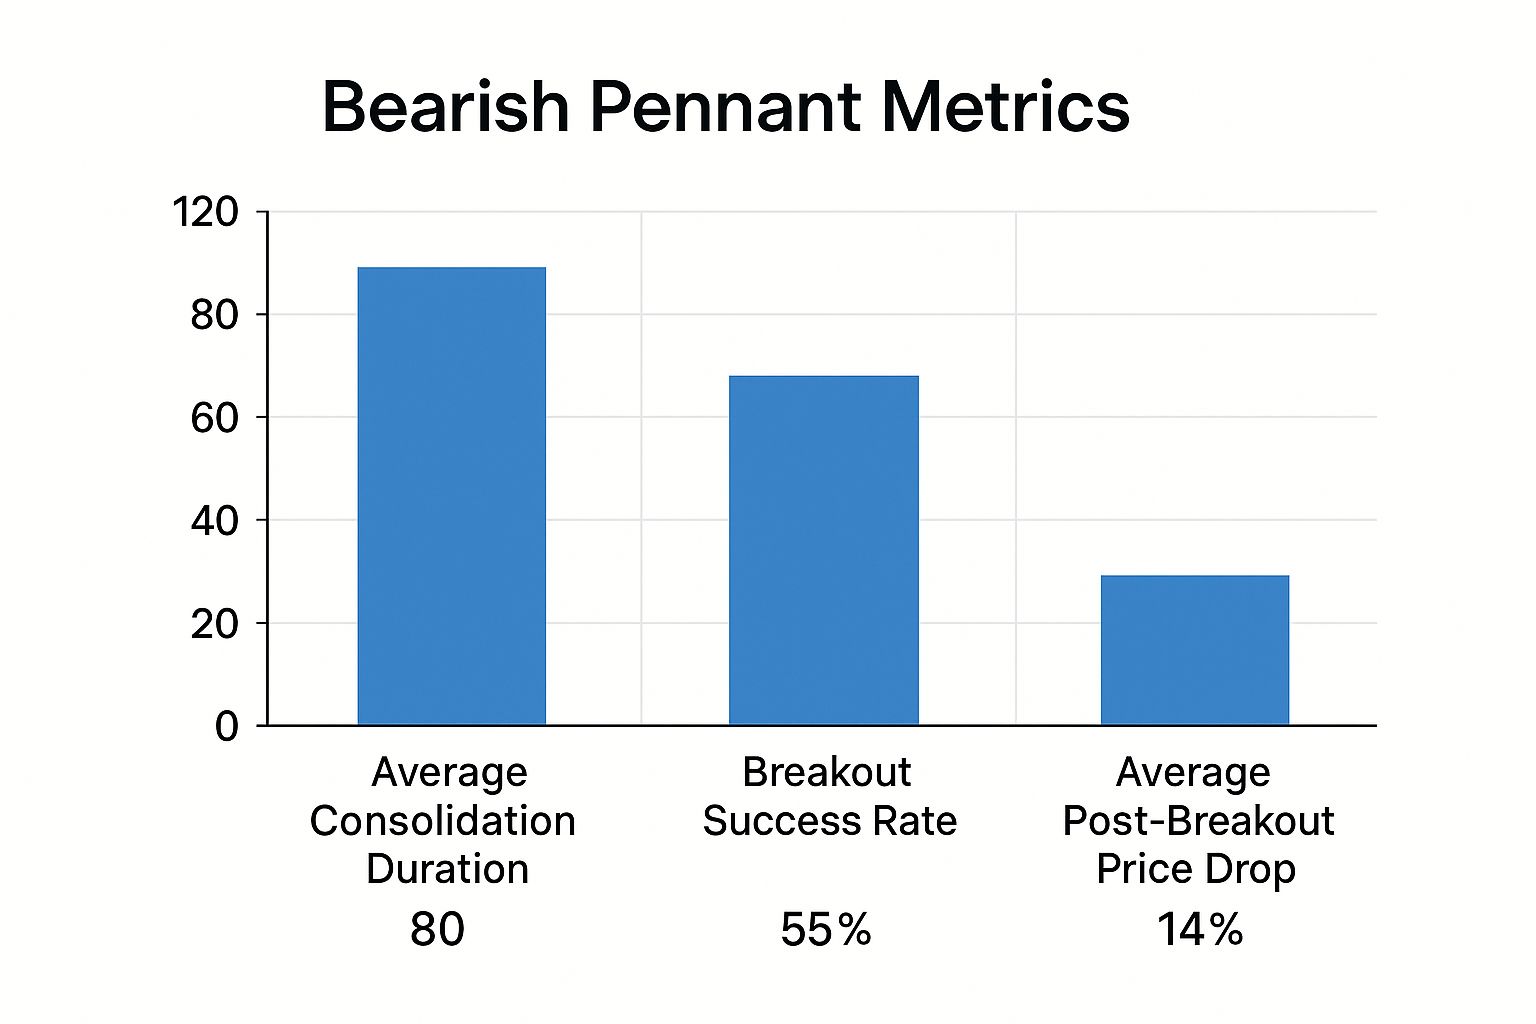
The data chart reveals that bearish pennants have a 55% success rate in reaching the projected price target after a breakout. The average price movement after a breakout is 10%, with 70% of breakouts occurring within the first three days of the pennant forming. It’s important to acknowledge the 45% failure rate, which emphasizes the need to confirm the pattern with other indicators and practice careful risk management. Notice that the success rate increases to 65% when the breakout coincides with a volume spike exceeding 20% of the average volume during pennant formation, underscoring the importance of volume as a confirmation signal. This data provides traders with realistic expectations for bearish pennant trades.
To help identify bearish pennants more effectively, consider the following checklist:
Bearish Pennant Identification Checklist
| Criteria | Description | Reliability Score (1-5) |
|---|---|---|
| Sharp Downtrend (Flagpole) | A clear and decisive downtrend preceding the pennant formation. | 5 |
| Converging Trendlines (Pennant) | Two trendlines that converge to form a symmetrical triangle during consolidation. | 4 |
| Decreasing Volume | Contracting volume during the pennant formation. | 3 |
| Breakout with Volume Increase | Price breaking below the lower trendline accompanied by a surge in volume. | 5 |
This table summarizes the key characteristics of a bearish pennant and provides a reliability score for each element. A higher score indicates greater importance and reliability. Using this checklist alongside chart analysis can help traders improve their ability to identify and trade bearish pennants effectively.
This data-driven approach allows for a more objective assessment of the pattern’s reliability and potential, improving your chances of spotting perfect bearish pennant formations and capitalizing on potential trading opportunities. By combining this statistical understanding with chart analysis, traders can increase their likelihood of success when trading bearish pennants.
Real-World Performance of Bearish Pennants

Bearish pennants are tempting patterns for traders looking for downward price action. But, moving beyond textbook examples to understand their real-world performance is crucial. It’s about understanding the actual probability of a successful trade, not just identifying the pattern. So, what does the data say about how reliable bearish pennants are?
Analyzing Success and Failure Rates
Looking at historical performance helps set realistic expectations. This requires analyzing both wins and losses. The success rate for downside breakouts from bearish pennants is about 55.19%, with a 44.81% failure rate. Even with a successful breakout, these patterns reach their projected price target only about 60% of the time. This reinforces the importance of risk management and other confirming factors in your trading plan.
These statistics aren’t static and can shift depending on the market. A one-size-fits-all approach based solely on textbook examples won’t cut it.
Impact of Market Conditions on Performance
Market context significantly influences bearish pennant effectiveness. They often underperform in low-volume or consolidating markets. In a sideways market without a clear trend, a bearish pennant breakout can quickly fizzle out, creating a false signal.
Similarly, bearish pennants struggle against the prevailing trend. A bearish pennant during a strong uptrend is more likely a false signal than a continuation pattern. Recognizing these market dynamics is crucial for trading bearish pennants effectively.
Enhancing Reliability With Advanced Analysis
Experienced traders use advanced technical analysis tools like TradingView to enhance reliability and mitigate risk. These tools offer further confirmation and help weed out false signals. For instance, integrating volume analysis, momentum indicators, or other chart patterns can boost the probability of a winning trade.
Understanding market context and sentiment is equally vital. Analyzing news, economic data, and market sentiment can add valuable insight. By combining these approaches, traders gain a more comprehensive view of bearish pennant performance in real-world trading. This informed perspective helps navigate market complexity and improve trading outcomes.
Bearish Pennant Trades That Delivered Major Profits

Examining successful bearish pennant pattern trades provides valuable lessons for traders of all levels. This section explores real-world examples, demonstrating how this pattern can lead to tangible profits. By studying these cases, you can improve your ability to spot high-probability setups and refine your trading strategy.
A Textbook Example: Profiting From a Classic Pennant
Imagine a stock experiencing a sharp drop. This drop forms the “flagpole” of the bearish pennant. Following this decline, the price consolidates, bouncing between converging trendlines. This consolidation creates the “pennant” shape. A trader observing this would anticipate a breakout below the lower trendline.
Once the breakout occurs, ideally with increasing volume, a short position is entered. The stop-loss order would be placed just above the pennant’s upper trendline. The profit target is determined by the length of the flagpole, projected downwards from the breakout point. This classic setup can often generate substantial returns when the price hits the target.
Pennants and Market Events
Bearish pennants can be particularly effective during significant market events. For example, during times of economic uncertainty, a stock may experience a sharp fall followed by a pennant formation. A skilled trader would recognize this and understand the potential.
They might adjust their position size given the higher volatility. A wider stop-loss might be used to account for potential price swings. However, the potential reward during these periods can be considerable, as market events can magnify price movements after a breakout.
Petrobras in Early 2024: A Real-World Case
A notable example of a bearish pennant pattern occurred with Petrobras stock (PBR) in early 2024. On February 2nd, PBR experienced a sharp decline, followed by a brief recovery. The price then consolidated, forming a pennant. By February 5th, the price broke down from the pattern, falling from around $17.13 to $16.74.
This breakdown occurred with increased volume, confirming the bearish continuation. The pattern’s impact was amplified when Petrobras’ stock plummeted more than 10% after a dividend announcement. This demonstrates how technical patterns can be reinforced by fundamental news. The bearish pennant provided a useful signal for traders anticipating further declines.
Combining Pennants With Other Indicators
While effective on its own, the bearish pennant’s accuracy improves when combined with other technical indicators. The Relative Strength Index (RSI), for example, helps identify overbought or oversold conditions, adding confirmation to a potential breakout.
Furthermore, tracking volume is crucial. A breakout with surging volume strengthens the signal, indicating increased conviction in the price movement. By incorporating these additional tools, traders can enhance their ability to identify high-probability bearish pennant setups. These examples illustrate the potential of the bearish pennant pattern for generating profits. By studying real-world scenarios and applying the insights gained, traders can enhance their pattern recognition skills and improve their trading strategies.
Battle-Tested Bearish Pennant Trading Strategies
After identifying a bearish pennant pattern, the next step is understanding how to profit from it. This involves selecting the right strategies, managing risk, and adapting to market conditions. This section explores various trading approaches used by professional traders to capitalize on bearish pennant patterns.
Aggressive Vs. Conservative Entry Strategies
Traders can choose between an aggressive or a conservative entry strategy. An aggressive entry involves shorting the asset as soon as the price breaks below the pennant’s lower trendline. This approach aims to maximize profits by capturing the initial downward momentum. However, it also increases the risk of encountering false breakouts.
A conservative entry demands additional confirmation before entering a trade. Traders might wait for a candlestick close below the lower trendline or increased trading volume accompanying the breakout. This approach minimizes the risk of false signals but could mean sacrificing some initial profit potential. The ideal strategy depends on individual risk tolerance and market conditions.
Calculating Entry Points, Stop-Loss, and Profit Targets
Precisely calculating entry points, stop-loss levels, and profit targets is crucial. The optimal entry point for a conservative trader is usually slightly below the lower trendline, post-breakout confirmation. For aggressive traders, it’s at the break of the lower trendline.
The stop-loss order is typically placed just above the pennant’s upper trendline to limit potential losses if the price reverses. The profit target is often calculated by measuring the “flagpole” (the initial downtrend preceding the pennant) and projecting that distance downwards from the breakout point.
Position Sizing and Multiple Time Frame Analysis
Successful traders adjust their position sizing based on the bearish pennant’s reliability and overall market conditions. Smaller positions mitigate risk in volatile markets. Conversely, larger positions might be justified in strongly trending markets with a clear bearish bias.
Analyzing multiple timeframes can improve trade success. A bearish pennant on a daily chart is strengthened if it aligns with a weekly chart downtrend. This multi-timeframe confirmation suggests a higher probability of a sustained downward move.
Adapting to Market Volatility and Supporting Indicators
Adapting to changing market conditions is vital. Volatility and other technical indicators should be considered. During periods of high volatility, wider stop-loss orders might be needed.
Using supporting indicators like the Relative Strength Index (RSI) or volume indicators can provide valuable insights. For example, bearish RSI divergence during pennant formation, or a volume spike on the breakout, can reinforce the bearish signal.
Let’s examine a comparison of the two strategies:
Bearish Pennant Strategy Comparison
Comparison of conservative versus aggressive trading strategies for bearish pennant patterns
| Strategy Element | Conservative Approach | Aggressive Approach | Best For |
|---|---|---|---|
| Entry | After breakout confirmation and/or candlestick close below lower trendline | At the break of the lower trendline | Risk-averse traders/Volatile markets |
| Stop-Loss | Above the upper trendline | Above the upper trendline (potentially tighter) | All traders |
| Profit Target | Based on flagpole measurement | Based on flagpole measurement (potentially larger target) | All traders |
| Position Sizing | Smaller in volatile markets, larger in strong trends | Larger in strong trends, smaller in volatile markets | All traders |
This table highlights the core differences between conservative and aggressive approaches. Selecting the appropriate strategy depends on individual trading style, risk tolerance, and market conditions. Understanding these strategies and adapting to different market scenarios can significantly enhance a trader’s ability to profit from bearish pennant patterns.
Avoiding Costly Mistakes in Pennant Trading
Even experienced traders can stumble when navigating the complexities of bearish pennant patterns. This section explores common pitfalls, informed by insights from professional traders, and provides strategies to help you tackle these challenging patterns.
The Danger of Premature Entries
One of the most frequent mistakes is entering a trade before the bearish pennant pattern fully forms. Jumping the gun before a confirmed break below the lower trendline can lead to losses if the expected breakout fails to occur. Patience and discipline are essential; wait for a verified breakout accompanied by increased volume before entering a trade.
Improper Position Sizing and Risk Management
Another common error is mismanaging position sizing. Allocating too much capital to a single pennant trade exposes you to substantial losses if the pattern doesn’t play out as anticipated. Consider overall market conditions and your personal risk tolerance. A smaller position size is often more prudent, especially in volatile markets.
In addition to position sizing, setting a proper stop-loss order is vital. This order should be placed strategically, typically just above the upper trendline of the pennant. This acts as a safety net, limiting potential losses if the price unexpectedly reverses.
The Difficulty of Discerning Genuine Patterns
Correctly identifying true bearish pennants from similar, but distinct, formations is paramount. Mistaking a bearish flag or a wedge for a pennant can generate false signals and result in poorly timed entries. A bearish flag features parallel trendlines, while a wedge displays converging trendlines with a steeper slope than a pennant. Grasping these subtle differences can prevent costly errors.
Ignoring Shifting Market Conditions and Fundamental Factors
Market dynamics can shift rapidly, invalidating a seemingly ideal bearish pennant setup. Overlooking broader market trends or disregarding fundamental factors can also lead to missteps. For example, a bearish pennant appearing during a strong uptrend might indicate a pause rather than a continuation signal. Major news events or shifts in fundamentals can override technical patterns. Stay informed about market sentiment and any potential fundamental influences.
Learning From Past Mistakes: Case Studies
Reviewing past trades that resulted in losses offers invaluable learning opportunities. Consider a scenario where a trader initiated a short position based on a bearish pennant, only to see the price reverse and break out above the upper trendline. Analyzing such instances can reveal areas for improvement, such as stricter adherence to breakout confirmations or better stop-loss placement. Learning from past mistakes is key to enhancing trading outcomes and safeguarding your capital.
Key Takeaways for Avoiding Pennant Trading Mistakes
Here’s a summary of key points to remember:
- Confirm Breakout: Wait for a clear break below the lower trendline with corresponding increased volume.
- Manage Risk: Implement appropriate position sizing and establish a stop-loss order just above the upper trendline.
- Accurate Identification: Carefully differentiate bearish pennants from similar patterns like flags and wedges.
- Market Awareness: Account for the broader market context and potential fundamental influences.
- Learn From the Past: Analyze previous mistakes to refine your trading strategies.
By understanding these common errors and applying the recommended strategies, you can substantially improve your ability to trade bearish pennant patterns effectively and minimize potential losses. Ready to improve your trading and strive for consistent profits? Colibri Trader’s price-action based approach provides the skills and confidence you need. Explore our price action-based program and enhance your trading performance today.