


Mastering Bear Trap Trading A Price Action Guide

Bear trap trading is one of my core price-action strategies, and for good reason. It’s all about spotting a failed breakdown below a key support level and using it to your advantage.
In simple terms, it's a market fake-out. Sellers get lured into short positions, thinking a new downtrend is starting, only for the price to whip back aggressively. This sudden reversal traps them, forcing them to buy back their shorts, which just adds more fuel to a powerful move higher.
Understanding Bear Traps and Why They Matter

Let's cut right to it. A bear trap isn't just random market noise; it's a classic fake-out designed to shake out weak hands and trick sellers into shorting a breakdown. But here’s the key: it happens for a reason. These moves are a hallmark of trending markets and are often driven by institutional buying and raw crowd psychology.
Think of these moves as deliberately deceptive. Big financial institutions need massive liquidity to build their long positions without sending the price soaring prematurely. A bear trap is the perfect way to get it. They nudge the price just below a widely-watched support level, which triggers a flood of sell orders from retail traders and hits the stop-loss orders of existing longs.
Once that pool of selling liquidity appears, the institutions swoop in and absorb it all, filling their buy orders at great prices. This sudden injection of institutional buying power is what sparks the sharp, V-shaped reversal that defines the pattern. All those traders who sold the breakdown are now "trapped" in losing positions. Their eventual rush to buy-to-cover only accelerates the rally.
The Psychology Behind the Trap
To trade these effectively, you have to understand the emotional engine driving them. The pattern masterfully exploits two of the most powerful forces in trading: fear and greed.
- Fear of Missing Out (FOMO): Sellers see a support level give way and pile in short, terrified of missing the next big down-move.
- Panic Selling: Traders who were already long see their stop-losses get triggered and panic-sell their positions, adding even more downward pressure.
- Crowd Mentality: As more people sell, it creates a feedback loop that convinces even more traders that the breakdown is real.
This is exactly where a disciplined approach, grounded in pure price action, becomes your greatest asset. Instead of getting swept up in the initial noise, a trained trader waits for confirmation. Learning what price action trading truly means is the first step to seeing the market with genuine clarity. You learn to read the story the chart is telling, not just the single event of a broken support line.
Why Most Breakdowns Fail
Here’s a simple truth: in a healthy uptrend, the path of least resistance is up. The underlying buying pressure from long-term players is simply stronger than any temporary selling squall.
In fact, one study of major global indices revealed that roughly 61% of apparent downside breaks in bull markets were actually traps, not genuine trend reversals. This really drives home why a structured, confirmation-first approach is so critical. You can dig into more of these findings on bull and bear trap frequency over at incrediblecharts.com.
A bear trap isn't just a pattern; it's a story of institutional power meeting retail panic. Your job as a price action trader is to side with the institutions, not the crowd.
By focusing on the market structure and the price reaction after the break, you can start to see these traps not as a threat, but as a high-probability opportunity to go long against the trapped sellers.
Bear Trap vs Real Breakdown Key Differences
It's crucial to distinguish a trap from a real, sustainable breakdown. New traders often confuse the two, leading to costly mistakes. This quick table breaks down the key differences I look for on the chart.
| Characteristic | Bear Trap (False Breakdown) | Real Breakdown (Continuation) |
|---|---|---|
| Volume Profile | Initial break has low or average volume, then spikes on reversal. | High, convincing volume on the breakdown candle. |
| Follow-Through | No bearish follow-through; price quickly reclaims the support level. | Strong bearish candles close below the support level on subsequent bars. |
| Reversal Candle | A strong bullish candle (e.g., engulfing, pin bar) forms quickly. | Price continues to drift or consolidate lower with weak bounces. |
| Market Context | Occurs within an established uptrend or a strong support zone. | Often happens after a period of distribution or a clear trend change. |
Remember, the volume and the speed of the rejection are your biggest clues. A real breakdown feels heavy and persistent, while a bear trap is a sharp, violent fake-out. Learning to feel that difference is a huge part of mastering this setup.
How to Spot a Bear Trap with Price Action
Forget about trying to predict a bear trap with lagging indicators like RSI or MACD. By the time they flash a signal, the real move is usually long gone. The only way to spot a trap as it’s happening is to learn how to read the raw language of the market: price action.
This means you need to focus on the story the candlesticks are telling you, moment by moment, within the bigger picture. A bear trap isn't just a single event; it's a specific sequence of price action that unfolds in a way that you can learn to anticipate. The key is knowing what to look for and, just as important, having the discipline to wait for the full story to play out before you jump in.
The Anatomy of the Trap
A classic bear trap trading setup unfolds in three distinct phases that you can see right on your chart. Getting good at identifying these phases as they form is the first step to trading them profitably.
-
An Established Uptrend and Clear Support: First, you need a market that is clearly moving up. Look for a series of higher highs and higher lows. Within that uptrend, you need to pinpoint a clear horizontal support level—a price floor that the market has tested and respected multiple times. This support level is crucial because it's what everyone, from retail traders to institutions, is watching.
-
The Aggressive Break Below Support: Next comes the trap itself. The price suddenly slices through this well-defined support level. This move often looks sharp and convincing, and it's designed to do two things: trigger the stop-loss orders from existing long positions and sucker in breakout sellers who think the uptrend is finally over.
-
The Violent Rejection and Reclaim: This is the most important part of the setup. Instead of continuing its downward slide, the price violently rejects the move. It whips back around and trades back above the broken support level, often within just a few candles. This quick reclaim is your flashing sign that the sellers have been trapped.
Reading the Reversal Candlesticks
The real magic of spotting a bear trap is in the specific candlestick patterns that form right after that support level breaks. These candles are telling you that the sellers who shoved the price down have run out of gas, and that buyers are rushing back in with overwhelming force.
Some of the most powerful reversal signals you'll see are:
- Bullish Engulfing Bar: This is a big, powerful bullish candle that completely "engulfs" the body of the previous bearish candle. It shows an immediate and decisive shift in momentum from selling to buying.
- Pin Bar (or Hammer): You'll see a candle with a long lower wick and a small body near the top. This tells you that sellers tried to push the price way down, but buyers stepped in with enough force to drive it all the way back up by the time the candle closed.
- Inside Bar Fakeout: Sometimes, after the break, the price will pause and form a small inside bar (a candle completely within the range of the previous one) before exploding back to the upside.
Price action isn't just about memorizing patterns; it's about understanding the psychology of the fight between buyers and sellers at critical levels. A strong bullish reversal candle right at a broken support level is the market screaming that the bears have lost control.
Context is everything. While bear traps have their own unique character, deepening your understanding of individual candlestick signals can sharpen your price action skills. For instance, knowing a bearish hammer candlestick pattern is useful. Even though it's named "bearish," the principle of rejection it demonstrates is universal and helps you build a more complete picture of price behavior at key levels.
The Role of Volume and Momentum
While price is always king, volume can be a fantastic confirmation tool. A classic bear trap often kicks off with a spike in volume on the breakdown candle—that’s all the stop-losses getting triggered.
But the real tell is a massive surge in volume on the bullish reversal candle. This is a huge clue that institutional players are stepping in, absorbing all those sell orders, and aggressively buying the dip. This is a core concept tied to how smart money operates, which you can explore more deeply by understanding the cycles of accumulation, manipulation, and distribution.
Research backs up the danger of jumping the gun. One 2017 analysis found that roughly 40% of perceived trend reversals in strong uptrends turned out to be bear traps. The data also showed that traders who act on potential reversals without waiting for confirmation are about 60% more likely to take a big hit compared to those who wait for more price-action proof. This really drives home the value of patience. Your job isn't to predict the trap; it's to react once you have confirmation that the trap has already been sprung.
A Practical Framework for Trading Bear Traps
Knowing how to spot a bear trap is only half the battle. To actually make money from this pattern, you need a disciplined, repeatable plan. This isn't about guesswork; it's about having a clear strategy for your entry, risk management, and profit-taking before you even think about placing a trade. This structure turns what looks like market chaos into a calculated, high-probability opportunity.
This flow chart breaks down the three core phases of a classic bear trap: a clear uptrend, a sharp break of a key support level, and the powerful bullish reversal that springs the trap shut.
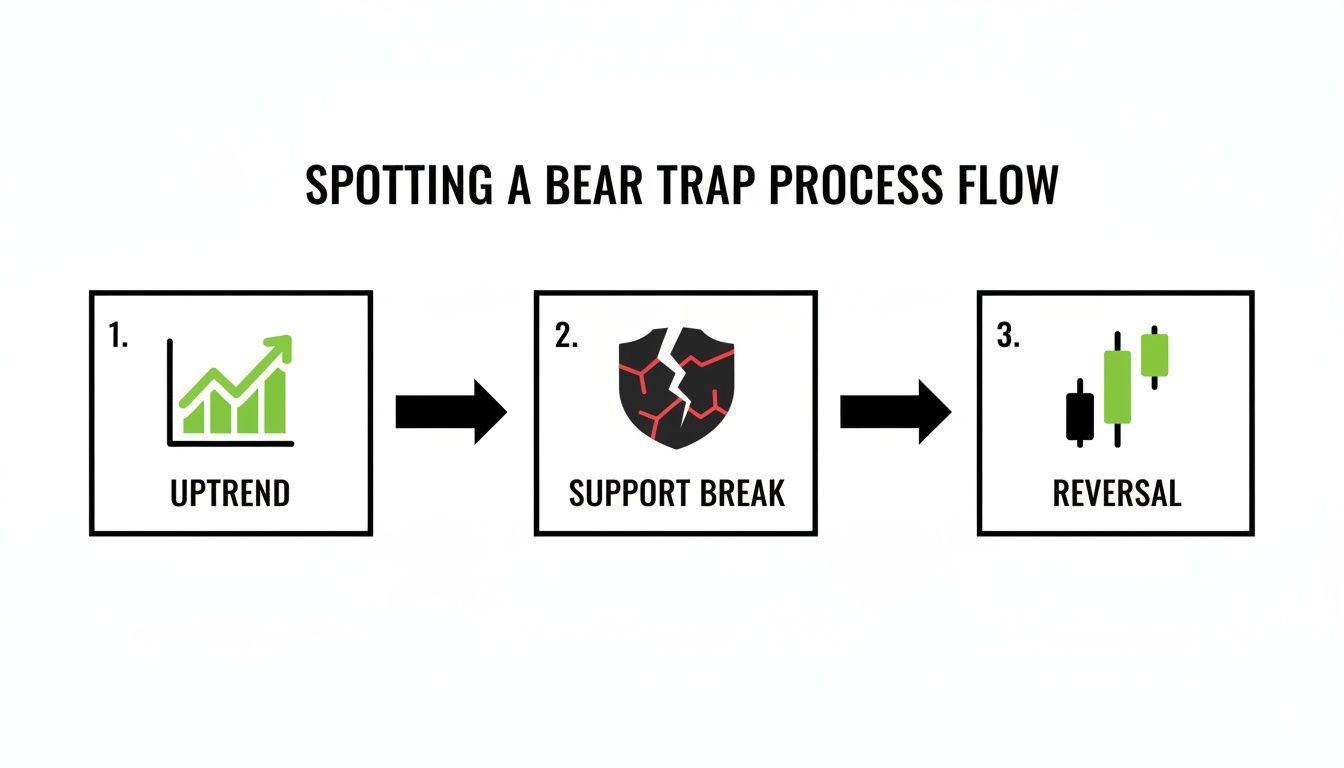
The diagram really highlights why patience is so crucial. The real trading opportunity only shows up after the reversal confirms the trap, not during the initial breakdown.
Pinpointing Your Entry Trigger
The single biggest mistake I see traders make is jumping into a long position way too early. You absolutely have to wait for the market to prove the breakdown was false. Buying while the price is still struggling below the support level is pure gambling. Your entry trigger needs to be objective and non-negotiable.
A classic, reliable entry signal is a strong candle close back above the broken support level. This is your confirmation. It tells you that buyers have wrestled back control and the sellers who shorted the breakdown are now officially trapped.
For instance, picture a stock in a solid uptrend with support at $100. It suddenly dips to $98, slicing through that support. Amateur traders might try to "buy the dip" at $98.50, hoping for a quick bounce. A disciplined price-action trader, however, waits. They only even consider going long after a candle closes decisively back above the $100 mark, maybe at $100.50.
This patient approach ensures you aren't trying to catch a falling knife. You're entering on confirmed strength, not perceived weakness.
Setting a Protective Stop Loss
Every trade needs an escape plan. The beauty of trading a bear trap is that your stop-loss placement is logical and obvious. It should go just below the low of the reversal candle—the very bottom of the wick that formed the trap.
This placement serves a critical purpose. The entire premise of your trade is that this reversal low will hold as the new pivot point. If the price breaks below that low, your trade idea is proven wrong, and you need to get out immediately to protect your capital.
Your stop loss isn't just a number; it's the specific point on the chart where your trade thesis is invalidated. Placing it correctly is the bedrock of sound risk management.
Let's go back to our example. If the low of the reversal candle (after the break of $100) was at $97.80, you’d place your stop loss slightly below that, perhaps at $97.70. This gives the trade a tiny bit of breathing room while defining your maximum risk right from the start. Understanding the mechanics of how to set a smart stop loss and take profit is a non-negotiable skill for any serious trader.
Here’s why this method is so effective:
- It’s Objective: The low is a clear price point on the chart. No emotion, no guesswork.
- It’s Logical: The trade is based on the reversal holding firm. If it fails, the reason for the trade is gone.
- It Defines Your Risk: You know exactly how much you stand to lose before you ever click "buy."
Whatever you do, never place your stop right at the support level you just reclaimed. Market noise can easily push the price back down to test that level, stopping you out prematurely right before the real move gets going.
Defining Realistic Profit Targets
Once you're in the trade with your risk defined, the final piece of the puzzle is knowing when to take your profits. The most logical place to set a target is at the next significant resistance level. A bear trap often signals the end of a correction, meaning the price is likely to resume its original uptrend.
Scan your chart to the left of your entry point. Look for previous swing highs, old consolidation zones, or any other areas where the price has struggled to advance in the past. These are natural magnets where sellers might step back in, making them perfect spots to cash out.
Avoid getting greedy. Aiming for a brand new all-time high might sound exciting, but it’s often unrealistic. A much more practical approach is to target a risk-to-reward ratio of at least 1:2. This simply means your potential profit should be at least twice your potential loss.
Let's finish our example:
- Entry: $100.50
- Stop Loss: $97.70
- Risk: $2.80 per share
Your first profit target should be at least ($2.80 x 2) = $5.60 above your entry price. This puts your target at $106.10. Now, you look at the chart. If there’s a clear resistance level sitting around $106 or $107, that becomes an excellent, data-driven profit target for your trade.
By following this complete framework, you remove emotion and replace it with a structured, repeatable process.
Real-World Bear Trap Trading Examples
Theory is great, but the real learning happens when you see a trading plan unfold in the wild. Let's step away from the abstract and break down some actual bear trap setups I've seen play out across different markets. This is where we put our price action rules to the test.
Each case study dissects the trade from start to finish—from spotting the initial context to managing the final exit. You'll see how patience and a disciplined eye for confirmation are what really separate profitable traders from the herd that gets trapped. This isn't about finding perfect textbook patterns; it’s about applying a solid process to the messy reality of live charts.
The Classic Bitcoin Short Squeeze
If you're looking for a perfect hunting ground for bear traps, look no further than the crypto markets. Their high volatility and heavy retail involvement are a potent mix. Combine that with leverage and emotional decision-making, and you get explosive reversals when sellers get caught leaning the wrong way. A textbook example of this unfolded in early 2023.
Around late February and early March 2023, Bitcoin (BTC) set up a classic bear trap. After a strong rally pushed it above the $25,000 level, momentum started to fade. The price then began selling off hard, breaking below key short-term support. The move looked incredibly convincing, sucking in sellers who were sure a much deeper bear market was kicking off.
But then, BTC violently reversed. The price didn't just find its footing; it aggressively shot back up, reclaiming the broken support levels and printing powerful bullish engulfing candles. This rapid reversal forced all those late short-sellers to buy back their positions at a loss, which only added fuel to the fire and triggered a massive short squeeze. The financial pain for reactive sellers was immense, but for patient price action traders, the opportunity was just as huge.
This is a recurring theme in volatile markets. If you look at exchange liquidation data from events like this, you'll often see hundreds of millions of dollars in short liquidations in just a 24 to 48-hour window. It's a stark illustration of the damage a well-executed bear trap can cause. You can find more analysis on the mechanics behind these moves and their impact on traders. Discover more insights about bear trap trading at TheTradingAnalyst.com.
A Forex Bear Trap in EUR/USD
The beauty of these principles is that they're universal. They work just as well in the world's largest financial market, Forex. Let's walk through a setup in the EUR/USD pair, where what looked like an obvious breakdown at a key daily support level turned into a high-probability long trade.
The Market Context
The big picture was clear: EUR/USD was in a solid daily uptrend, making a consistent series of higher highs and higher lows. The pair then pulled back to a well-defined horizontal support level around 1.0850. This wasn't just any level; it was an area that had held strong on several previous tests. Right there, we had our two essential ingredients: a clear trend and a significant support level that everyone was watching.
The Breakdown and Reversal
Then it happened. The price sliced right through the 1.0850 support with a big, ugly bearish candle, closing below it. That move undoubtedly triggered a flood of stop-loss orders from existing longs and lured in breakout sellers looking to ride the momentum down.
But the follow-through never came. Nothing. The very next daily candle was a massive bullish pin bar. Its long lower wick was a dead giveaway that sellers tried to push the price lower but were completely overwhelmed by a wave of buying pressure.
The most powerful signals often come not from the initial break, but from the market's immediate reaction to that break. A failure to follow through is, in itself, a massive piece of information.
The Trade Plan
This price action gave us a crystal-clear, actionable trading plan based on our framework:
- Entry Trigger: The entry was placed just a few pips above the high of that bullish pin bar. This is crucial—it ensures we're only getting in after the market confirms that buyers have wrestled back control.
- Stop Loss: A tight protective stop loss went just below the low of the pin bar's wick. This defined our risk precisely at the point where our entire trade idea would be proven wrong.
- Profit Target: The next logical area of resistance was a previous swing high. This spot was about 2.5 times the distance of our stop loss, offering an excellent risk-to-reward ratio.
The trade played out like a charm. Our entry was triggered on the next candle, and the price rallied straight to the profit target over the following week. It was a perfect demonstration of the power of siding with the trapped traders instead of following the initial breakout crowd.
Common Mistakes to Avoid in Bear Trap Trading

Knowing how to trade a pattern is one thing. Knowing how not to trade it is what keeps you in the game. The bear trap is a pattern that specifically preys on predictable, emotional reactions. If you want to side with the smart money, you have to avoid the pitfalls that make other traders their exit liquidity.
So many traders turn a high-probability setup into a frustrating loss simply by falling for the same costly errors. These aren't complex strategic blunders; they're basic lapses in discipline and patience. Let's walk through them so you can sidestep these traps yourself.
Impulsively Shorting the Breakdown
This is the most common mistake, and frankly, the most tempting one. A clear support level breaks. A big, red candle appears. The fear of missing out (FOMO) screams at you to get in. So, you jump in short, convinced the trend has flipped, only to watch in horror as the price snaps right back against you.
This is exactly what the trap is designed to do. Shorting that initial breakdown is nothing more than a guess. It's pure speculation, not calculated trading. At that moment, you have zero confirmation that sellers are actually in control.
How to fix it: Simple. Never act on the break itself. Your job as a price action trader is to wait for the market to show its hand. The real opportunity comes after the rejection, not during the initial panic.
Entering the Long Position Too Early
Just as dangerous as shorting too soon is trying to be a hero and buying too early. A trader spots the breakdown, correctly identifies it as a potential trap, and then rushes to enter a long position while the price is still weak below the broken support. They're trying to "catch the very bottom."
This is a gambler's mindset, not a trader's. There is absolutely no guarantee the price will reclaim that support level until it actually does. By jumping in prematurely, you open yourself up to another wave of selling that could push prices even lower, stopping you out for a needless loss right before the real reversal begins.
The professional trader doesn't predict; they react. Wait for a decisive, strong candle to close back above the key support level. This is your objective proof that buyers have regained control.
Setting Your Stop Loss Too Tight
Risk management is everything, but placing your stop loss in the wrong spot can be just as damaging as not using one at all. Many traders, thinking they're being conservative, will set their stop just a few pips below the reclaimed support level. In reality, they're just setting themselves up to be "wicked out" of a perfectly good trade.
Markets are noisy. It's incredibly common for price to dip back down and re-test that broken support level one last time before it finally takes off. A stop loss placed too close to this level will get triggered by this normal volatility, taking you out of your position moments before the profitable move you were waiting for.
How to fix it: Your stop loss must go below the low of the reversal candle—the absolute bottom of the entire trap formation. This is the only logical point on the chart where your trade idea is definitively proven wrong. Giving the trade this breathing room protects you from market noise while keeping your risk clearly defined.
A Few Questions Answered on Bear Trap Trading
When you’re digging into the nuances of price action, a few questions always pop up, especially with a tricky pattern like the bear trap. Let's tackle some of the most common ones I hear from traders.
My goal here is to give you answers grounded in pure price action—what the chart is actually telling you—not what some lagging indicator thinks might happen.
What Is the Difference Between a Bear Trap and a Pullback?
This is a big one, and it trips up a lot of traders. The distinction is absolutely critical.
A pullback is just the market taking a healthy breath. In an uptrend, it's an orderly dip that finds buyers at a logical spot, like a previous swing high or a key horizontal level. The overall market structure stays bullish.
A bear trap, on the other hand, is pure deception. It’s an aggressive, nasty break below a very obvious support level. It’s designed to violate the market structure, make everyone think the trend is reversing, and suck in sellers right at the bottom.
A pullback is a dip that respects support. A bear trap is a fake-out that obliterates support, only to viciously reclaim it moments later. The key is that violent rejection after the break—that's the trap snapping shut.
In simple terms, a pullback is a pause. A bear trap is a ploy.
Can Indicators Like RSI or MACD Help Identify Bear Traps?
Some traders try to use bullish divergence on indicators like the RSI or MACD to spot bear traps. I’ve found this to be unreliable and, more importantly, it's always late to the party.
Price action gives you the real-time story. An indicator might scream "oversold" while the price continues to plummet, giving you a handful of false or premature signals. You end up catching a falling knife.
The most reliable signal comes directly from the candlesticks at that moment of truth, right after support breaks. A massive bullish engulfing candle or a sharp pin bar tells you instantly that buyers have just steamrolled the sellers. That’s your signal.
Price is the source of truth. Indicators are just a derivative of it. Sticking to price action keeps your analysis clean, simple, and timely, which is exactly what you need for a fast-moving setup like a bear trap.
Are Bear Traps More Common in Certain Markets?
Yes, definitely. You can find bear traps in any market, but they are far more common in assets that are already in a clear, long-term uptrend. Think about bull runs in major stock indices, strongly trending currency pairs, or popular cryptocurrencies.
The reason is simple. In a strong uptrend, big institutions and other major players are looking for any excuse to buy more at a discount. They see those sharp, scary dips as a bargain.
Markets with a lot of retail and leveraged traders, like crypto, are especially fertile ground for nasty bear traps. You have this perfect storm of strong institutional buying interest clashing with emotional, panicked retail selling. That’s what creates these explosive reversals.
At Colibri Trader, we focus on mastering these exact price action dynamics. Our training is all about teaching the proven strategies that work in live markets, helping you build consistency and the freedom to trade from anywhere.