


Master the Bear Pennant Pattern | Expert Trading Guide

Picture a downhill skier, speeding down a steep slope, who carves into the mountain for a quick, tight turn before continuing the descent. That’s the perfect image for a bear pennant pattern on a trading chart.
It’s a classic signal in technical analysis that hints a market's downward trend is about to pick up steam again after a very short break. For traders with a bearish outlook, this is a key continuation pattern worth watching.
What Is a Bear Pennant Pattern
A bear pennant is a chart formation that acts like a signpost. It tells you that an existing downtrend has paused but is very likely to resume with fresh selling pressure. Think of it as the market catching its breath before the next leg down.
The pattern itself is made up of two distinct parts that, when read together, tell a story about what’s happening between buyers and sellers.
Key Components of the Pattern
First, you have the flagpole. This is a sharp, almost vertical price drop. This initial plunge shows aggressive selling as the bears grab firm control of the market. After this steep decline, the price action shifts into a consolidation phase, which forms the pennant.
This "pennant" is really just two converging trendlines that squeeze the price into a small, symmetrical triangle. This tightening range shows a brief moment of indecision—a quick battle between the last few buyers trying to hold the line and sellers who are just taking a short break.
Here's the breakdown:
- The Flagpole: A significant, fast price drop.
- The Pennant: A consolidation period with two trendlines squeezing closer together.
- Volume: A key tell is that trading volume usually dries up during the pennant formation.
To really get a feel for the structure, let's lay out the essential characteristics in a table.
Bear Pennant Pattern Key Characteristics
This table breaks down the core pieces of the bear pennant and what each one tells you about the market's state.
| Component | Description | Market Implication |
|---|---|---|
| Flagpole | A sharp, significant price drop preceding the pennant. | Represents the initial strong bearish momentum and selling pressure. |
| Pennant | A small symmetrical triangle formed by converging trendlines. | A brief consolidation or pause as bulls and bears find a temporary, unstable equilibrium. |
| Volume | Typically high during the flagpole, then diminishes during the pennant formation. | The drop in volume suggests the pause is temporary and not a true reversal. |
| Breakout | Price breaks below the pennant’s lower trendline, often on rising volume. | Signals the end of the pause and the likely resumption of the original downtrend. |
Seeing these components together helps paint a clearer picture of the market psychology at play. The story begins with aggressive selling, followed by a brief lull, and then points toward another potential drop.
Reliability and Real-World Performance
While the story a bear pennant tells is compelling, how does it actually hold up in the real world? It's a well-known formation, but its reliability as a standalone signal is something traders have debated for a long time. You have to look at the data to understand its true potential.
Extensive backtesting over decades, covering more than 1,600 trades, shows that the bear pennant pattern has a modest success rate of about 54%. This means the expected downward breakout fails to happen nearly half the time.
What's more, even when the pattern works as expected, the average price drop is only around 6%, which is pretty small compared to other, more powerful bearish patterns.
This historical data is a critical reality check. While the pattern is easy to spot, its failure rate of roughly 46% means you're dealing with a significant risk of false signals. If you want to dive deeper into this research and see what it means for your trading, you can discover more insights about these historical findings and how to manage the risks involved.
The Psychology Behind the Pattern

To really get the hang of the bear pennant pattern, you need to look past the lines on your chart and get inside the heads of the traders who are creating them. Technical patterns aren't just random shapes; they're pictures of a collective human battle between fear and greed, confidence and uncertainty.
The pattern kicks off with the flagpole, which tells a story of aggressive, decisive selling. This isn’t a slow, gentle slide. It’s a steep drop fueled by powerful bearish conviction. Fear often takes hold of the market here, as sellers completely overpower the buyers, shoving prices down fast. The momentum feels like it will never end.
Then, just as suddenly, the market hits the brakes. This is where the pennant itself begins to form.
The Moment of Conflict
The pennant phase is a short, tense standoff. The aggressive sellers who drove the price down take a breather, maybe to lock in some profits or just to see what happens next. At the same time, a small group of optimistic buyers—the "bottom-fishers"—jump in, hoping the sharp drop was an overreaction and that they've found a bargain.
This tug-of-war creates a period of consolidation where neither side is really in charge. The price coils up into a tight, symmetrical triangle as buying and selling pressure find a fragile, temporary balance. Volume usually dries up during this phase, signaling that nobody has strong conviction either way. It's like the market is holding its breath.
The consolidation inside a bear pennant is a psychological battlefield. It's that quiet moment of indecision where the market weighs whether the initial fear was justified or if a recovery is on the table.
This period of conflict is everything. It's a true test of wills. The converging trendlines show that the battleground is shrinking, which means a resolution is coming, and soon. The market simply can't stay coiled up forever. Keeping your own emotions in check during this phase is vital, and understanding the core ideas of trading psychology gives you a massive edge. To get your mindset right, you can learn more about how to master the mind and beat the market with practical trading psychology tips.
The Bearish Resolution
The final act in this psychological drama is the breakdown. When the price breaks below the pennant's lower support line, it's a crystal-clear signal that the sellers have won. The pause is over, the buyers couldn't rally enough strength for a reversal, and the original bearish sentiment roars back to life.
This breakdown often happens on a spike in volume, confirming that the bears are back in control with fresh energy. The psychology here is pretty straightforward:
- Sellers' Confirmation: The traders who sold during the flagpole see the breakdown as proof they were right and often add to their short positions.
- Buyers' Capitulation: Those hopeful buyers who got in during the pennant now realize their mistake. They sell to cut their losses, which just adds more fuel to the fire.
- New Shorts Enter: Sideline traders who were waiting for a clear signal see the confirmed pattern and jump in with new short positions.
This cascade of selling is what sends the price tumbling down, often with the same kind of force as the initial flagpole. When you grasp this human element, the bear pennant pattern transforms from a simple shape into a powerful tool for reading the market.
How to Identify a Genuine Bear Pennant
Spotting a consolidation after a sharp price drop is easy. But telling the difference between a genuine bear pennant pattern and just another market fake-out? That takes a sharp eye for detail. Not all pauses are created equal, you see. A true bear pennant has a specific anatomy that screams "high-probability continuation."
To move beyond just seeing shapes on a chart, you need a practical checklist. A valid pattern isn't just some triangle that forms after a drop; it’s a specific sequence of events that tells a clear story about market sentiment. Think of it like a detective gathering clues before coming to a conclusion.
The Essential Anatomy Checklist
A high-probability bear pennant setup has to tick a few critical boxes. If any of these elements are missing, the reliability of the pattern drops significantly. You could be walking straight into a trap set by the bulls.
Here’s what you need to look for:
- A Steep, Decisive Flagpole: The pattern must kick off with a strong, almost vertical drop in price. A slow, grinding decline just doesn't have the same psychological punch. This flagpole is the initial burst of selling pressure and fear that sets the whole stage.
- A Tight, Symmetrical Pennant: After that initial plunge, the price should settle into a small, symmetrical triangle with converging trendlines. This consolidation needs to be brief, usually lasting only a handful of trading sessions. A long, drawn-out consolidation often means buyers are gaining strength, not that bears are just taking a breather.
- A Short Consolidation Period: The pennant phase itself has to be relatively short. If the consolidation drags on for too long, it suggests that buyers are successfully soaking up all the selling pressure. This makes a reversal far more likely than a continuation of the downtrend.
The image below lays out these key stages perfectly, from the initial flagpole drop to the final breakout signal.
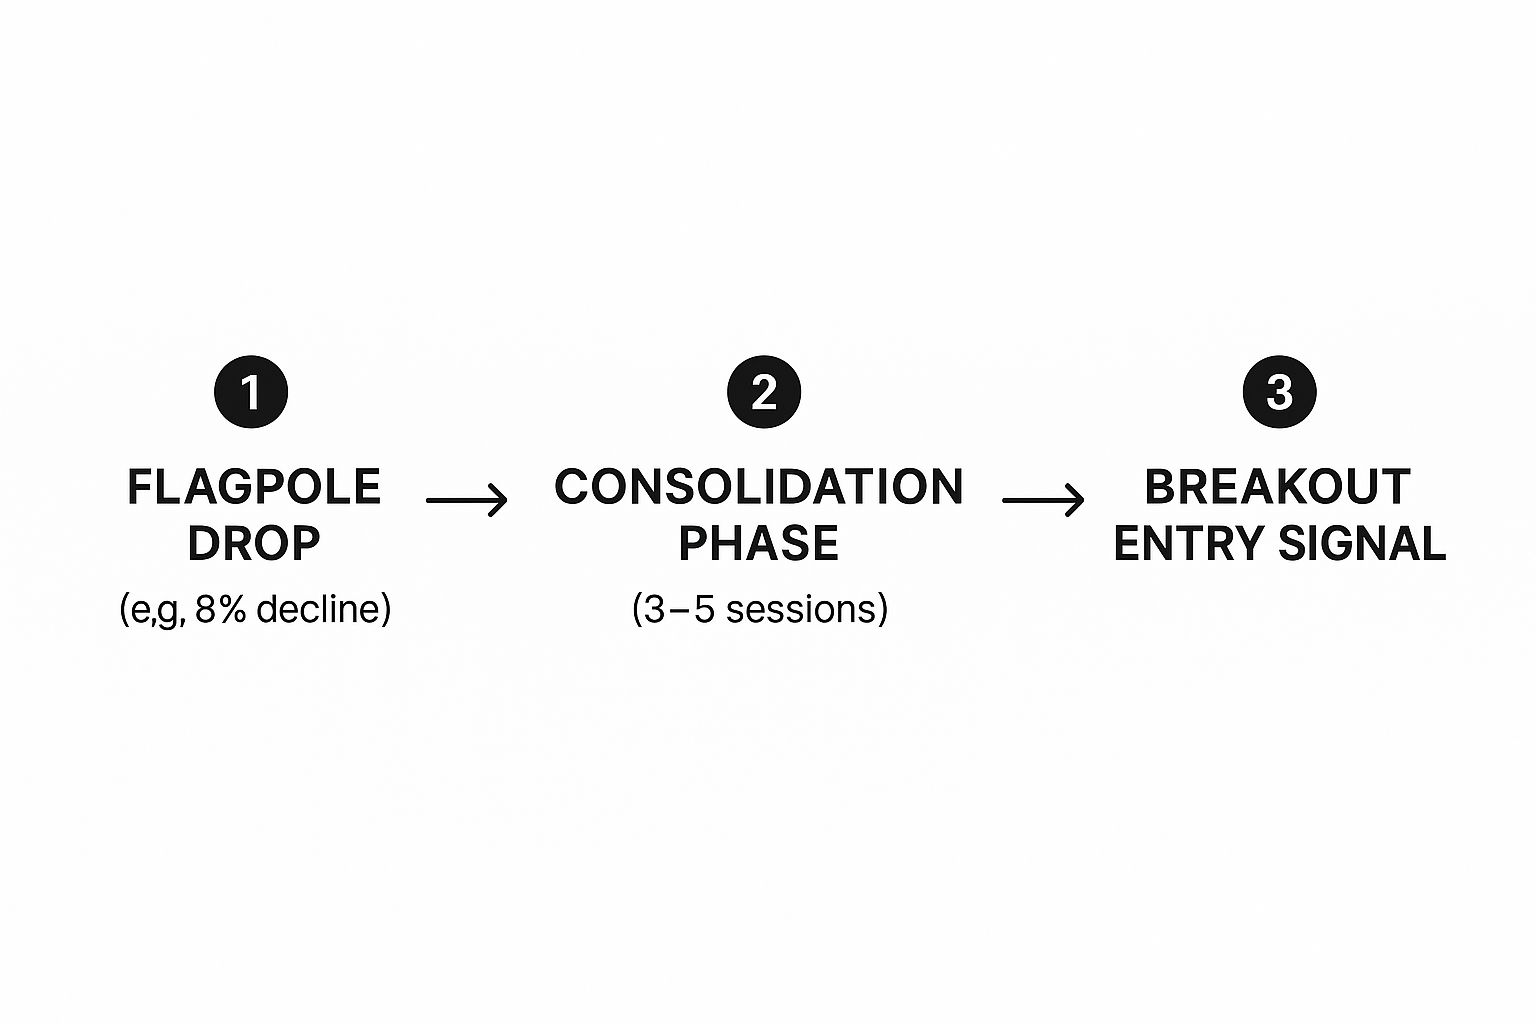
This visual guide shows you the ideal sequence: a sharp decline establishes bearish control, a brief consolidation shows indecision, and a breakout confirms the sellers have won the battle.
The Ultimate Confirmation: Volume
While the structure is crucial, the single most critical piece of evidence is trading volume. Volume gives you a peek into the conviction behind the price moves. Without the right volume signature, even a picture-perfect pennant can fall flat on its face.
The secret to confirming a genuine bear pennant pattern lies in its volume signature. Volume should be high during the flagpole, dry up significantly during the pennant’s formation, and then surge on the breakdown below the lower trendline.
This volume behavior tells a compelling story. High volume on the flagpole confirms the initial selling pressure was intense. The drop-off during the pennant's formation shows that both buyers and sellers are lacking conviction—it’s a true pause, not a reversal in the making. Finally, that massive spike in volume on the breakdown is your confirmation that sellers have returned with a vengeance, ready to shove the price lower.
Time and again, major market events have shown just how vital volume analysis is for this pattern. During downturns like the dot-com bust and the 2008 financial crisis, valid bear pennants were consistently marked by low volume during consolidation, followed by a huge spike in volume on the downside breakout. This pattern confirms that institutional sellers are driving the move, which adds serious weight to the signal. You can discover more insights about the importance of volume analysis from past market events.
By making volume a non-negotiable part of your checklist, you can filter out the weak setups and focus only on the high-probability trading opportunities.
Actionable Trading Strategies for This Pattern

Spotting a bear pennant pattern is one thing; knowing how to trade it is what separates the winners from the losers. To avoid getting chopped up by market noise and emotional decisions, you need a crystal-clear plan. This means defining your entry, your stop-loss, and your profit target before you even think about placing a trade.
Think of it like a pilot's pre-flight checklist. They don't guess when to take off or what altitude to fly; they follow a precise plan. Your approach should be no different. A complete trading plan gets rid of the guesswork and is the foundation of consistent trading.
Defining Your Entry Point
The most common trap traders fall into is jumping the gun and entering a trade too early. Just because you see the price dip below the pennant's lower trendline during the day doesn't mean it's a confirmed signal. It could easily be a "fakeout" where the price snaps right back and heads higher.
Patience is your best friend here.
The right way to enter a short position is to wait for a confirmed candlestick close below the lower trendline of the pennant. This confirmation shows that the sellers had enough power to control the price for an entire session, which is a much stronger signal that the downtrend is ready to get back in business.
Setting Your Protective Stop-Loss
Let's be clear: no pattern works 100% of the time. In fact, studies show the bear pennant can fail roughly 46% of the time. This means you absolutely must have an exit plan for when the trade goes sour. A stop-loss isn't just a good idea; it's your primary risk management tool.
A logical spot to place your stop-loss is just above the upper trendline of the pennant. This gives the trade enough breathing room to withstand normal market volatility. If the price breaks above this level, the entire bearish idea is invalidated, and it's your signal to get out and cap your loss.
A well-placed stop-loss is your financial safety net. It takes the emotion out of losing by pre-defining the exact point where you accept the pattern has failed. Then, you simply move on to the next opportunity.
Executing this requires a cool head and unbreakable rules. The best strategy in the world is useless without the right mindset, which is why building strong trading discipline is a non-negotiable part of long-term success.
Calculating Your Profit Target
Finally, you need a logical place to take your profits. The classic method for a bear pennant involves measuring the initial flagpole. This gives you an objective, data-driven target instead of just closing the trade on a gut feeling.
Here is the simple, two-step process:
- Measure the Flagpole: Calculate the price distance of the flagpole. This is the big drop from where the move started down to the lowest point right before the pennant started to form.
- Project from the Breakout: Take that same distance and subtract it from the price where the candle closed below the pennant's lower trendline. This new, lower price level is your primary profit target.
This method works because it assumes the move after the breakout will have a similar force as the move before the consolidation. It gives you a systematic way to manage your trade from start to finish.
A Real-World Bear Pennant Pattern in Action

Looking at charts and checklists is one thing. But seeing a bear pennant pattern play out in a live market? That’s where the theory gets real. This is the moment the lines on your screen tell a story—a story of aggressive selling, a quick pause for breath, and then a powerful move lower.
By walking through a real trade, we can connect the dots and see how all the pieces we've discussed create a high-probability setup.
Let's look at a textbook example involving Petrobras (PBR), a massive company in the energy sector. This case study is a perfect illustration of the pattern's anatomy, especially when a fundamental catalyst gets thrown into the mix.
The Petrobras (PBR) Case Study
In early 2024, the Petrobras chart served up a classic bear pennant on a silver platter. It all kicked off on February 2, 2024, when PBR’s stock price took a nosedive. This sudden, sharp drop carved out the flagpole and was a clear signal that the bears had grabbed control of the wheel.
After that initial plunge, the price action tightened up. For the next couple of days, the price bounced between two converging trendlines, sketching out that classic triangular pennant shape. This coiling action was the market catching its breath—sellers were pausing their assault, and a few hopeful buyers were trying to find a bottom.
The real confirmation came on February 5, 2024. The stock decisively sliced through the pennant’s lower trendline, dropping from about $17.13 to $16.74. Critically, this breakdown happened with a big spike in trading volume. That told us the sellers were back, and they meant business.
But this wasn't just a random technical move. It was supercharged by a fundamental trigger: Petrobras announced it was cutting its dividend. This kind of negative news is pure rocket fuel for a bearish setup, giving traders a very concrete reason to hit the sell button.
In the days that followed, the stock cratered by over 10%, proving the pattern’s bearish signal was spot on.
Combining Technicals with Fundamentals
The Petrobras trade is undeniable proof of how powerful the bear pennant can be, particularly when the technical picture lines up with the fundamental story. The chart pattern itself was the initial alert, flagging the potential for more downside. The dividend cut was the catalyst that lit the fuse.
This is also a prime example of why so many traders struggle. They might look at just the chart, or just the news, but they fail to put the whole picture together. In my experience, understanding the 10 key reasons why traders lose money is crucial for avoiding these common traps.
By combining the visual cues from the chart, the confirmation from volume, and the "why" from the market news, a trader could have approached this PBR setup with a ton of confidence. It’s a perfect case study of moving beyond just spotting a pattern to actually trading it like a pro.
Common Questions About the Bear Pennant
Even when you've got the basics down, it's the practical, nitty-gritty questions about the bear pennant pattern that often pop up. These little details can be the difference between a trade you feel great about and one that ends in a painful loss. So, let’s clear up some of the most common points of confusion.
Answering these questions will help you see the subtle but critical differences between patterns that look alike. It also hammers home the best practices we’ve talked about, making sure you can apply this knowledge with more confidence when real money is on the line. Think of it as fine-tuning your trading engine.
What Is the Main Difference Between a Bear Pennant and a Bear Flag?
At first glance, a bear pennant and a bear flag look almost identical. Both are bearish continuation patterns, after all. But the key difference is the shape of their consolidation phase, and that shape tells you a slightly different story about what's happening behind the scenes.
A bear pennant forms a small, symmetrical triangle. You’ll see converging trendlines that look like they’re squeezing the price. This signals a tense, brief moment of indecision as buyers and sellers battle it out. It’s a very sharp, quick pause.
A bear flag, on the other hand, has parallel trendlines, creating a rectangular channel that often drifts slightly upward against the main downtrend. This shows a more orderly, less frantic breather before the selling resumes.
The easiest way I remember the difference is by their shapes: the pennant is a triangle, the flag is a rectangle. The pennant is a quick squeeze; the flag is a more measured retreat.
How Reliable Is the Bear Pennant Pattern?
This is probably the most important question you can ask. Let's be brutally honest: on its own, the bear pennant pattern is only moderately reliable. I've seen studies showing its success rate is just over 50%. That means it fails almost as often as it works. Trading the pattern by itself is basically a coin flip.
So how do you tip the odds in your favor? You absolutely must look for confirmation from other data points. In my experience, two tools are critical:
- Volume: As I always emphasize, volume is your best friend. It should dry up as the pennant forms and then explode on the breakdown. This is your number one confirmation signal.
- Other Indicators: Using something like the Relative Strength Index (RSI) can help. If the RSI stays weak during the consolidation and doesn't push toward overbought territory, it adds serious weight to the bearish argument.
When you combine the pattern with these signals, you transform it from a low-probability guess into a much more solid trading setup.
What Is the Best Timeframe to Trade a Bear Pennant?
The bear pennant shows up on every timeframe, from the frantic 1-minute chart all the way to the slow-moving weekly chart. As a rule of thumb, its reliability and importance grow with the timeframe.
A bear pennant on a daily or weekly chart is a much bigger deal. It represents a major pause in a long-term trend and usually leads to a more significant, sustained move. These patterns on higher timeframes simply carry more weight because more market participants are involved over a longer period.
Day traders can definitely trade this pattern on 5-minute or 15-minute charts. But you have to be extra careful. You're dealing with a lot more market "noise" and will see more false signals. For most traders, I find the daily chart offers the best balance of frequent opportunities and signal reliability.
At Colibri Trader, we teach you to master these price action patterns without relying on confusing indicators. Our methods are built on clear, repeatable strategies that help you understand the story the market is telling. Ready to transform your trading skills? Explore our proven approach at Colibri Trader.