


Master Your Backtest Trading Strategy | Ultimate Guide
Before you ever think about putting real money on the line, you need to know if your trading idea is even worth a damn. This is where a rigorous backtest of your trading strategy becomes your most critical tool. Think of it as a flight simulator for your capital—it lets you pit your strategy against years of historical data to see how it holds up, quantify the risks, and build the kind of confidence you can't fake.
Why Rigorous Backtesting Is Your First Line of Defense
Jumping into the live market with an untested strategy is just gambling. It’s like sailing into a hurricane without even glancing at the weather forecast. Sure, you might get lucky once or twice, but the odds are overwhelmingly stacked against you.
This is what separates disciplined, professional traders from the hopeful amateurs. Backtesting gives you a crucial, data-driven foundation for every decision you make. It’s not about chasing a "perfect" strategy that never loses—those don't exist. It's about systematically finding and eliminating the fatal flaws in your ideas before they cost you a dime.
The concept is brilliantly simple: you apply your set of trading rules to past market data to see exactly how it would have performed. You're simulating every entry, exit, stop loss, and take profit to see what would have happened. For a deeper dive, check out this great resource on using historical data properly.
Understanding What the Numbers Really Tell You
A proper backtest delivers a whole lot more than just a final profit number. It spits out a full report card on your strategy, revealing its true personality and, most importantly, its weaknesses. These numbers help you answer the tough questions.
Here are the metrics I always look at first:
- Maximum Drawdown: This is the big one. It shows you the largest drop from a peak to a trough your account would have suffered. It's a raw measure of the kind of pain you need to be prepared to endure.
- Sharpe Ratio: This is your risk-adjusted return. It answers the question: "How much bang am I getting for my buck?" A high return is useless if the risk taken to get it was astronomical.
- Profit Factor: Simply your gross profits divided by your gross losses. It tells you how many dollars your strategy made for every single dollar it lost. I look for something well above 1.5.
- Win Rate: The percentage of trades that closed in profit. This gives you a feel for the strategy's consistency, which has a massive psychological impact.
A backtest forces you to be brutally honest with yourself. That massive profit might look amazing, but if it came with a gut-wrenching 50% drawdown, could you have actually sat through it without pulling the plug? This is the kind of reality check every trader needs.
Building Unshakeable Confidence
At the end of the day, backtesting is all about building justifiable confidence. When you know, for a fact, that your strategy has survived and even thrived through bull markets, bear markets, and months of sideways chop, you're much less likely to panic during the next inevitable losing streak.
It’s this data-driven confidence that gives you the backbone to execute your plan with discipline, which is what truly separates the winners from the losers in this game. Without it, you’re just trading on hope, and hope is a terrible strategy.
To really nail down what you should be looking for in your results, I've put together a quick reference table of the most important metrics.
Key Backtesting Metrics at a Glance
This table breaks down the essential metrics you'll get from a backtest, what they measure, and a good target to aim for. While these targets aren't set in stone, they provide a solid benchmark for evaluating a strategy's potential.
| Metric | What It Measures | Good Target |
|---|---|---|
| Net Profit | Total profit or loss over the test period. | Positive; higher is better. |
| Profit Factor | Gross profits divided by gross losses. | > 1.75 |
| Maximum Drawdown | The largest peak-to-trough equity decline. | < 20% |
| Sharpe Ratio | Risk-adjusted return. | > 1.0 |
| Win Rate (%) | Percentage of profitable trades. | > 50% (highly strategy dependent) |
| Average Trade | The average profit/loss per trade. | Positive; must cover costs. |
Getting a firm grasp on these numbers is non-negotiable. They are the language of your strategy's performance, and you need to be fluent to understand if an idea has real potential or is just a disaster waiting to happen.
Sourcing and Preparing High-Quality Historical Data
Let's get one thing straight: a backtest is only as reliable as the data you feed it. That old saying, "garbage in, garbage out," isn't just a cliché in trading; it’s a fundamental law.
Think of your historical data as the foundation of a skyscraper. If it's cracked, uneven, or just plain wrong, the whole structure is at risk, no matter how brilliant your trading strategy looks on paper.
Your first job is to pick the right kind of data for your needs. The two main flavors are end-of-day (EOD) data and intraday data, which can get as granular as minute-by-minute or even tick-by-tick.
For longer-term strategies like swing or position trading, where you're holding trades for days or weeks, free or cheap EOD data is usually good enough. It gives you the daily open, high, low, and close prices, which is often all you need to test ideas with a longer horizon. But for day trading? It’s completely useless.
The Granularity You Need for Precision
When you're testing an intraday strategy, you absolutely need data that captures the real-time pulse of the market. This is where high-frequency data is non-negotiable.
Using high-frequency tick data dramatically boosts the precision of your backtest, especially for algorithmic trading. Unlike data that's bundled into one-minute or five-minute bars, tick data records every single transaction. This gives you a true-to-life picture of the market's microstructure. That level of detail is crucial for realistically simulating things like execution costs and slippage, which can easily turn a winning intraday strategy into a loser. To really get a feel for its impact, you can discover more about using tick history for accurate backtesting.
This leads us to the most critical part of the whole process: cleaning your data. Raw historical data is almost never perfect. It’s usually littered with hidden traps that can completely torch your backtest results.
A common and dangerous pitfall is survivorship bias. This happens when your dataset only includes assets that "survived" the testing period, conveniently leaving out the companies that got delisted, went bankrupt, or were acquired. A backtest on this kind of skewed data will look amazing, but it's pure fantasy because it ignores all the failures.
Cleaning Data for a Realistic Backtest
You have to be proactive and scrub your data for common errors and biases. If you skip this, you’ll end up with a dangerously misleading view of how your strategy actually performs in the real world.
Here are the big issues you have to tackle:
- Survivorship Bias: Your dataset must include delisted stocks and other failed assets from the period you're testing. You need to know how your strategy would have handled the entire market, warts and all, not just the stocks that are still around today.
- Corporate Actions: Price data needs to be adjusted for events like stock splits and special dividends. A 2-for-1 stock split will slash a stock's price in half overnight. If your data isn't adjusted, your backtest will see a massive price drop and trigger false sell signals all over the place.
- Data Gaps and Errors: Hunt for missing data points or obvious mistakes, like a blue-chip stock suddenly trading for $0.01. These anomalies need to be fixed or flagged so they don't corrupt your results.
Getting your data right also means being realistic about costs. Beyond the price itself, your backtest has to account for commissions, fees, and a solid estimate for slippage on every single trade. These small "frictions" add up fast and can easily erode your profits. By factoring in these costs correctly, you can also make smarter decisions about your trade size. For a deep dive on that topic, check out our guide on effective position sizing strategies.
Choosing the Right Backtesting Environment for You
Now that you have clean, reliable historical data, it’s time to pick your toolkit. The environment you use to run your backtest trading strategy will massively impact the speed, depth, and flexibility of your analysis. This isn't about finding the "best" platform out there, but the one that truly fits your technical skills and what you're trying to achieve with your strategy.
The options are vast. They range from incredibly user-friendly, no-code platforms to powerful, but much more involved, programming libraries. Each has its place, and each is designed for a different kind of trader.
Take a platform like TradingView, for example. It offers a very gentle learning curve. You can jump right in and start testing simple strategies directly on the charts without writing a single line of code. It's an excellent starting point for beginners or for any trader who just wants to quickly validate a basic idea.
But, as your strategies get more sophisticated, you might find these platforms start to feel a bit restrictive. That’s when many traders start looking at code-based solutions.
Code-Based vs. No-Code Platforms
The real choice here boils down to ease of use versus customization. No-code tools get you up and running fast, but they often have built-in limits on how complex your strategy can be, what data you can use, and how the results are reported.
On the other hand, diving into a Python library like backtrader or Zipline gives you almost total freedom. You can build extremely customized strategies, pull in alternative data sources, and even define your own performance metrics from scratch. The catch? You have to be comfortable with programming, which adds a steep learning curve and requires more initial setup time.
For any serious trader, I believe learning to code is a worthwhile investment. It doesn't just unlock more powerful backtesting; it forces you to understand the raw logic of your strategy. It demands a level of precision that you just can't get from a point-and-click platform.
This image below breaks down some of the key metrics for two popular backtesting tools. It really highlights the trade-offs you'll face in terms of data availability, speed, and cost.
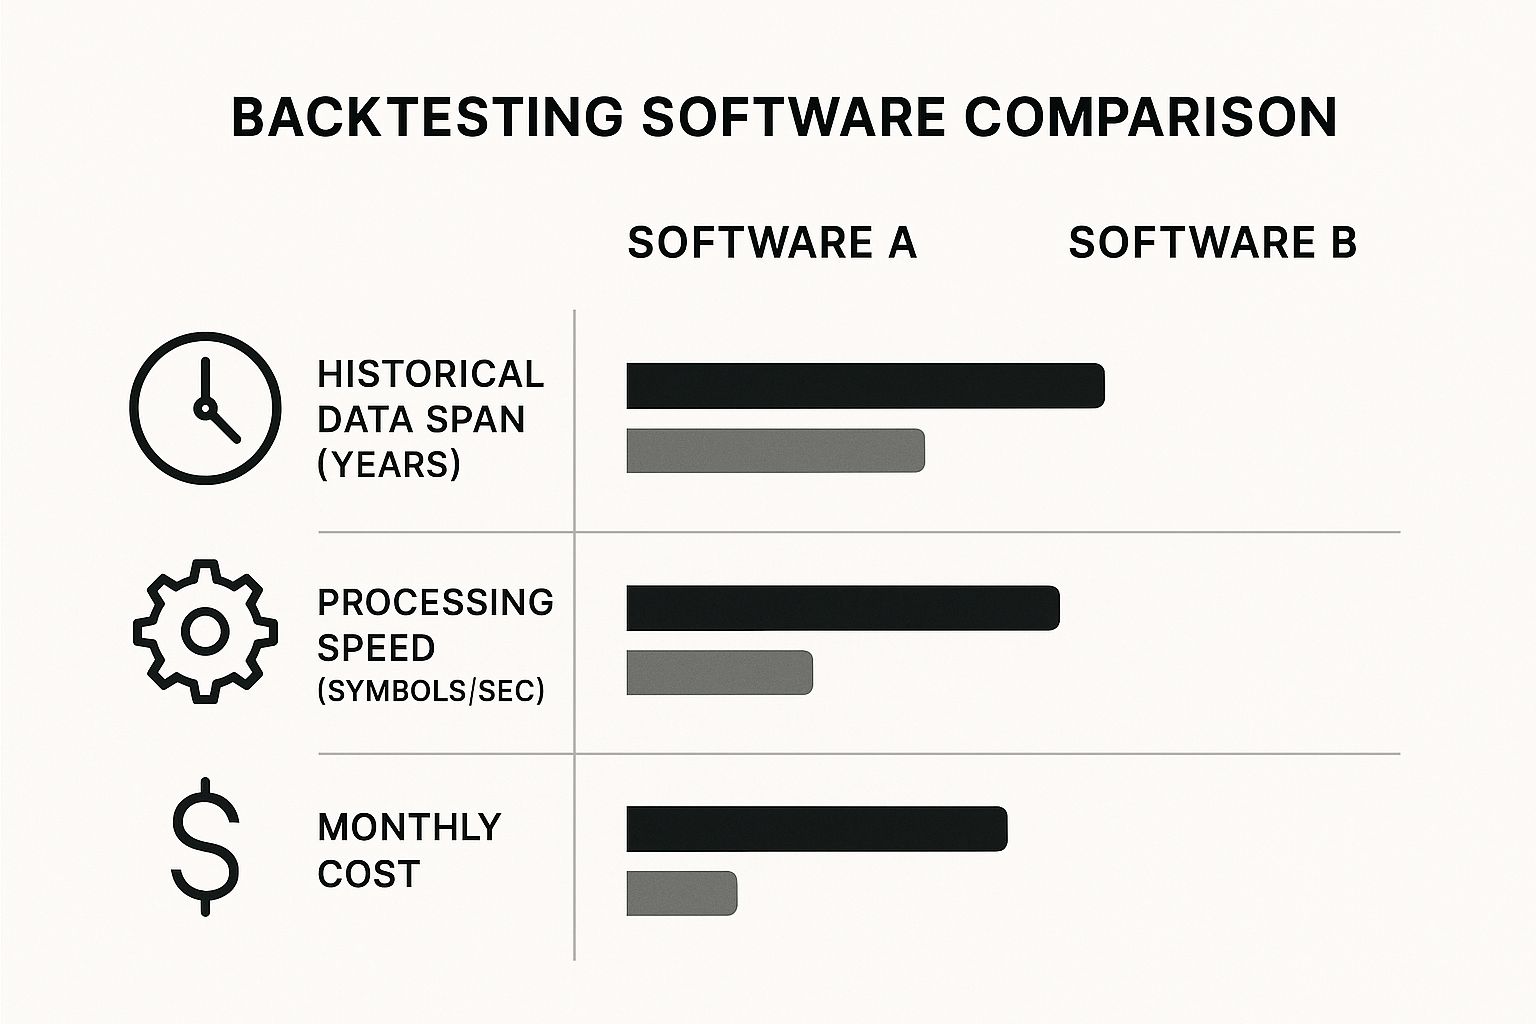
As you can see, one tool might look cheaper, but that comes at the expense of slower processing and less historical data to work with. There's always a trade-off.
To help you navigate this, I've put together a quick comparison of some common platforms. Think about where you are on your trading journey and what you need your tools to do for you.
Comparison of Popular Backtesting Platforms
| Platform | Best For | Key Feature | Coding Required? |
|---|---|---|---|
| TradingView | Beginners, visual testing | Pine Script™ language for custom indicators/strategies on charts | Minimal (Pine Script) |
| MetaTrader 5 | Forex & CFD traders | Widespread broker support and a huge marketplace of EAs | Yes (MQL5) |
backtrader |
Python developers | Extreme flexibility and control over every aspect of the test | Yes (Python) |
| QuantConnect | Quantitative analysts | Cloud-based platform with access to massive datasets | Yes (Python/C#) |
This table should give you a solid starting point. Each of these has its own community and resources to help you get started.
Making the Right Choice for Your Journey
Ultimately, the platform you choose should match your current skills and your long-term ambitions. Here’s a simple way I like to think about it:
- Beginner Trader: Start with a no-code or low-code platform. Your main goal is to learn the principles of strategy development. Don't let technical hurdles get in your way.
- Intermediate Trader: If you feel like your current tool is holding you back, it’s a clear sign you’re ready to explore a code-based solution. This will open the door to much more nuanced and sophisticated testing.
- Advanced/Quantitative Trader: For serious quants, a robust programming environment is non-negotiable. The need to process huge datasets and implement complex mathematical logic makes it the only real choice.
Picking the right environment is a foundational step. It ensures your tools are helping, not hindering, your path from a good idea to a thoroughly tested and reliable backtest trading strategy.
Running Your Test and Interpreting the Results

Alright, this is where theory smacks into reality. You’ve got your data and your platform is ready to go. Now it’s time to actually run the simulation.
But hold on. Hitting "run" is the easy part. The real work is making sure your test is as close to live trading as possible. A raw backtest that ignores the gritty details of the market is just a fantasy.
Every single trade you take in the real world has costs that nibble away at your profits. You absolutely must tell your backtesting software to account for these trading frictions.
- Commissions: Program in the exact fee your broker charges for every buy and sell.
- Spreads: You have to account for the bid-ask spread. You never, ever get the perfect price shown on the chart.
- Slippage: This one is a big deal. Slippage is the gap between the price you thought you’d get and the price you actually got. When markets are moving fast or you're trading big size, slippage can wreck an otherwise profitable strategy.
If you skip these costs, you'll end up with a dangerously rosy picture of performance that you'll never be able to match with real money on the line.
Thinking Like a Quantitative Analyst
Once the simulation is done, the real analysis begins. It’s so tempting to just glance at the final P&L, but honestly, that one number tells you almost nothing. To properly evaluate your backtest trading strategy, you need to dissect the results like a quant.
The first place I always look is the equity curve. This is a simple plot of your account balance over the life of the test. What you want to see is a nice, smooth line climbing from the bottom-left to the top-right. A profitable but wildly jagged curve? That’s a red flag for a high-risk strategy that will be a psychological nightmare to trade.
Next, you have to look at the drawdowns. The maximum drawdown is the single biggest percentage drop your account took from a peak to a trough. This metric is a brutal reality check. It shows you the exact financial and emotional pain you would have had to sit through to keep trading the strategy.
A backtest might show a $100,000 profit, which sounds amazing. But what if it also had a 60% maximum drawdown? That means at one point, your $50,000 account would have bled down to just $20,000. Could you honestly handle that kind of loss without hitting the panic button? That’s the question a drawdown forces you to answer.
Digging Deeper into Trade-Level Statistics
Finally, zoom in on the statistics for individual trades. Don't get mesmerized by the win rate. I’ve seen plenty of strategies with high win rates that still lose money because the average losing trade is a monster compared to the average winner.
I focus on these core metrics:
- Profit Factor: This is your total gross profit divided by your total gross loss. Anything above 1.75 is looking pretty strong. If it's below 1.5, I get very cautious.
- Average Win vs. Average Loss: This ratio tells you if your winning trades are actually big enough to pay for all your losers and still leave something for you.
- Trade Distribution: Are your profits coming from just one or two massive, lucky trades? Or are they spread out consistently? A strategy that relies on a fluke home run isn't robust and probably won't last.
This deep dive is what separates a quick glance from a professional, serious analysis. If you want to see a more detailed walkthrough of this whole process, you can learn more about how to backtest a trading strategy in our complete guide: https://www.colibritrader.com/how-to-backtest-trading-strategy/
By digging into these numbers, you can figure out if your strategy truly has an edge or if its past performance was just a lucky streak.
Avoiding the Hidden Traps of Backtesting
It’s an incredible feeling to see a backtest report with a beautiful, smooth equity curve pointing straight up. It's so easy to look at that and think you've struck gold.
But be careful. A great-looking report can be dangerously deceptive. I've seen it countless times—hidden biases can make even a losing strategy look like a Wall Street darling on paper. Learning to spot these traps is what separates traders who have a realistic shot at success from those who are just chasing fantasies.
One of the most common mistakes is lookahead bias. This is a sneaky error where your backtest accidentally uses information that wouldn't have been available when you were supposed to be making a trade. For instance, if your strategy uses the day's closing price to decide on an entry during that same day, you've effectively peeked into the future. In reality, you would have made that trade hours before the closing price was even known.
Another silent killer is survivorship bias. This happens when your historical data only includes companies and assets that are still trading today. It conveniently ignores all the businesses that went bankrupt, got delisted, or were acquired along the way. Your backtest ends up running in a fantasy world where every stock is a survivor, which can dramatically inflate your performance.
The Seductive Trap of Curve Fitting
Of all the pitfalls, the most tempting is curve fitting, or what we often call over-optimization. This is the process of endlessly tweaking your strategy's parameters until they perfectly match the historical data you're testing on.
You might discover that a 12-period moving average and a 27-period RSI delivered unbelievable results over the past five years. The problem? You haven’t built a robust strategy; you’ve built a fragile one that’s just perfectly tailored to a specific, random sequence of past market movements.
The moment you unleash it on new, live market data, it’s almost guaranteed to fall apart because the market's "rhythm" has inevitably changed. A true trading edge comes from solid, robust principles, not parameters that have been curve-fit to perfection.
A great backtest should actually feel a little imperfect. If the results look too good to be true, they almost certainly are. A strategy boasting a 95% win rate with zero drawdown is a classic sign of curve fitting, not a durable market edge.
Your Final Line of Defense
So, how do you protect yourself from these illusions? Your best line of defense is to split your data and run a series of validation tests. This is a fundamental pillar of proper trading, especially when it comes to risk. It’s a concept we dive into deeply in our guide on essential trading risk management strategies.
Here’s the three-step validation process I use and recommend:
- In-Sample Testing: This is your starting point. You use the main chunk of your historical data (say, 2015-2020) to develop and fine-tune your core strategy rules. This is your "development" phase.
- Out-of-Sample Testing: Next, you take that exact same strategy, with its parameters now locked in, and test it on a piece of historical data it has never encountered before (for example, 2021-2023). If the performance holds up reasonably well, that's a fantastic sign that your strategy has genuine potential and isn't just curve-fit.
- Forward Testing (Paper Trading): The final and most crucial gate. You apply the strategy in the live market, in real-time, but without risking a single dollar. This is the ultimate test to see if your backtested results can survive real-world frictions like slippage, commissions, and latency.
Only a strategy that successfully passes through all three of these gates should ever be considered for trading with real money. By actively looking for these hidden biases and working to eliminate them, you turn your backtest trading strategy from a hopeful guess into a rigorous, professional process.
Common Questions on Strategy Backtesting
Even after you get the hang of the process, a few key questions always seem to pop up when you backtest a trading strategy. I've seen these trip up new and experienced traders alike, so let's walk through some of the most common ones. Getting these right will give you much more confidence in your results.
One of the first things traders ask is: how much data do I actually need? The answer isn't a simple number; it really hinges on how often your strategy trades.
For a fast-paced intraday strategy that's in and out of the market on the same day, you'll want 1 to 2 years of high-quality data, ideally down to the minute or even tick level. But for a swing or position trading strategy, where trades might last for days or weeks, that's not nearly enough. You need to look further back—at least 5 to 10 years of daily data is a good starting point.
The real aim isn't just about the length of time, but about getting enough trades to know your results are meaningful. You're looking for statistical significance. A good rule of thumb is to have at least 100 trades in your backtest. Anything less, and you can't be sure your performance wasn't just a lucky streak.
Distinguishing Backtesting from Forward Testing
Another area of confusion I see often is the difference between backtesting and forward testing. They sound similar, but they play very different roles in proving your strategy works.
Backtesting is purely a look in the rearview mirror. You're taking a fixed set of rules and applying them to old market data to see what would have happened. It's your first, critical test to see if an idea has any merit at all.
Forward testing, which is really just paper trading, is the exact opposite. You take your finalised strategy and apply it to the live market as it unfolds, but without putting real money on the line. It's the final exam, designed to see if your historical results can survive in the unpredictable present.
Is a Great Backtest Enough to Go Live?
This is the big one. Your backtest report looks fantastic, the equity curve is a beautiful upward slope, and you're ready to start printing money, right?
Slow down. The answer is a firm "no".
A great backtest is a fantastic start, but it's just the first checkpoint, not the finish line. It's a ticket to the next round of testing, not a license to trade with your hard-earned capital.
Before you even think about going live, you absolutely must:
- Hunt for biases: Double- and triple-check that you haven't accidentally introduced overfitting or lookahead bias, which can make results look much better than they really are.
- Test on unseen data: Run the strategy on a separate chunk of historical data that wasn't used at all during your initial development and testing. This is called out-of-sample testing.
- Forward test (paper trade): Let the strategy run in a demo account for a decent amount of time. This shows you how it handles the current market's personality, which might be completely different from your historical data.
Only after a strategy has passed every single one of these tests should you consider trading it with a small amount of real money. From there, you can scale up your position size slowly as you build confidence in its real-world performance.
At Colibri Trader, we believe in building real trading skill through proven, practical methods—not shortcuts or magic bullets. Our programs are built to give you the price action expertise and confidence to trade without relying on indicators or guesswork. Transform your trading with a clear, straightforward approach. Learn more and start your journey with Colibri Trader today.