


Trading the Ascending Triangle Pattern
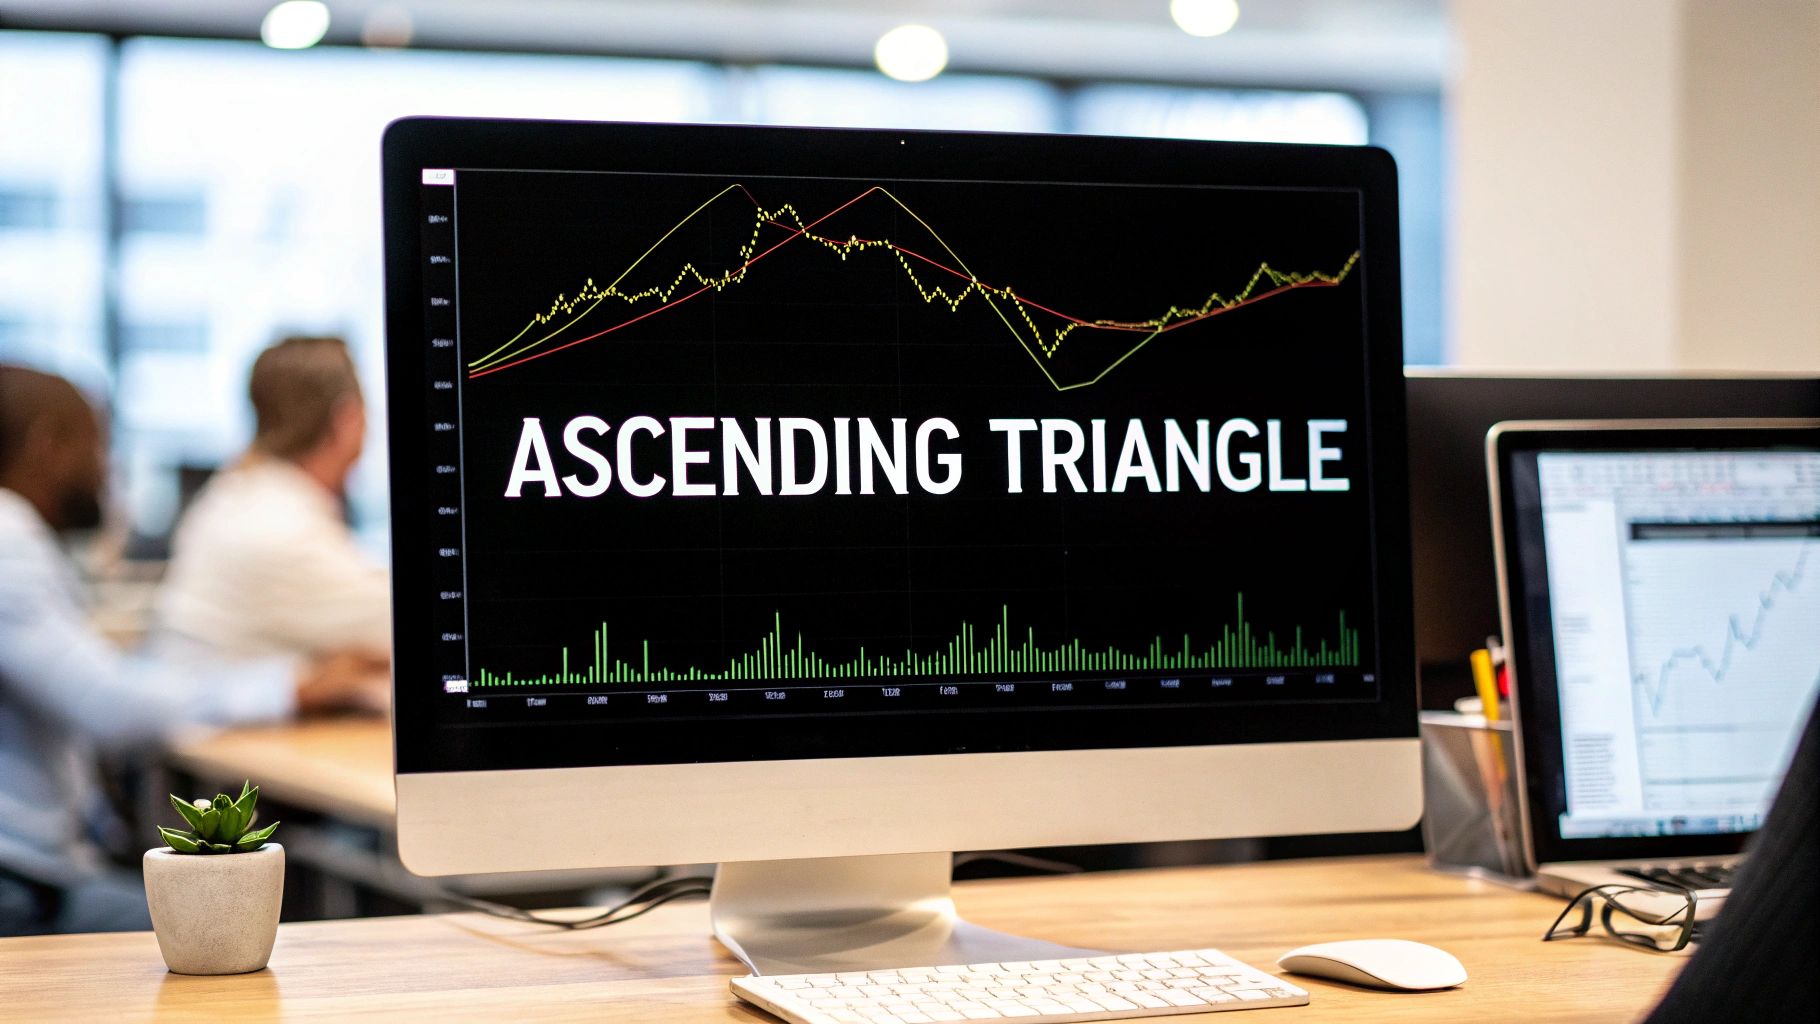
The ascending triangle is a classic bullish chart pattern that shows buying pressure building up just before a potential breakout. You can spot it by its two defining features: a flat, horizontal resistance line and a rising trendline of higher lows. When you see this shape, it often means an existing uptrend is getting ready to continue its climb.
Decoding The Ascending Triangle Pattern

Think of an ascending triangle as a coiled spring. It’s a period where bullish energy gets compressed, building up steam before a potential explosion higher. Price action traders love this pattern because it tells a very clear story of a battle between buyers and sellers—and it’s a story where the buyers are slowly, but surely, gaining the upper hand.
This pattern usually forms over several weeks or even months, representing a consolidation phase within a larger uptrend. To really have confidence in the pattern, you’ll want to see at least two clear touches on both the resistance and support lines.
The Two Pillars Of The Pattern
To correctly identify an ascending triangle, you have to find its two non-negotiable components on a price chart. These elements are the visual backbone of this powerful setup.
Here is a quick-reference guide to the key visual elements of the ascending triangle.
Core Components of an Ascending Triangle
| Component | What It Looks Like | What It Signals |
|---|---|---|
| Horizontal Resistance | A flat, straight line across the price peaks. | A "ceiling" where sellers consistently step in to push prices down. |
| Rising Support Trendline | An upward-sloping line connecting the price lows. | Buyers are becoming more aggressive, entering at higher prices. |
When you draw these two lines on your chart, they converge and form a right-angled triangle, which is exactly where the pattern gets its name. This visual compression is the key to understanding what’s really happening behind the scenes.
Key Takeaway: The pattern's defining feature is the battle between a fixed ceiling (resistance) and a rising floor (support). That rising floor is the critical clue—it shows that buying pressure is systematically building, making an upward breakout the more probable outcome.
Why It Signals A Bullish Move
The ascending triangle is considered a bullish continuation pattern. In simple terms, this means it usually pops up during an existing uptrend, signaling a pause before the trend likely resumes its move higher.
The logic here is pretty straightforward: sellers are holding the line at a specific price, but buyers are relentlessly pushing up from below.
Those higher lows are your biggest hint. They show that the bears are losing their grip. Each time sellers manage to push the price down, they can't push it as far as the last time before buyers jump back in with even more force. Eventually, this persistent buying pressure can completely overwhelm the sellers camped out at the resistance level, triggering a breakout.
While it can sometimes show up as a reversal pattern at the bottom of a downtrend, its most reliable role is signaling that the bulls are still in charge. For a broader look at how this setup stacks up against others, you can learn more by reading about trading triangle patterns. This helps you spot high-probability setups across different market conditions.
The Psychology Driving the Pattern
To really get a handle on the ascending triangle, you have to look past the lines on the chart and peek into the minds of the traders creating it. These patterns aren't just random shapes; they're a visual story of the fight between buyers and sellers, and in this case, a story where the momentum is quietly shifting.
Think of that flat resistance line as a ceiling. It's a price level where a stubborn group of sellers has dug in their heels, convinced the asset is overvalued. Every time the price creeps up to this point, they hit the sell button, creating a wall that the bulls just can't seem to break through. At least, not at first.
But while the sellers are holding their ground, the buyers are getting restless. The rising trendline tells their side of the story. Each time sellers manage to push the price down from that ceiling, buyers jump back in sooner and at a higher price than they did before. This is what carves out that signature pattern of higher lows.
The Quiet Before the Breakout
This growing impatience from the buyers is the real engine behind the pattern. They aren't willing to wait for the price to fall back to its previous lows. Their eagerness to get in on the action makes them willing to pay a premium with each little dip, showing a clear build-up in buying pressure and confidence.
As the price gets squeezed between the immovable sellers and the increasingly aggressive buyers, something interesting happens with the trading volume. You'll typically see volume start to dry up as the pattern tightens.
Don't mistake this drop in volume for a lack of interest. It's actually the opposite—it's coiling energy. Think of it like the market taking a deep breath before the plunge. The standoff gets tighter, indecision creeps in, and traders step back, waiting for a clear winner to emerge.
This quiet consolidation phase is critical. It builds tension. The longer the price gets compressed inside that triangle, the more explosive the eventual breakout is likely to be.
The Inevitable Showdown
This tug-of-war between the static selling wall and the rising floor of buyers can't go on forever. Sooner or later, one side has to fold, and the very structure of the ascending triangle tells us the buyers have the upper hand. The pattern finally resolves when one of two things happens:
- The Bullish Breakout: The relentless pressure from buyers finally chews through all the sell orders stacked at the resistance level. Once those sellers are exhausted, a fresh wave of buying rushes in, shoving the price decisively through the ceiling, often on a big spike in volume. This is the classic resolution.
- The Pattern Failure: While less common, sometimes the buyers lose their nerve. If they fail to prop up the price at the rising trendline, sellers can take charge and slam the price down through the floor, causing the pattern to fail and trapping the hopeful bulls.
At its core, the ascending triangle is a visual narrative of a power struggle. It maps out a clear shift from a state of balance to one of imbalance, where determined buyers systematically wear down a fixed supply of sellers. It's this gradual accumulation of bullish pressure that makes the breakout so powerful—and profitable—for traders who know what to look for.
A Step-by-Step Guide to Trading the Breakout
https://www.youtube.com/embed/ZudTPpJCbbA
Spotting an ascending triangle is one thing; actually trading it profitably is another game entirely. To come out ahead, you need a disciplined, step-by-step approach to manage your risk and nail the timing. This is the playbook for taking a pattern from the chart to a live trade.
Think of it like a pilot's pre-flight checklist. You don't just jump in the cockpit and hope for the best. Rushing a trade before the pattern is truly ready to go is one of the fastest ways to get burned by a false move.
This diagram breaks down the psychology of what's happening. You can literally see the tension building between the persistent buyers and the determined sellers, coiling the market up like a spring right before it snaps.
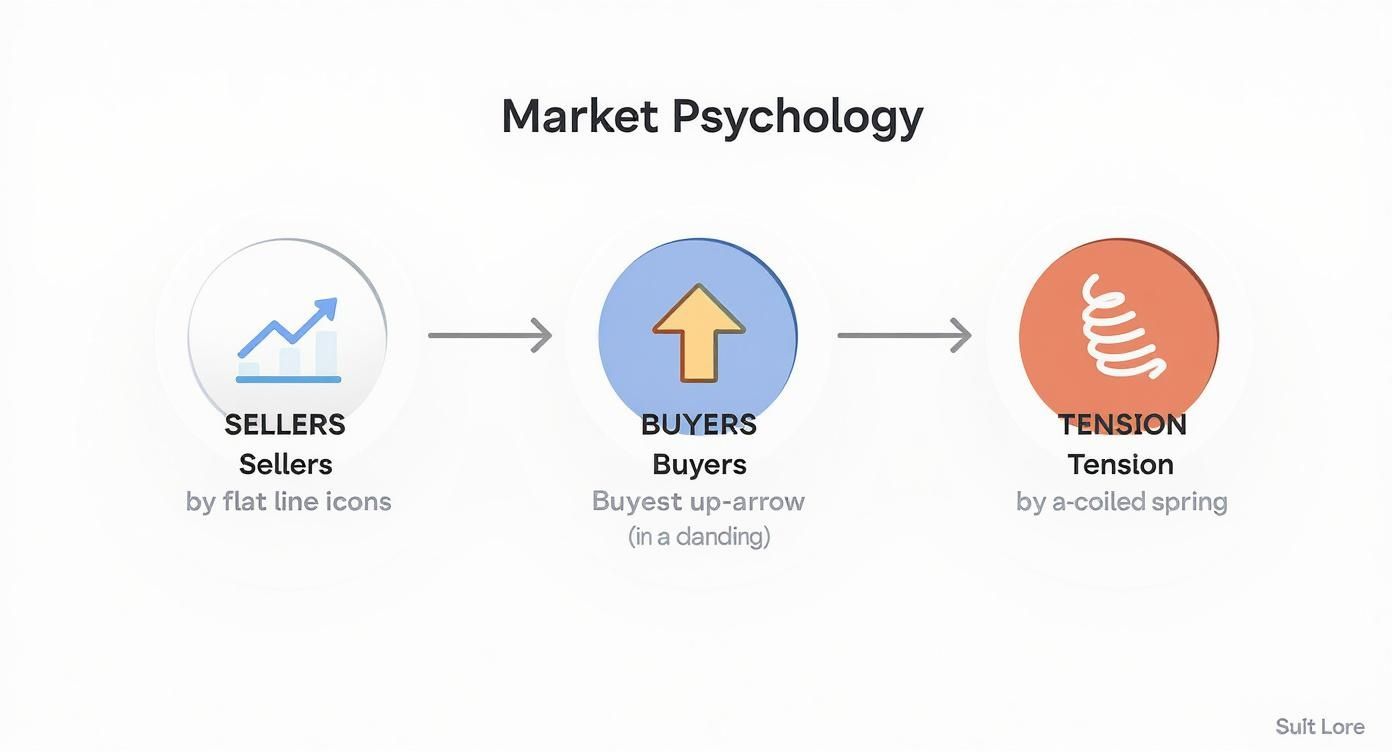
As you can see, the buyers keep stepping up, creating those higher lows. Eventually, they simply overwhelm the sellers holding the line at that flat resistance, and that pent-up energy gets released in a powerful move.
Step 1: Confirming the Breakout
A real breakout isn't just the price poking its nose above the resistance line for a second. This is where patience pays off. So many traders get chopped up by jumping the gun on a "false breakout," where the price teases a move higher only to get smacked right back down into the pattern.
To avoid that trap, you need confirmation. The most powerful signal is a candle that closes decisively above the horizontal resistance. This shows the bulls not only had the strength to punch through the wall of sellers but also to hold that new ground for the entire session.
Another critical piece of the puzzle is trading volume. A genuine breakout should explode on a massive spike in volume. This surge tells you that big money and a flood of market participants are backing the move, giving it the fuel it needs to keep running. A breakout on quiet, weak volume is a huge red flag.
Step 2: Planning Your Entry
Once the breakout is confirmed, it's time to figure out how you're getting in. There are two main ways to do it, and each has its own pros and cons.
- Enter on the Breakout Candle: This is the aggressive approach. As soon as that confirmation candle closes above resistance, you're in. It ensures you catch the move if it takes off like a rocket. The trade-off? You're buying at a higher price, which means your initial risk is a bit wider.
- Wait for the Retest: This is the more conservative, patient play. You wait for the price to pull back and "retest" the old resistance line, which should now act as a new floor of support. This often gives you a much better entry price and adds another layer of confirmation. The risk, of course, is that the price never looks back and you get left behind.
Your choice here really comes down to your personal trading style and risk appetite. Regardless of which you pick, understanding how to trade breakouts effectively is a fundamental skill that goes way beyond this single pattern.
Step 3: Setting Your Stop-Loss
This is non-negotiable. Smart risk management is what separates professional traders from gamblers, and your stop-loss is your ultimate safety net. It defines exactly how much you're willing to lose if the trade goes south.
For an ascending triangle, the most logical spot for your stop-loss is just below the rising support trendline. Why? Because if the price breaks that trendline, the entire bullish story of the pattern is invalidated. The reason for the trade is gone, and you need to get out to protect your capital.
Don't place it too tight to the breakout level, though. Normal market noise and volatility can easily wick you out of a perfectly good trade.
Pro Tip: Always give your stop some breathing room. Placing it a few ticks below the trendline or under the low of the last swing inside the triangle helps you survive the random volatility without taking unnecessary losses.
Step 4: Establishing Your Profit Target
The final piece is knowing where to get out when you're right. A clear profit target keeps greed in check and prevents you from letting a great winner turn into a loser. The classic technique for an ascending triangle is called the "measured move."
Here's the simple calculation:
- Measure the Height: Take the vertical distance from the lowest swing low of the pattern up to the flat resistance line. This is the "height" of the triangle.
- Project the Target: Add that same height to the price where the breakout occurred. That resulting price level is your minimum profit target.
This method uses the pattern's own geometry to give you a logical, data-driven target. It turns a simple shape on a chart into a complete trading plan with a defined risk and a clear reward.
How the Ascending Triangle Plays Out on Real Charts
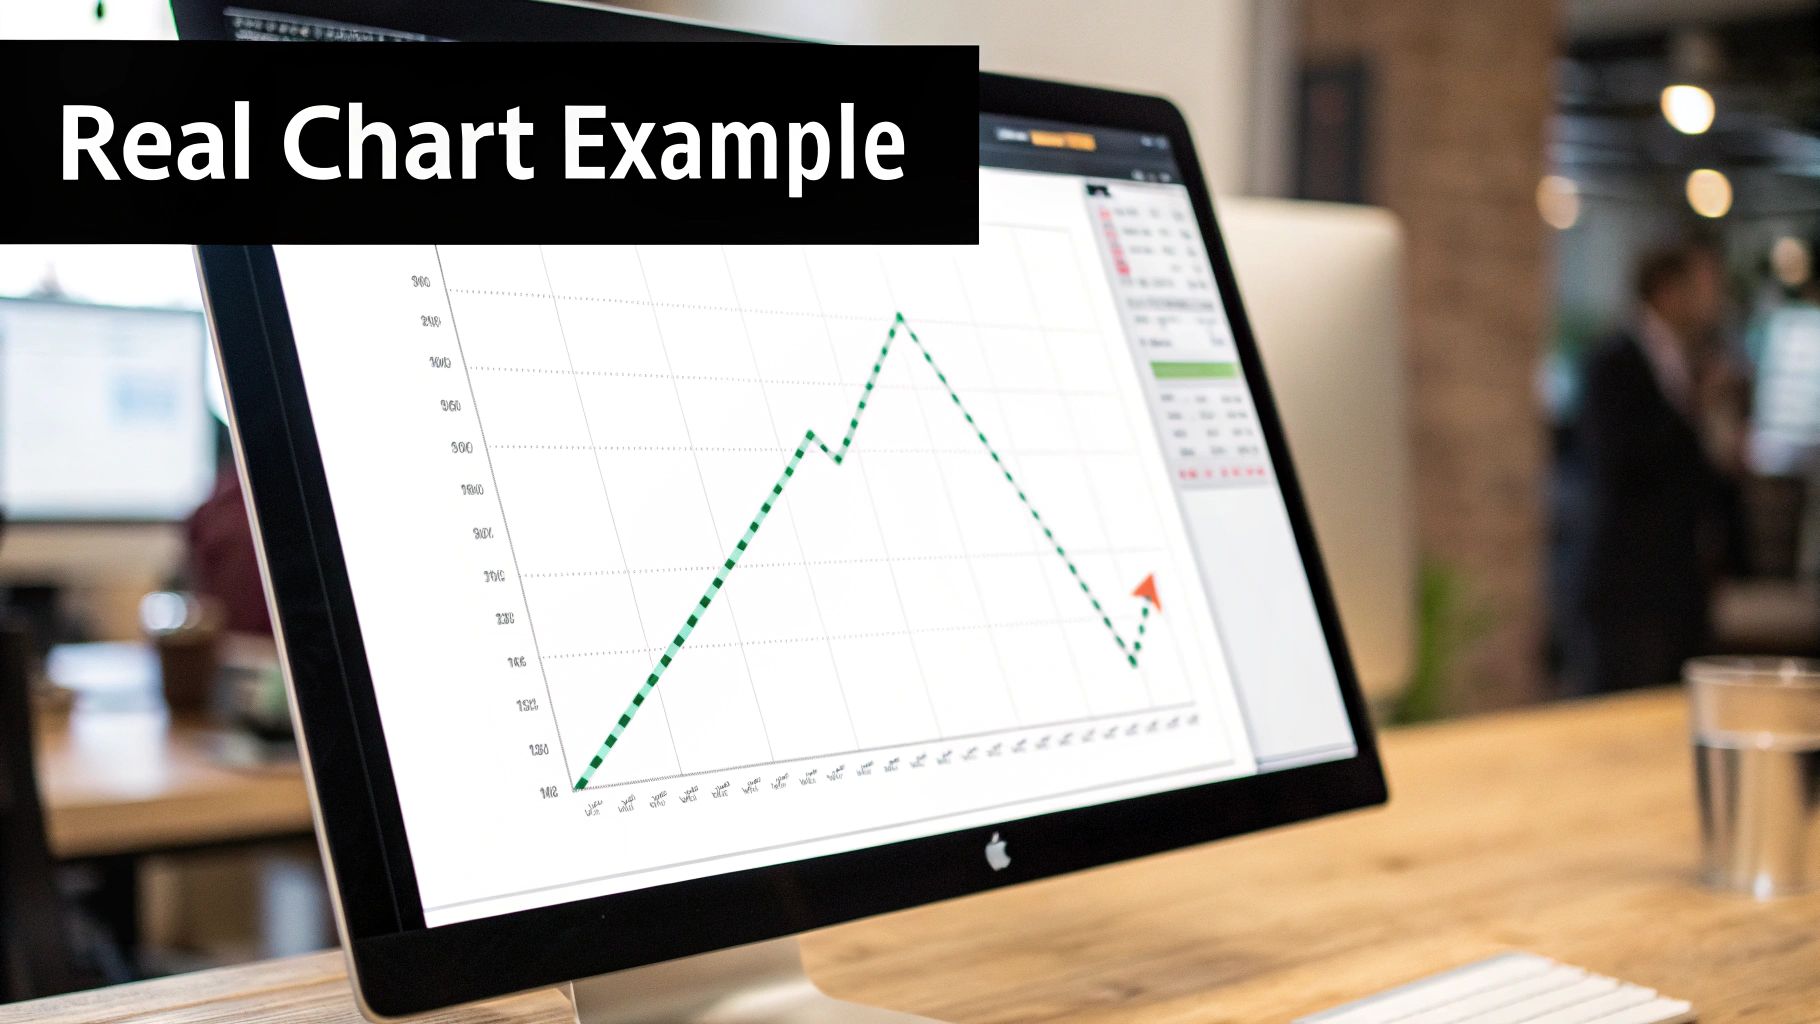
Watching a pattern in action carries a different weight than reading about it. When you peel back the layers of an ascending triangle on a live chart, theory and practice finally shake hands.
By breaking a real example down—from the first higher low to the breakout candle—you’ll witness market psychology in motion. Over time, these observations build a visual library of what a high-probability setup truly looks like.
Let’s zoom in on each stage of a classic triangle and mark what to look for on your own charts.
Case Study: A Textbook Formation
History offers plenty of strong breakouts born from ascending triangles. One of the clearest examples happened with Primus Telecom (PRTL) in 1999. Over a six-month stretch, PRTL sketched out a textbook triangle. For a closer look at this setup, see the chart pattern example on StockCharts.com.
What makes this case so instructive is its drawn-out development. Longer consolidation often leads to more decisive breakouts. We can divide the pattern into two main phases:
-
Phase 1: The Initial Setup
Horizontal resistance formed at $24. Multiple rallies bumped into that ceiling, confirming it as a solid supply zone. -
Phase 2: The Consolidation
Buyers stepped in at successively higher lows, creating an upward-sloping trendline. At the same time, volume drifted lower—a classic sign the market was coiling.
Patience pays off. Jumping into an unfinished pattern is one of the most common—and costly—mistakes traders make.
The Decisive Breakout And Follow-Through
After months of quiet compression, PRTL finally sliced through $24. Volume spiked, validating that buyers had overwhelmed sellers. That surge signaled genuine conviction, and the stock launched into a powerful uptrend.
Key Ingredients For Your Trade Screen:
- Clear Boundaries: A flat resistance line plus a rising support trendline.
- Volume Contraction: Declining volume during the squeeze.
- Breakout With Volume: A decisive close above resistance on expanded volume.
Spot, confirm, execute. Mastering this sequence turns the ascending triangle from a simple drawing into a reliable tool for riding bullish moves.
Why This Pattern Gives Traders a Statistical Edge
Successful trading isn't about finding a crystal ball; it's about consistently putting the odds in your favor. The ascending triangle is a favorite among professionals for one simple reason: it offers a quantifiable, data-backed advantage.
This isn't just another shape on a chart. It’s a recurring market behavior with a proven history of tipping the scales toward a bullish outcome. When you trade an ascending triangle, you aren’t guessing. You’re acting on a high-probability setup that has played out countless times across different markets, giving you a real statistical foundation for your decisions.
Backed by Historical Performance
The real power here comes from the pattern's reliability over time. A ton of analysis shows the ascending triangle isn't just some textbook theory; it delivers results, especially when the market is already pushing higher.
Statistical analysis shows the ascending triangle has a notable success rate in predicting bullish moves. Based on two decades of research, the pattern has an impressive success rate of around 83% in bull markets. That means in over eight out of ten instances, the price breaks out to the upside and continues the trend.
This high success rate elevates the pattern from a simple observation to a strategic weapon. It lets you enter trades with more confidence, knowing that historical data is on your side.
Favorable Risk-Reward Dynamics
Beyond just a high win rate, the ascending triangle naturally sets you up with a great risk-to-reward profile. The structure of the pattern itself gives you a clear and logical way to manage your trade from start to finish.
The potential reward is defined by the "measured move"—a simple technique that projects a price target based on the pattern's height. On the flip side, your risk is crystal clear: the rising support trendline. If the price breaks below that line, the bullish idea is dead, giving you a perfect, tight spot for your stop-loss.
This structure is a trader's dream:
- Defined Risk: You know exactly where you’re wrong and where to get out.
- Logical Target: Your profit goal is based on the pattern's geometry, not guesswork or emotion.
- Asymmetrical Bets: The potential gain from a clean breakout often dwarfs the potential loss if the pattern fails.
That same historical data shows that successful breakouts produce an average price jump of about 43%. When you weigh that kind of upside against the small, controlled risk of a stop-loss just below the trendline, you get the kind of asymmetrical opportunities that separate amateurs from pros.
As you start using this pattern, it’s crucial to track their financial performance to see if your strategy is actually working and manage your money well. This helps you confirm you have an edge and make smart, data-driven adjustments over time. At the end of the day, the pattern provides a repeatable setup where the potential rewards consistently justify the calculated risks.
Common Trading Mistakes and How to Avoid Them

Even a textbook pattern with a high success rate can burn you if you get careless. The ascending triangle has a few classic traps that catch undisciplined traders, turning a promising setup into a frustrating loss. Knowing these pitfalls is just as critical as knowing how to spot the pattern itself.
The most notorious trap of them all is the false breakout. We’ve all been there. Price pokes its head above the horizontal resistance, luring in all the eager buyers, only to slam back down into the pattern. It's a classic bull trap designed to prey on impatience, and it works wonders on traders who jump the gun.
Your best defence here is simple: patience and confirmation. Don't ever enter a trade just because the price has pierced the resistance line. Wait for a candle to close decisively above that level. Even better, look for a noticeable surge in trading volume on that breakout candle. This simple filter helps weed out the weak, faked-out moves from the genuine, conviction-backed breakouts.
Ignoring the Bigger Picture
Another common blunder is trading the ascending triangle in a vacuum. A perfect-looking triangle forming inside a powerful, established bear market is fighting a serious uphill battle. While the pattern itself is bullish, the overwhelming market context can easily snuff it out.
Always zoom out. Look at the broader trend on a higher timeframe before you even think about placing a trade. Ask yourself:
- Is the primary trend on the daily or weekly chart on my side?
- Are there any big economic news events or earnings reports coming up that could throw a wrench in the works?
- What's the overall market sentiment right now? Bullish, bearish, or just choppy?
A bullish pattern has the highest odds of success when it forms within a larger bullish trend. Trading against the dominant market current is like trying to swim upstream—it’s possible, but it takes a lot more effort and the risk is significantly higher.
Premature Entry and Misidentification
Impatience also shows up when traders enter before the ascending triangle pattern has even fully formed. A pattern isn't valid until it has at least two clear touches on both the resistance and support lines. Jumping in after only one or two swings isn't technical analysis—it's just guesswork.
This often goes hand-in-hand with misidentifying the pattern entirely. For example, it’s easy to confuse an ascending triangle with a rising wedge, which has two rising trendlines and is usually a bearish reversal signal. Mistaking one for the other can have you confidently taking a long position right before the floor drops out. Avoiding these general trading mistakes to avoid is paramount for long-term consistency.
The solution is pure discipline. Create a rules-based approach. Define the exact criteria that make an ascending triangle a valid, high-quality setup for you, and then stick to those rules without exception. This structured process removes emotion from the equation and ensures you’re only risking your capital on the best setups. Your trading account will thank you.
Got Questions? Let's Talk Triangles
Even with a solid plan, a few questions always pop up. Let's tackle some of the most common ones traders ask about ascending triangles to clear up any confusion and get you spotting them like a pro.
What Is the Difference Between an Ascending and Symmetrical Triangle?
The main giveaway is the top trendline and what it tells you about the market's mood.
An ascending triangle pattern is defined by its flat, horizontal resistance line. This is a dead giveaway that buyers are aggressively pushing up against a specific price level where sellers are parked. This structure gives it a clear bullish bias.
A symmetrical triangle, on the other hand, has two converging trendlines—one sloping down and one sloping up. It looks like a wedge. This shape screams indecision. Neither buyers nor sellers are in control, and the price could break out in either direction.
Can an Ascending Triangle Pattern Break Downwards?
Yes, and you should always be prepared for it. While it's a classic bullish pattern, it absolutely can—and does—fail. This happens when the price breaks decisively below the rising support trendline instead of popping above the resistance.
When this happens, it's actually a potent bearish signal. It tells you the buyers who were consistently stepping in at higher prices have run out of steam, and the sellers have taken over. This is precisely why disciplined risk management, especially setting a stop-loss below that rising trendline, is non-negotiable.
A pattern is just a high-probability setup, not a crystal ball. Respecting the risk of failure with a stop-loss is what separates professional traders from gamblers.
What Is the Best Timeframe to Use for This Pattern?
The beauty of the ascending triangle is its versatility. You can find it on almost any chart, from a 5-minute timeframe for scalpers to a weekly chart for long-term position traders.
That said, its reliability tends to increase with the timeframe. Patterns that form over weeks or months on the daily or weekly charts are far more significant. They represent a longer, harder-fought battle between bulls and bears, and when they finally break, the resulting move is often much more powerful and sustained.
How Important Is Volume for Confirming a Breakout?
Volume is critically important. Think of it as the ultimate lie detector. A genuine, high-conviction breakout from an ascending triangle must be accompanied by a noticeable surge in trading volume.
This spike shows that the big players are jumping in, providing the fuel needed to sustain the rally. A breakout on weak or declining volume is a massive red flag. It suggests there's no real conviction behind the move, and the odds of a "false breakout"—where the price snaps right back into the pattern—go way up. Always look for that volume confirmation.
At Colibri Trader, we teach traders how to master powerful price action setups just like this one, without the clutter of indicators or guesswork. If you want to learn to trade with clarity and confidence, check out our action-based programs at https://www.colibritrader.com.