


A Price Action Trader’s Guide to the Adam and Eve Pattern
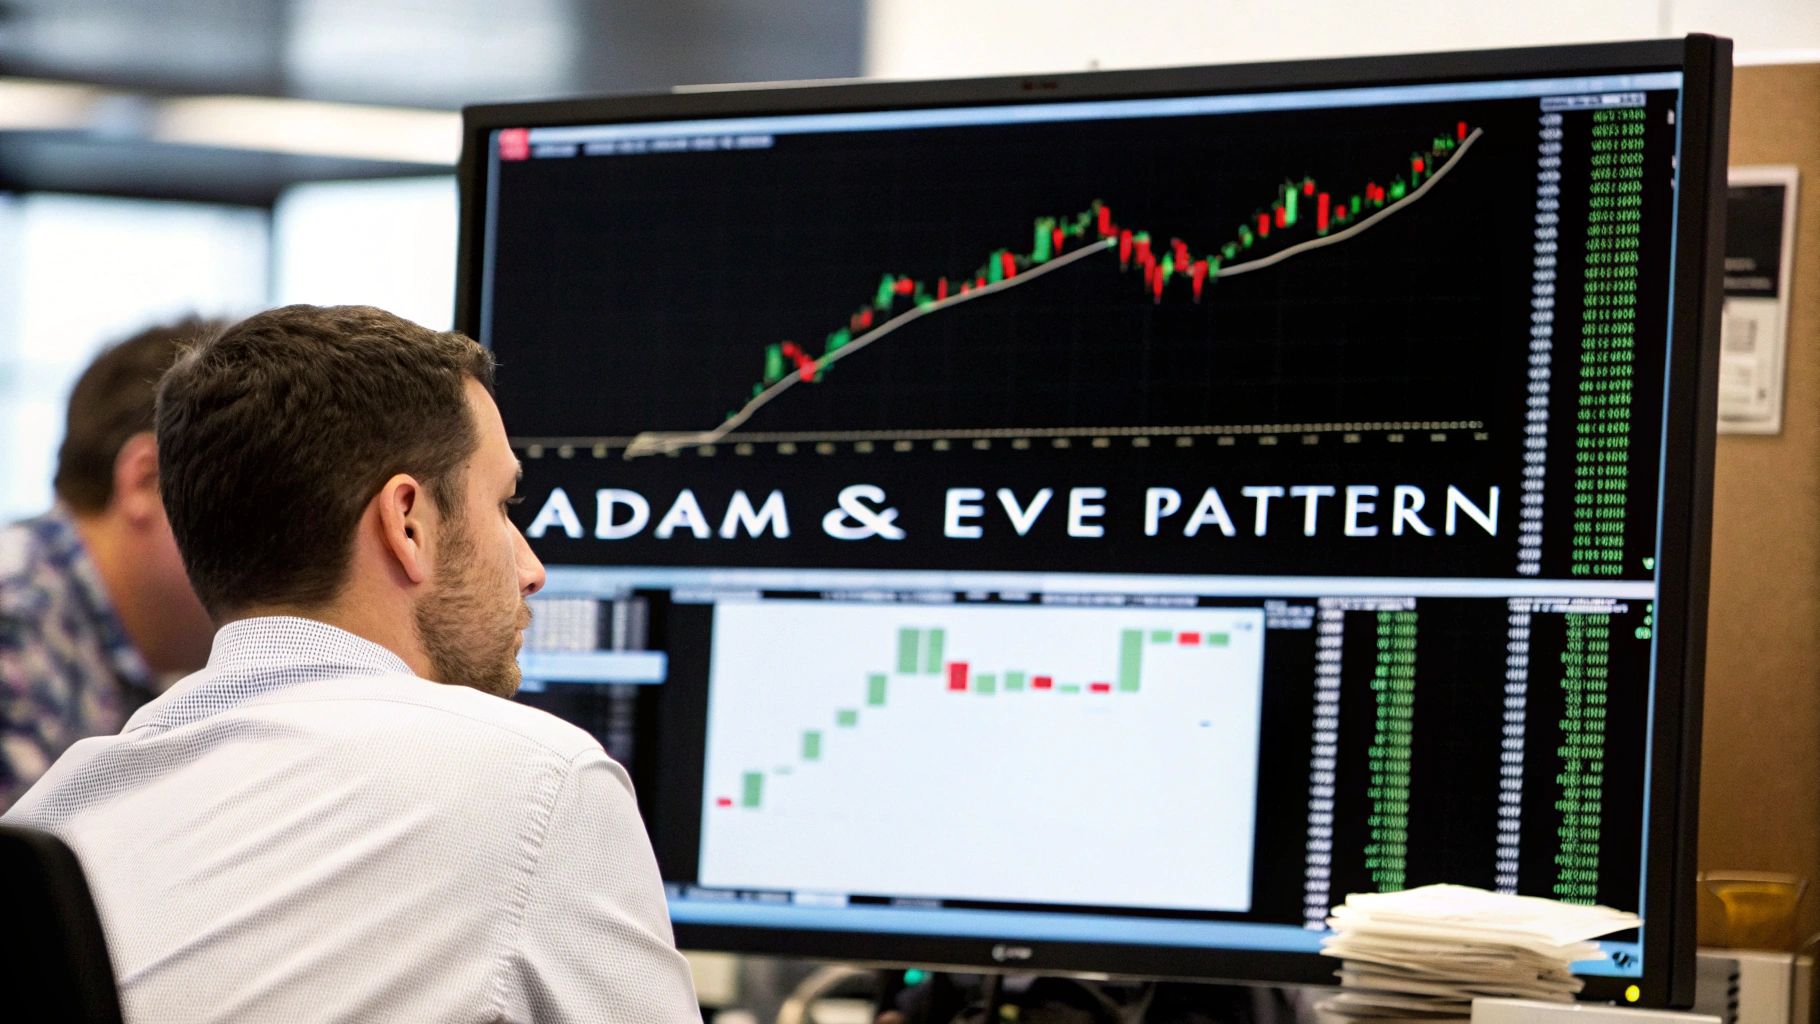
The Adam and Eve pattern is a classic chart formation that often signals a major trend reversal. In simple terms, it's a double bottom pattern with a very distinct personality. It consists of a sharp, V-shaped low (Adam) followed by a wider, more rounded low (Eve).
This combination paints a clear picture of shifting market psychology, moving from outright panic to a period of quieter, more methodical buying. It’s a powerful setup that frequently appears at the tail end of a prolonged downtrend.

Decoding The Adam And Eve Pattern
The beauty of the Adam and Eve pattern is that it tells a compelling story about market sentiment without a single indicator. You can see the narrative playing out right on the chart: a trend dies a sudden, violent death and is then slowly reborn.
Think of it as a sharp market panic that eventually gives way to a phase of quiet, confident rebuilding. This makes it one of the more intuitive price action patterns you can learn.
The formation is made of two key pieces that, when they show up together, create a potent reversal signal:
Adam (The 'V' Bottom): This is the first act. It's defined by a sharp, aggressive drop in price followed by an equally sharp recovery. This V-shape represents a moment of pure capitulation where panicked sellers dump their positions, driving the price down in a hurry. The swift rebound shows that buyers stepped in with equal force, seeing an opportunity.
Eve (The 'U' Bottom): After the drama of Adam, the market tries to make a second low, but this time it’s much slower and more drawn out. This part of the pattern is a wide, rounded bottom that looks like a gentle scoop. It signifies a period where patient, often larger, market players are quietly accumulating positions, absorbing any leftover selling pressure without creating sharp spikes.
The magic happens when you combine the initial panic sell-off (Adam) with the calm accumulation that follows (Eve). This sequence suggests that the aggressive selling has finally run out of steam and a new, more stable base is being built for a major move in the other direction.
Adam Vs Eve: A Visual Breakdown
To make sure you can spot these two components clearly, here’s a quick side-by-side comparison. It's crucial to distinguish between the sharp, emotional action of Adam and the slow, deliberate nature of Eve.
| Characteristic | Adam ('V' Bottom) | Eve ('U' Bottom) |
|---|---|---|
| Shape | Sharp, narrow, V-shaped | Wide, rounded, U-shaped |
| Psychology | Panic, capitulation, fear | Accumulation, patience, stability |
| Speed | Fast price drop and recovery | Slow, grinding price action |
| Volume | Often a spike on the low | Tends to be lower, more consistent |
Recognizing these differences is the first step to properly identifying the full pattern and understanding the story the market is telling you.
A Historically Strong Performer
This pattern isn’t just a pretty picture; it has the numbers to back it up. Research from veteran trader Thomas Bulkowski shows that the Adam & Eve double bottom is a top-tier performer.
His work found that it leads to an average price increase of 41% after a confirmed breakout. That kind of performance easily beats the typical annual returns of major stock indexes, which speaks volumes about its reliability.
Reading the Story Behind the Chart Pattern
If you really want to get good at trading the Adam and Eve, you have to look past the technical shape and see the human story playing out on the chart. Every pattern tells a tale of fear, greed, and the shifting balance of power. This one is a dramatic two-act play about a violent panic followed by a quiet, calculated takeover.
The first act is all about capitulation. That sharp, V-shaped "Adam" bottom isn't a gentle slide; it's a fire sale. It’s the visual evidence of pure panic, where fearful traders dump their holdings in a frenzy, convinced the asset is heading to zero. The speed of the drop shows a market completely swamped by sellers, but the equally fast rebound tells you that panic was met with aggressive, opportunistic buying.
The Quiet Transfer of Power
After all that chaos, the second act begins. The "Eve" formation shows a complete change in who's running the show. While Adam was loud and violent, Eve is slow, methodical, and almost silent. This rounded bottom is the footprint left by patient, large-scale players—what many call "smart money"—who are calmly soaking up any leftover sell orders.
They aren't trying to spike the price. They're just accumulating, buying up everything they can at a price they like. This slow grind is designed to shake out the last of the weak hands while the big players build their positions without tipping off the rest of the market.
The contrast between the failed sharp thrust (Adam) and the failed rounded retest (Eve) underscores a clear shift to bearish control [in a top] or bullish control [in a bottom]. This makes the Adam & Eve version psychologically stronger than an even twin-peaked double bottom.
This slow accumulation phase is so important because it builds a solid base for the next major trend. The lack of volatility during Eve’s formation is a massive clue that the sellers have finally run out of steam.
From Fear to Confidence
When you boil it down, the Adam and Eve pattern is a visual record of ownership being transferred from the panicked retail crowd to disciplined professionals. It’s a full market cycle in miniature:
- Panic: The V-shaped Adam bottom shows the final, emotional washout of sellers.
- Accumulation: The U-shaped Eve bottom reveals a period of deliberate, quiet buying.
- Confidence: The breakout above the neckline confirms that buyers are now firmly in control, ready to push the price much higher.
Seeing the pattern this way—as a story about market psychology instead of just a shape—is what separates consistently profitable price action traders from the rest. It lets you anticipate what's coming next because you understand the powerful emotions that created the setup in the first place.
How To Trade The Adam and Eve Pattern Step By Step
Knowing what the Adam and Eve pattern looks like is one thing, but actually placing a winning trade based on it? That's a completely different game. Success here isn't about guesswork; it's about following a clear, disciplined, step-by-step plan.
Think of this framework as your pre-flight checklist. It ensures you enter, manage, and exit your trades with precision, whether you're looking at a bullish bottom or a bearish top.
The whole process boils down to one word: patience. The single biggest mistake traders make is jumping the gun—entering a trade before the market has actually confirmed the pattern is real. Every step I'm about to show you is designed to stop you from doing that, forcing you to wait for the market to prove itself.
This visual captures the market psychology perfectly. It flows from the initial panic selling that creates Adam, to the quiet accumulation during Eve's formation, and finally to the confidence that fuels the breakout.
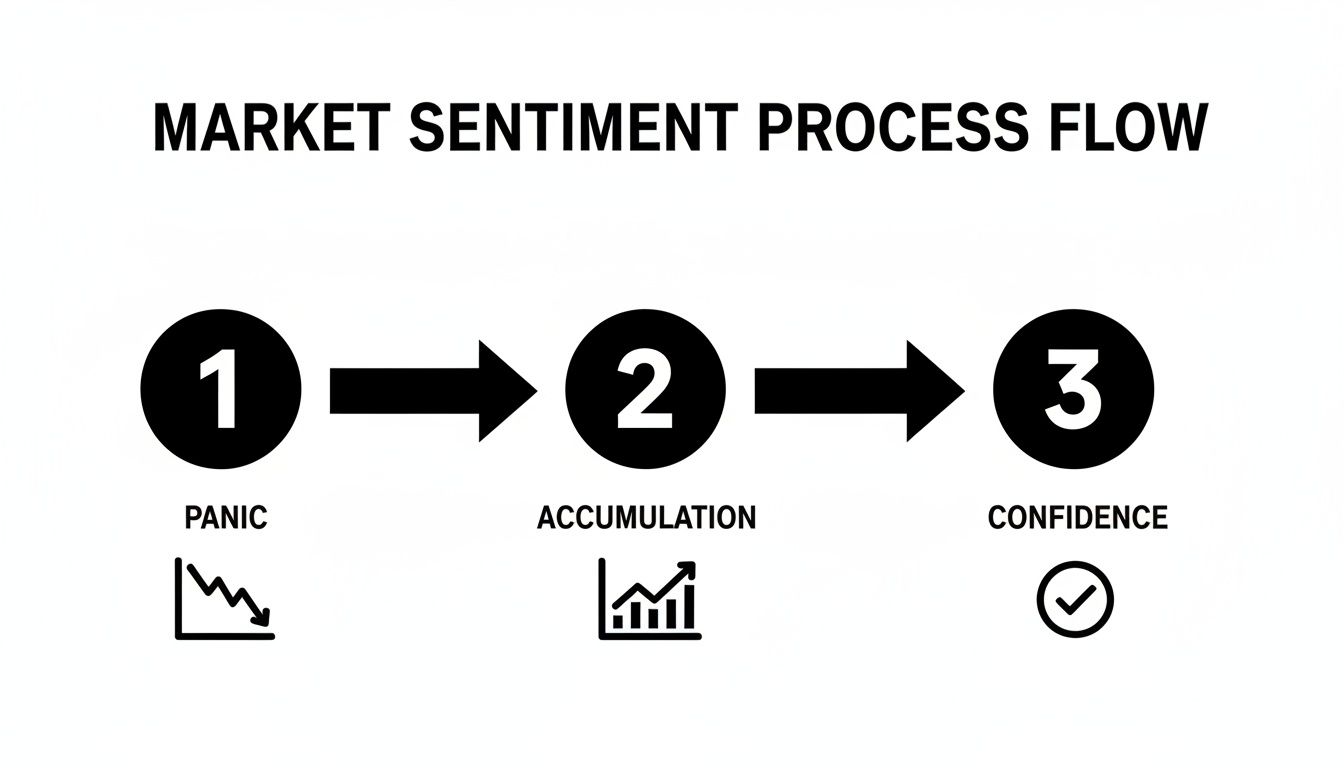
This emotional journey is precisely why waiting for that final confirmation—the breakout—is the most critical part of the entire setup.
Step 1: Identify The Key Components
Your first job is to correctly identify the pattern's anatomy on your chart. Don't try to force it. A good, valid Adam and Eve pattern should be clean and jump out at you.
- Spot Adam and Eve: First, find the sharp, V-shaped price action of Adam. Next to it, you should see the slower, wider, U-shaped bottom of Eve. For the pattern to be valid, the bottoms (in a bullish setup) or tops (in a bearish one) must be at roughly the same price level.
- Draw the Neckline: The neckline is the horizontal line you draw across the peak that separates Adam and Eve. This line is everything. It's your trigger for the trade.
Step 2: Wait For The Confirmed Breakout
I can't stress this enough: patience is everything here. A potential pattern is not a tradable pattern until that neckline is decisively broken. Entering early is just gambling.
The breakout needs to happen on a candle that closes above the neckline (for a bullish pattern) or below it (for a bearish one). A wick that just pokes through doesn't count. That’s a classic trap that often leads to a sharp reversal.
What’s more, you need to see a noticeable surge in trading volume on that breakout candle. High volume is your confirmation slip. It shows that the big players—the smart money—are behind the move with real conviction. A breakout on weak, low volume is a massive red flag that suggests the move has no real power.
Step 3: Execute The Trade Plan
Once you have a confirmed breakout with strong volume, it's time to act. This means defining your entry point, stop loss, and price target before you even think about clicking the buy or sell button.
- Entry Point: The most reliable entry is on the close of the breakout candle. Some traders prefer to wait for a potential retest of the broken neckline, which can offer a better risk-to-reward ratio, but be warned—the retest doesn't always happen.
- Stop Loss Placement: For a bullish (bottom) pattern, your stop loss goes just below the lowest point of the Eve formation. For a bearish (top) pattern, place it just above the highest point of Eve's rounded peak. Our guide on how to set a proper stop loss offers more detailed strategies for this.
- Price Target Calculation: The classic method is to measure the height of the pattern, from its lowest low (Adam or Eve) right up to the neckline. You then project this distance upward from the breakout point for a bullish target or downward for a bearish target.
Here’s a simple checklist to keep you honest before you enter a trade. Go through it every single time.
Adam and Eve Trading Plan Checklist
| Step | Bullish Pattern (Bottom) | Bearish Pattern (Top) |
|---|---|---|
| 1. Identification | Clear "V" (Adam) and "U" (Eve) bottoms at similar price levels? | Clear "A" (Adam) and "∩" (Eve) tops at similar price levels? |
| 2. Neckline | Neckline drawn across the resistance peak between Adam and Eve? | Neckline drawn across the support low between Adam and Eve? |
| 3. Breakout | Has a candle CLOSED above the neckline? | Has a candle CLOSED below the neckline? |
| 4. Volume | Was the breakout accompanied by a significant increase in volume? | Was the breakdown accompanied by a significant increase in volume? |
| 5. Entry | Entry planned on breakout close or retest? | Entry planned on breakdown close or retest? |
| 6. Stop Loss | Stop loss placed just below the low of the Eve formation? | Stop loss placed just above the high of the Eve formation? |
| 7. Target | Profit target calculated and set? (Height of pattern projected up) | Profit target calculated and set? (Height of pattern projected down) |
When you follow a plan, you remove emotion from the equation. Your only job is to follow the rules you’ve already set, protecting your capital and giving the pattern the space to play out.
Real Chart Examples of Winning Trades
Theory is great, but seeing a pattern play out in the wild is where the real learning happens. To bridge that gap, let’s look at the Adam and Eve pattern in action across a couple of different markets. This is how you can spot major turning points before they become obvious to everyone else.
These examples will walk you through a bullish reversal that kicked off a monster uptrend and a bearish reversal that nailed a major top. Watch closely how the key pieces—the V-shape, the U-shape, the neckline, and volume—all fall into place to signal a high-probability trade.
Bullish Reversal Example in Cryptocurrency
Crypto charts are known for their explosive moves, which makes them a fantastic place to find clean, powerful price action patterns. The end of the 2022 crypto winter gave us a textbook Adam and Eve bottom that was practically screaming a new bull market was on the horizon.
Bitcoin carved out a picture-perfect Adam and Eve bottom around $16,000 in late November 2022, showcasing the pattern’s predictive power. The breakout above the $18,000 resistance lit the fuse for a massive bull run, sending Bitcoin soaring to $30,000 by April 2023. That’s a staggering 88% surge in just five months.
What confirmed the move? A volume spike of over 35% on the breakout candle, showing that serious buying power was stepping in.
Let’s break down what made that trade work:
- Adam 'V' Bottom: The initial low was a sharp, violent sell-off. Classic panic selling.
- Eve 'U' Bottom: Price then settled into a slower, more rounded base as smart money quietly started buying.
- Neckline: A clear line in the sand formed right around the $18,000 resistance level.
- Breakout: The price finally punched through the neckline on a huge surge in volume. That was the green light.
This setup was a masterclass in market psychology. You could literally see the market shift from extreme fear to confident buying, a dynamic we also explore in our guide to the bull engulfing pattern.
Bearish Reversal Example in Forex
The Adam and Eve isn't just for bottoms or crypto. It’s just as powerful for spotting major tops in forex pairs, signaling that a strong uptrend is running out of steam.
Imagine a major pair like EUR/USD after a long rally. The chart forms a sharp, V-shaped peak (Adam) as the last of the retail crowd piles in, followed by a slower, rounded second peak (Eve). This second peak is often where the big institutions start quietly offloading their positions.
A breakdown below the neckline support separating the two peaks is the final confirmation. It's the market telling you the bulls have officially lost control and the bears are now in charge.
For this kind of setup, a trader's game plan would look something like this:
- Identify the sharp "A" top of Adam and the softer, rounded "∩" top of Eve.
- Draw the horizontal support—the neckline—that connects the low point between the two peaks.
- Wait for a strong candle to close below that neckline, preferably on higher selling volume.
- Enter a short position. A logical stop-loss would be just above the high of the Eve formation.
- Set a price target by measuring the height of the pattern (from the peak to the neckline) and projecting that distance down from the breakdown point.
Common Mistakes Traders Make with This Pattern
Spotting a clean Adam and Eve pattern is a great first step, but the real money is made by sidestepping the common traps that snag so many traders. Knowing these pitfalls is just as critical as recognizing the setup itself. A textbook pattern can quickly turn into a losing trade if you let impatience or sloppy execution take over.
The most common—and most expensive—mistake is jumping the gun. Traders see the pattern taking shape, the fear of missing out kicks in, and they enter before the neckline officially breaks. But until a candle closes firmly beyond that line, backed by some real volume, the pattern is just a potential setup. Nothing more.
Entering Before Confirmation
Entering a trade early isn't a skill; it's a gamble. The market loves to fake out eager traders. You'll often see price wick just above resistance or below support, teasing a breakout, only to violently snap back and trap everyone who jumped in too soon.
Your rule has to be unbreakable: no confirmed close, no trade. A breakout is only real when the candle finishes its session on the other side of that neckline. Anything less is just market noise. This one filter will save you from an incredible number of failed trades and keep your capital safe for the real high-probability moves.
The contrast between the failed sharp thrust (Adam) and the failed rounded retest (Eve) underscores a clear shift to bearish control. This makes the Adam & Eve version psychologically stronger, but only after the neckline officially gives way.
Ignoring volume is another classic blunder. A breakout that happens on weak, anemic volume is a massive red flag. It tells you the big players aren't convinced. A genuine, powerful move is almost always fueled by a noticeable surge in trading activity.
Mismanaging Risk and Forcing the Pattern
Even if your entry is perfect, poor risk management can kill the trade. Two mistakes are especially common here: setting your stop-loss way too tight and trying to see a pattern on a messy chart.
Setting Stops Too Close: Placing your stop-loss just a few ticks beyond the neckline is asking to get shaken out by normal market chop. Your stop needs a logical home—below the low of Eve for a bullish pattern or above its high for a bearish one. Give the trade some room to breathe.
Forcing a Messy Pattern: Not every double bottom or top is an Adam and Eve. If you have to squint and tilt your head to see the distinct V-shape and U-shape, the pattern simply isn't there. A valid setup should be clean, clear, and obvious to anyone looking at the chart. Forcing a trade on a sloppy, ambiguous chart is just a fast way to give your money away.
In the end, trading this pattern successfully boils down to discipline. You have to wait for every piece of the puzzle to fall into place: the clean shape, the confirmed breakout, the surge in volume, and a pre-planned risk strategy. By avoiding these common mistakes, you shift the odds dramatically in your favor.
Your Top Questions Answered
Even with a crystal-clear trading plan, questions always pop up when you start seeing a pattern on a live chart. Getting those questions answered ahead of time can mean the difference between a confident trade and a moment of hesitation that costs you. Let's tackle the most common things traders ask about the Adam and Eve pattern.
We’ll get into the best charts to use, whether you need indicators, and exactly what to do when a trade doesn't go your way. Think of this as the practical field guide you'll want handy when you're in the trenches.
What Are The Best Timeframes For This Pattern?
One of the best things about the Adam and Eve is its fractal nature. The market psychology that builds this pattern is universal, showing up on just about every timeframe. That said, it's far more reliable on longer-term charts where the major trends live.
- Daily and Weekly Charts: This is the gold standard. When an Adam and Eve forms over several weeks or even months on a daily chart, it's often signaling a major, long-lasting shift in trend. The signals are cleaner and you're less likely to get shaken out by market "noise."
- 4-Hour and 1-Hour Charts: This is a sweet spot for swing traders. A solid setup on a 4-hour chart can kick off a significant move that plays out over several days.
- Lower Timeframes (Below 1-Hour): You'll see the pattern on 15-minute charts, but it's a different beast down there. The increased noise and volatility lead to a lot more false signals and failed breakouts. You have to be much nimbler.
My advice? Start by hunting for these on the daily and weekly charts. The patience it takes is almost always rewarded with bigger, more predictable moves.
Is It Necessary To Use Indicators With This Pattern?
Honestly, no. In fact, I'd argue against it. The real power of the Adam and Eve is that it’s a pure price action pattern. The entire story—the panic, the exhaustion, the quiet buying—is told right there in the price bars.
Tossing indicators like an RSI or MACD on top often just creates "analysis paralysis." The pattern is showing you a clear psychological shift, but your indicator might be flashing a conflicting signal about momentum. This just muddies the water.
The only "indicator" that truly matters with the Adam and Eve is volume. A breakout that happens on weak volume is a massive red flag. It screams a lack of commitment from the big players.
Stick with a clean, indicator-free chart. It forces you to read what the market is actually doing, which is the most important skill you can build.
How Is This Different From A Normal Double Bottom?
This is a great question, and the distinction is crucial. While both are reversal patterns, a standard double bottom is more generic. It's often just two similar-looking troughs that form a "W" shape. The Adam and Eve tells a much more detailed story.
The difference comes down to the shape and character of the two lows:
- Adam's 'V' Shape: The first low is sharp, nasty, and violent. It’s a picture of pure panic selling and capitulation.
- Eve's 'U' Shape: The second low is slow, rounded, and methodical. It takes longer to form because it represents a period of quiet, deliberate accumulation, not a knee-jerk bounce.
It's this V-then-U sequence that gives the pattern its psychological punch. It shows not just that a level was defended twice, but that the entire mood of the market shifted from frantic fear to calm confidence between those two tests.
What Should I Do If A Breakout Fails?
Failed breakouts are just part of the game. They happen. The trick isn't to avoid them, but to have a plan for when they occur. If the price pushes through the neckline but then quickly retreats and closes back inside the pattern, the setup is most likely dead in the water.
This is where your stop loss is your best friend. If you took a long trade on the breakout and the price dives back below the neckline, hitting your stop loss (which should be placed below Eve's low), the trade is over. Take the small, managed loss and move on.
Whatever you do, don't hang on and hope. A failed pattern is a powerful signal in itself, and it often leads to a fast, sharp move in the opposite direction.
At Colibri Trader, we focus on teaching traders how to read the story of the market through pure price action, just like this. Our programs are built to give you the skills and confidence to trade without a mess of confusing indicators. Find out how we can help you take your trading to the next level at https://www.colibritrader.com.