


Accumulation Manipulation Distribution: Decode Smart Money Moves

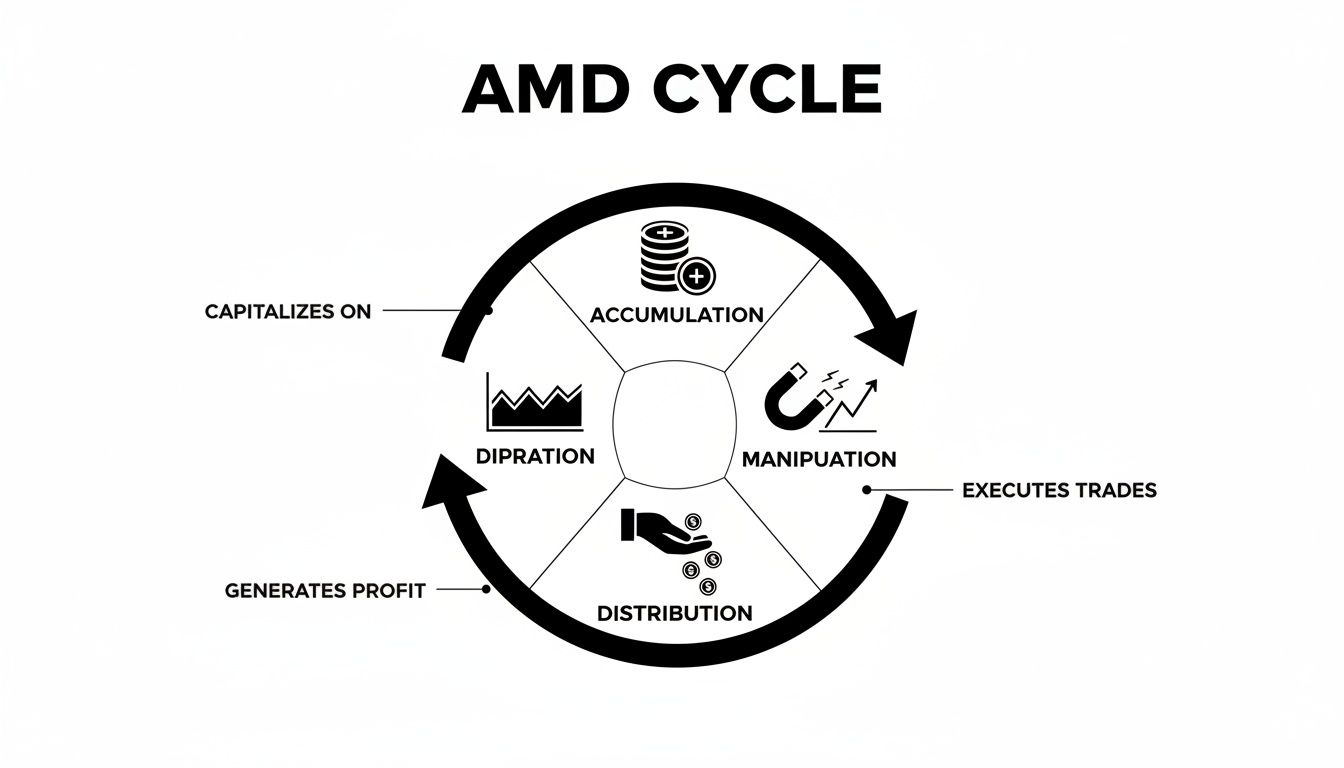
The accumulation manipulation distribution cycle is the market's hidden blueprint. It reveals how institutional traders, or "smart money," quietly build positions (accumulation), engineer price moves to trap retail traders (manipulation), and then sell everything off at a premium (distribution).
Learning to spot this three-act play is the key to trading with the big players, not against them.
Understanding The Market's Three-Act Play
To find any real consistency in trading, you have to learn to see the story the market is telling beyond just random price wiggles. The concept of accumulation, manipulation, and distribution (AMD) gives you a powerful framework for doing exactly that.
It's less of a rigid formula and more of a recurring narrative that plays out across all markets and all timeframes.
Think of it like a master retailer planning a huge sale. First, they quietly stock their inventory at wholesale prices, being careful not to cause a stir. This is the Accumulation phase. Large institutions patiently buy up assets, often when things look boring or sentiment is negative, which creates a solid floor under the price.
The Engine of The Cycle
Next, the retailer needs to generate some buzz. They might announce a "limited-time flash sale" to create a sense of urgency, driving frantic buying and clearing out smaller competitors. This is the Manipulation phase.
In the market, institutions will engineer sharp, often misleading, price moves. The goal is to trigger stop losses and trick emotional traders into taking the wrong side of the market. This chaos creates manufactured liquidity, allowing them to fill the rest of their large orders at the prices they want.
This diagram shows how the cycle flows, from the quiet institutional buying to the engineered traps and eventual selling.
As you can see, each phase logically sets up the next. For traders who know what to look for, it creates a predictable sequence of events.
The Final Act
Finally, with the crowd rushing in, the retailer sells the last of their inventory at a massive markup. This is the Distribution phase. Here, institutions begin to offload their positions onto the excited public, who are buying at peak prices.
The market may look incredibly bullish on the surface, but the smart money is quietly heading for the exits before the inevitable downturn.
To help you remember what each phase looks like and the psychology behind it, here is a quick summary.
The AMD Cycle at a Glance
| Market Phase | Institutional Goal | Typical Market Behavior | Retail Trader Emotion |
|---|---|---|---|
| Accumulation | Build a large position quietly at low prices. | Price moves sideways in a tight range; low volatility. | Boredom, Fear, Apathy |
| Manipulation | Create liquidity to fill remaining orders. | Sharp, fast moves that hunt stops; false breakouts. | Confusion, Panic, FOMO |
| Distribution | Sell the accumulated position at high prices. | Price looks very strong but struggles to make new highs. | Greed, Euphoria, Overconfidence |
This table captures the essence of the cycle, highlighting the stark contrast between the goals of institutional players and the emotional reactions of the retail crowd.
By learning to identify these three distinct phases, you can start to anticipate major market moves instead of just reacting to them. This cycle is a cornerstone of true price action analysis.
It's fundamental to understanding what market structure is and helps you move beyond basic patterns to start reading the institutional footprints left on your charts. The goal isn't just to spot the cycle but to align your trades with it.
How to Spot The Accumulation Phase
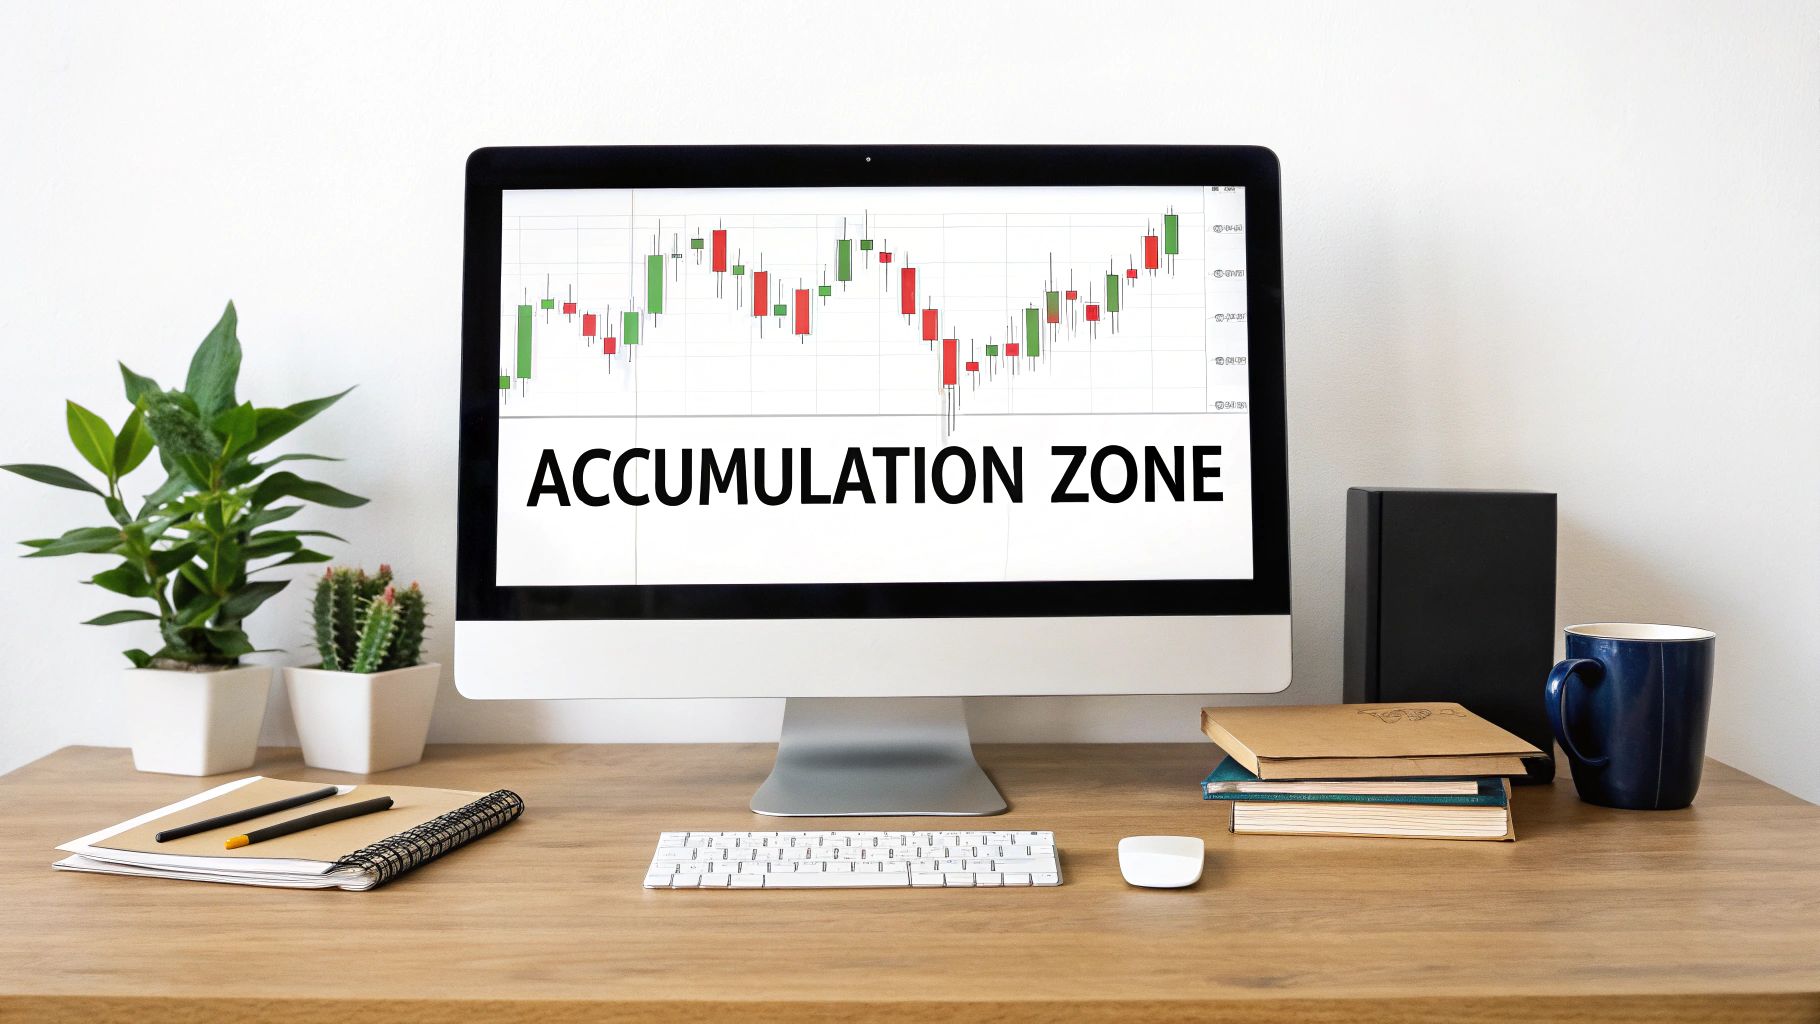
The accumulation phase is where the "smart money"—the big institutions and funds—quietly start building massive positions without alerting the rest of the market. On a chart, this usually just looks like a boring, sideways grind where nothing much is happening. To the average trader, it's a snoozefest. But for a price action trader, it's a huge flashing sign that a major move is being set up behind the scenes.
Learning to spot these zones of institutional buying is the first step toward trading with the market's biggest players instead of against them. It takes patience and a sharp focus on pure price action, letting you see the real story unfold without the distracting noise of lagging indicators. This is where the foundation for the entire accumulation manipulation distribution cycle is laid.
The Anatomy of an Accumulation Range
The most obvious sign of an accumulation phase is a long period of sideways price action, especially after a nasty downtrend. Think of a heavy ball rolling down a hill; accumulation is that flat stretch of ground where the ball finally loses momentum and settles. But this "settling" isn't random. It's the direct result of large buyers systematically soaking up all the selling pressure from panicked retail traders who are desperate to get out.
During this phase, a few key characteristics start to pop up:
- Shrinking Volatility: After the wild swings of the previous downtrend, the price action gets tight and compressed. The daily or hourly ranges narrow as buyers and sellers find a temporary balance point.
- A Solid Price Floor: Price will carve out a clear support level that gets tested over and over but just won't break. Each time price dips to this floor, it's met with a fresh wave of buying, quietly absorbing all the sell orders.
- Lack of Follow-Through: Any attempts to push the price lower get shut down almost immediately. You'll often see candles with long lower wicks at the bottom of the range, which is a dead giveaway that buyers are stepping in aggressively on any weakness.
Key Takeaway: Real accumulation isn't just a random pause. It's an active transfer of ownership from weak, emotional traders to strong, patient institutions. The quiet, grinding nature of this phase is completely intentional—it's designed to bore sellers into giving up and moving on.
Separating Accumulation from Mere Consolidation
Here's the thing: not all sideways markets are created equal. A simple consolidation might just be the market taking a quick breather before the next leg down. To know if you're looking at true accumulation, you need to hunt for specific clues that point to real institutional intent.
This process often mirrors classic market theories that have been around for decades. If you want to dive deeper into a foundational framework for this, check out the Wyckoff Accumulation Pattern. It provides a detailed, step-by-step schematic of how this phase plays out.
Understanding these patterns isn't just theory; it has serious real-world implications. Recent SEC enforcement actions have cracked down on schemes where manipulators accumulate low-liquidity assets, orchestrate pumps of over 300%, and then dump them on unsuspecting buyers. These cases highlight the massive financial incentives behind mastering the accumulation manipulation distribution framework.
Identifying The Institutional Footprint
Your ultimate goal here is to spot the "footprints" left behind by smart money. Since their orders are way too big to be filled all at once without spiking the price, they have to be clever, building their positions piece by piece over time. This methodical buying creates predictable price action patterns at key levels.
These key levels are basically hot spots where institutional orders are clustered. By learning to identify these areas, you can start to anticipate where the price is most likely to react. A fantastic way to start is by trading supply and demand zones, because this entire methodology is built around pinpointing the exact price levels where institutions are most active.
Keep an eye out for these specific signs to confirm you're in a genuine accumulation zone:
- Support Holds Firm: Price keeps revisiting a support level but can't seem to break through. The more times a level holds, the more significant it becomes.
- Higher Lows Form: Within the bigger sideways range, you might start to notice subtle higher lows taking shape. This is a quiet clue that buyers are getting a bit more aggressive.
- Volume Fades: In a classic accumulation phase, volume tends to dry up as the range develops. This lack of selling pressure is a clear signal that most of the sellers have finally been exhausted.
Once you see these elements falling into place, the stage is set for the next part of the cycle: manipulation. This is where institutions will often engineer one final, tricky move to shake out any remaining weak hands before they finally launch the new uptrend.
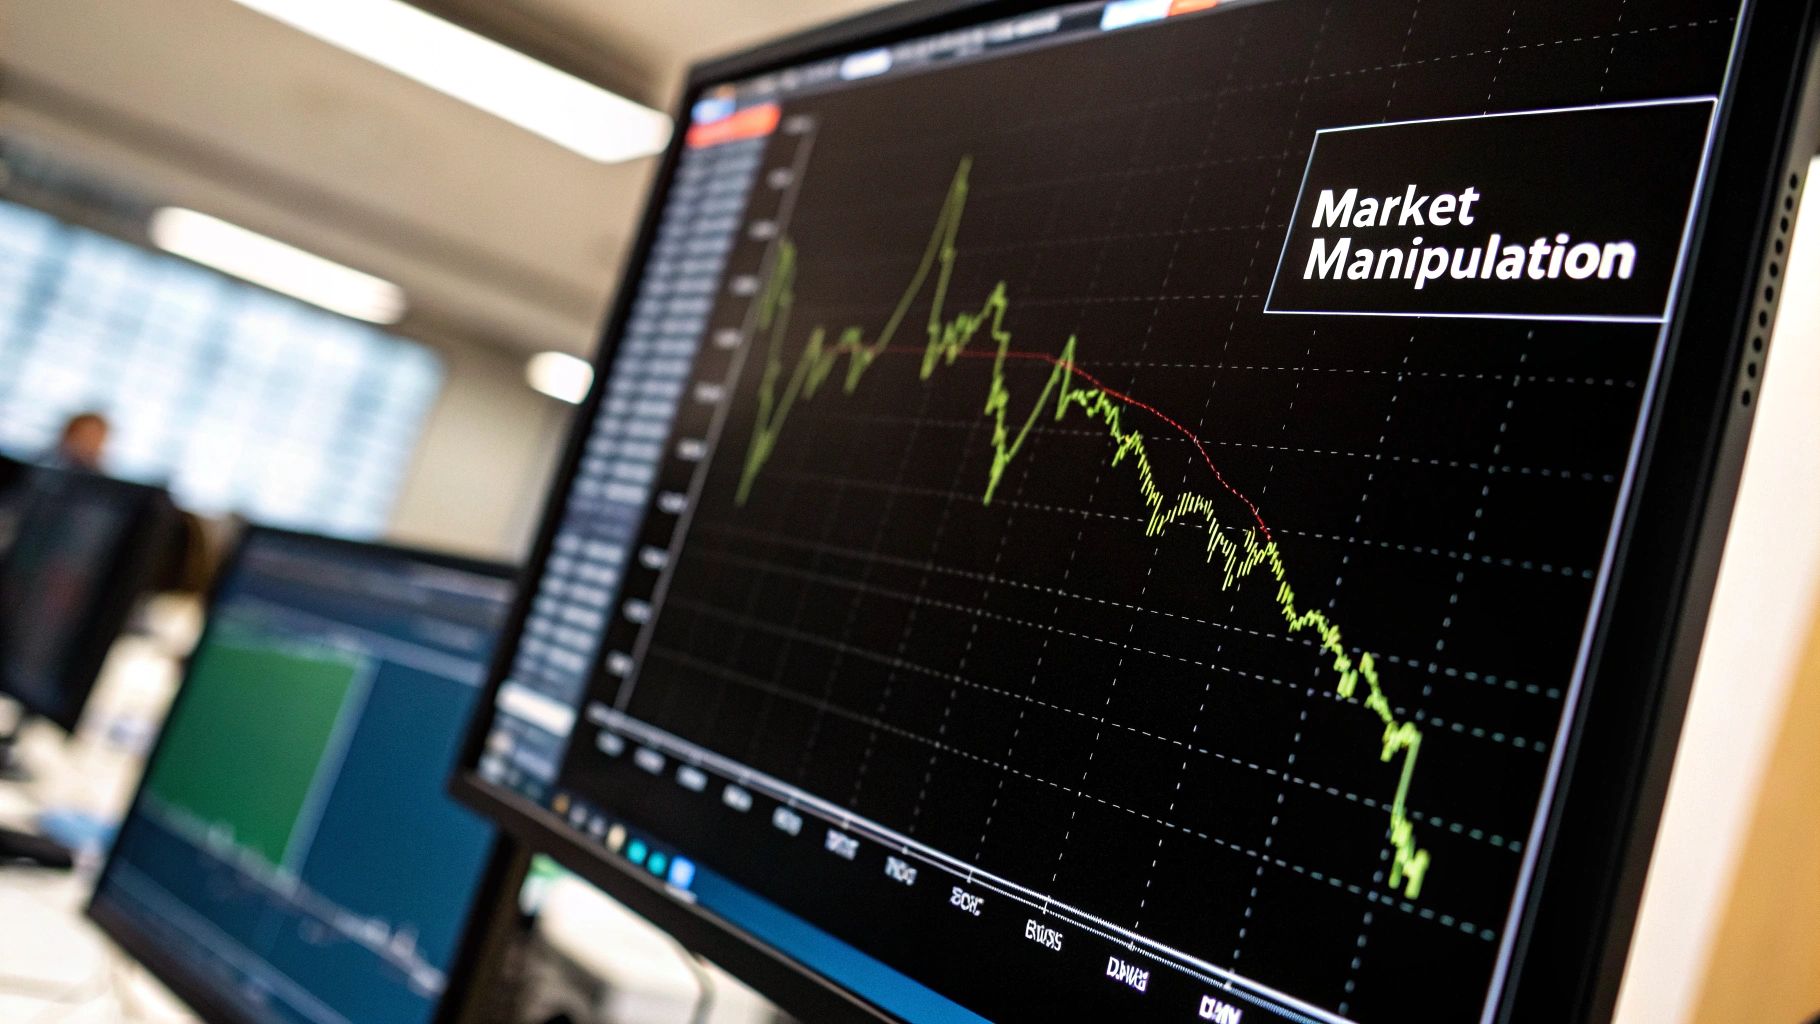
Exposing Common Market Manipulation Tactics
If accumulation is the quiet gathering of storm clouds, manipulation is the violent, chaotic lightning strike that comes right before the downpour. This is where the big institutions—the "smart money"—purposefully engineer price action to trap retail traders and build their positions. It's not a grand conspiracy; it's simply the mechanics of how massive orders get filled.
By creating these traps, they can snap up stop losses from panicked sellers and bait eager breakout buyers at the worst possible time. It's how they finish their accumulation at the best prices before the real move kicks off. The entire accumulation manipulation distribution cycle pivots on this deceptive, yet critical, phase.
The Classic Stop Hunt
One of the oldest tricks in the book is the stop hunt, sometimes called a "stop run" or "liquidity grab." The move itself is brutally simple: institutions shove the price just below a very obvious, clean support level.
Why there? Because they know that's exactly where countless retail traders have placed their protective stop-loss orders.
Driving the price down into this pool of stops triggers a waterfall of automated sell orders. This manufactured selling pressure creates a huge wave of liquidity, which the institutions are more than happy to absorb to fill the rest of their buy orders.
Once those stops are cleared out and the institutional orders are filled, there’s no reason for the price to hang around down there. What you often see next is a sharp, V-shaped recovery that leaves all the trapped sellers behind, scratching their heads as the market screams higher without them.
Pro Tip: Stop hunts are most powerful below clean, obvious support levels that everyone can see on their charts. The more obvious the level, the more liquidity is resting just beneath it, making it a perfect target.
Engineering False Breakouts
The evil twin of the stop hunt is the false breakout. This trap is designed to snare buyers instead of sellers. After a period of quiet accumulation, institutions might orchestrate a powerful-looking breakout above a key resistance level.
This move lights a fire under retail traders, triggering a massive case of FOMO (Fear Of Missing Out). They pile in, buying the breakout, convinced a new uptrend is underway. In reality, they're buying directly into the institutional sell orders. The smart money uses this manufactured buying frenzy to start their distribution or simply to grab sell-side liquidity before knocking the price lower.
Recognizing these traps is a game-changer. For a look at the most extreme versions of this behavior, check out our guide on pump-and-dump schemes, where manipulators take this concept to a whole new level.
Spotting The Signs of Manipulation
While these moves are designed to deceive, they leave behind footprints in the price action for the disciplined trader to find. Instead of falling for the trap, you can learn to spot the warning signs and use them to your advantage.
- Long, Obvious Wicks: A candle with a long lower wick stabbing through support is a classic calling card of a stop hunt. It shows that price was aggressively shoved back up from the lows.
- V-Shaped Recoveries: Manipulative moves are almost always fast and violent. A sharp V-shaped price recovery back into the previous range tells you the move wasn't a genuine trend but a quick liquidity grab.
- Price-Volume Divergence: A breakout happening on weak or falling volume is a massive red flag. It signals a lack of real institutional firepower behind the move, dramatically increasing the odds that it's a trap.
By staying patient and waiting for these confirmation signals, you can avoid becoming the liquidity for someone else's trade. Instead, you can learn to trade in harmony with the smart money's true intentions.
Pinpointing Distribution for Smarter Exits
After the market rallies hard from the accumulation and manipulation phases, the final act begins. This is the distribution phase. It's where the big players who quietly bought at the bottom start to systematically sell off their massive positions to an ecstatic and unaware public, right at the peak.
To the untrained eye, the market looks bulletproof. But behind the curtain, a huge transfer of risk is taking place from the smart money to the retail crowd.
Think of distribution as accumulation's evil twin. It usually shows up as a choppy, sideways market right at the top of a strong uptrend. While everyone else sees the small dips as just another chance to buy in, the big institutions are using that flood of buy orders to sell into, piece by piece.
Spotting this phase is critical for two massive reasons. First, it's your signal to lock in profits on your long trades before the inevitable reversal snatches them back. Second, it can set up some fantastic, high-probability short trades to profit from the coming drop.
Reading The Warning Signs of Distribution
Just like accumulation, distribution leaves behind its own set of distinct footprints in the price action. The trick is to switch your mindset from bullish excitement to cold, objective analysis. You need to start looking for signs of exhaustion and weakness.
The most obvious sign is when the market repeatedly fails to make new highs. Price will push up toward a resistance level, looking strong, only to get knocked back down again. After this happens a few times, you can start to see a clear price ceiling that the market just can't seem to break through.
This is often paired with wild bursts of volatility that don't actually go anywhere. You might see big, dramatic swings up and down, but the price makes no real upward progress. This churning action is a classic tell that large institutions are offloading their shares onto eager retail buyers.
Key Takeaway: A healthy uptrend makes clean higher highs and higher lows. During distribution, that smooth structure falls apart and turns into a sloppy, sideways grind. The whole character of the market shifts from effortlessly bullish to labored and weak.
Clues That Sellers Are Taking Control
To really confirm that a market is in distribution, you need to look for a combination of specific price action signals. No single clue is a guarantee, but when you see several of them popping up together at a market top, the evidence starts to get very compelling.
- Bearish Candlestick Patterns: Start looking for patterns like shooting stars, evening stars, or large bearish engulfing candles right at those key resistance levels. These are direct messages that sellers are overpowering buyers at critical price points.
- Price-Volume Divergence: This one is powerful. You might see the price inch out a slightly higher high, but the volume on that move is noticeably weaker than on the previous upswings. This tells you the buying pressure is running out of steam and lacks institutional backing.
- Lower Highs Forming: The first lower high after a long, strong uptrend is a major red flag. It's the first clear crack in the bullish market structure and your signal that sellers are starting to win the fight.
Once these elements start to align, the accumulation manipulation distribution cycle is almost complete. The institutions have sold their positions, and the market is now heavy and vulnerable. All it takes is for the last of the retail buyers to run out of money, and a sharp decline is likely.
For the disciplined price action trader, this is the moment. It's time to either protect your profits or get ready to enter a new trade on the short side.
Executing Trades With The AMD Framework
Knowing the theory behind accumulation, manipulation, and distribution is one thing, but putting it to work in a live market is where the real skill lies. Now, let's bridge that gap. We’ll walk through how to turn these powerful price action concepts into clear, repeatable trade setups.
We're going to focus on two of my favorite high-probability scenarios: trading the reversal after a manipulative stop hunt, and entering on a retest after a clean breakout. Both are built on a solid foundation of risk management—meaning every trade has a logical entry, a tight stop-loss, and a clear target.

Trading The Stop Hunt Reversal
The stop hunt is one of the most classic forms of market manipulation you'll see, and for the patient trader, it presents a fantastic opportunity. The key isn't to predict the stop hunt, but to react decisively once the trap has been sprung.
Here’s the step-by-step game plan for this setup:
- Identify a Clear Liquidity Zone: First things first, you need to spot an obvious support level where you know retail stop-loss orders are clustered. Think of a clean horizontal low or the bottom of a well-defined range—places everyone is watching.
- Wait for The Manipulation: This is where patience pays off. You're waiting for price to make an aggressive dive below that support level, triggering all those stops. The move should feel sharp and violent.
- Look for a Strong Rejection: This is your trigger. Price can't just stop falling; it needs to aggressively reclaim the broken support level. A long lower wick or a powerful bullish engulfing candle are classic fingerprints of a strong rejection, signaling the raid is over.
- Execute the Trade: Go long as soon as the price has firmly planted itself back above the old support. This confirmation is everything. It's what separates a true manipulative grab from a genuine breakdown.
Execution Tip: Whatever you do, don't try to "catch a falling knife" by buying while the price is still plunging. Let the market show its hand. Wait for that decisive V-shaped recovery. Your job is to hop on board after smart money has revealed their true intentions.
Risk management here is refreshingly simple. Place your stop-loss just beneath the low of that manipulative wick. For a profit target, aim for the top of the previous accumulation range. This often sets you up for a great risk-to-reward ratio, usually 2:1 or even better.
Entering On A Retest Of The Breakout
Here's another powerful setup that filters out a lot of noise. Instead of chasing the initial breakout from an accumulation range (a common trap), we wait for a pullback to confirm that the move is real.
This patient approach helps you sidestep many false breakouts and gives you a much more controlled entry with a tighter stop-loss.
Step-By-Step Breakout and Retest Entry
Follow these steps to safely play a confirmed breakout:
- Confirm a Valid Breakout: After you've identified a clear accumulation phase, wait for the price to break above the range's resistance. A real breakout should happen on strong, convincing bullish candles, and ideally, with a noticeable increase in volume.
- Wait for The Retest: This is the discipline part. Instead of getting FOMO and buying the initial surge, you sit on your hands and wait for the price to pull back and retest the old resistance level. This level should now act as new support.
- Identify The Entry Signal: Now you watch for a bullish price action signal right on this new support shelf. This could be a bullish pin bar, an engulfing pattern, or simply seeing the price hold firm and begin to turn higher.
- Place Your Entry and Stops: Once you have that confirmation signal, it's time to enter a long position. Your stop-loss goes just below the new support level (the old resistance). If the price falls back into the old range, your trade idea is simply invalidated.
By waiting, you ensure you’re buying at a logical point of value, not chasing momentum at a premium price. The market has literally proven to you that it's willing to hold the new level, giving you a much higher-probability trade.
History is filled with examples of these cycles playing out on a massive scale. The 2025 stock market crash showed global distribution manipulation, where pump-and-dump schemes ran wild in the chaos. Manipulators would accumulate small-cap stocks, use social media to hype them up and inflate prices by 200-500%, and then dump them on unsuspecting retail traders. For price action traders like us at Colibri Trader, this institutional distribution created massive wicks and fakeouts—perfect opportunities for fading the extremes. You can read more about how analyst coverage provided a shield for some stocks during this period in this in-depth market crash overview.
By mastering these two setups, you’re no longer just guessing at market direction. You're arming yourself with a robust plan to trade based on the predictable footprints left behind by the institutional players after the accumulation manipulation distribution cycle has given you a clear signal.
Building Your Personal AMD Trading Plan
A powerful concept like accumulation manipulation distribution is just an interesting idea until you build a structured, repeatable plan around it. Without that system, you're just reacting to market noise. That’s a fast track to emotional decisions and the kind of inconsistent results that blow up accounts.
A trading plan is what turns theory into a professional, systematic process.
The goal here is to stop guessing and start operating with a clear roadmap for every single trade. It all comes down to approaching the charts with a simple but non-negotiable set of questions before you ever risk a single dollar.
Your Pre-Trade Checklist
Before you even think about entering a trade, you have to be able to give a confident "yes" to these questions. If the answer is "no" or even "maybe," you simply don't have a valid setup. It's time to step away and wait for a better opportunity.
-
Can I Clearly Identify the Current Market Phase? You need to know, without a doubt, whether the market is in a clear accumulation or distribution range. If the context is messy or looks ambiguous, there is no trade. Period.
-
Are There Specific Signs of Institutional Activity? Look for their footprints on the chart. Have you spotted a solid price floor being defended during accumulation? Or are you seeing repeated, aggressive failures at a resistance level during distribution?
-
Has a Clear Manipulative Move Occurred? The highest-probability entries almost always follow a liquidity grab. Pinpoint that stop hunt or false breakout that signals the trap has been set and already sprung on weaker hands.
-
Where Are My Exact Entry, Stop, and Target Levels? Define every aspect of your trade with precision. Your entry must be triggered by a clear price action signal, your stop loss needs to be at a logical point that invalidates your idea, and your target must offer a favorable risk-to-reward ratio.
This checklist forces you to trade with intention. Think of it as the ultimate filter, the one that separates high-probability setups rooted in the AMD framework from random, impulsive trades. By making this process second nature, you stop chasing price and start reading the real story the institutions are telling you.
Common Questions About The AMD Cycle
Even with a clear framework, I know traders often bump into the same questions when trying to put the accumulation manipulation distribution cycle into practice. Getting these common points of confusion cleared up can really help solidify your understanding and build confidence in your analysis.
Let's walk through the most frequent questions that come up when traders first start applying these concepts to their charts.
Does The AMD Cycle Apply to All Markets and Timeframes?
Yes, absolutely. The principles of AMD are fractal, meaning they apply universally across all markets—from forex and stocks to crypto—and across all timeframes. Institutional order flow operates on the same logic whether you're looking at a 5-minute chart or a daily chart.
The patterns will naturally appear smaller and faster on lower timeframes, but the underlying narrative of building a position, engineering liquidity, and then offloading that position remains constant.
How Do I Differentiate Manipulation from a Real Reversal?
The key difference really comes down to the speed and character of the price action. A manipulation, like a stop hunt, is typically a sharp, aggressive move with a rapid V-shaped recovery back into the prior range. Its purpose is to grab liquidity, not to kick off a new trend.
A true trend reversal, on the other hand, usually builds more slowly. It establishes a new market structure (like lower highs and lower lows for a downtrend) and respects new levels on subsequent retests. The goal is always to wait for confirmation rather than trying to perfectly nail the top or bottom.
A manipulation is a violent raid. A real reversal is a deliberate change in direction.
Are Volume Indicators Necessary to Spot These Phases?
While volume analysis can sometimes provide helpful confirmation, it's not essential. In fact, it can even be misleading, especially in decentralized markets like forex where the volume data is fragmented and incomplete. A pure price action approach is often much cleaner and more direct.
The entire story of accumulation, manipulation, and distribution is visible right on your chart. You can see it in the candlestick patterns, the wick formations, and the market structure alone. By learning to read price directly, you avoid the lag and noise that often come with most indicators.
Ready to stop being the liquidity and start trading alongside the smart money? At Colibri Trader, we provide a no-nonsense, price-action-based approach to transform your trading. Explore our proven programs and start your journey today!