Master ABCD Pattern Trading for Profitable Results
The Psychology Behind Successful ABCD Pattern Trading
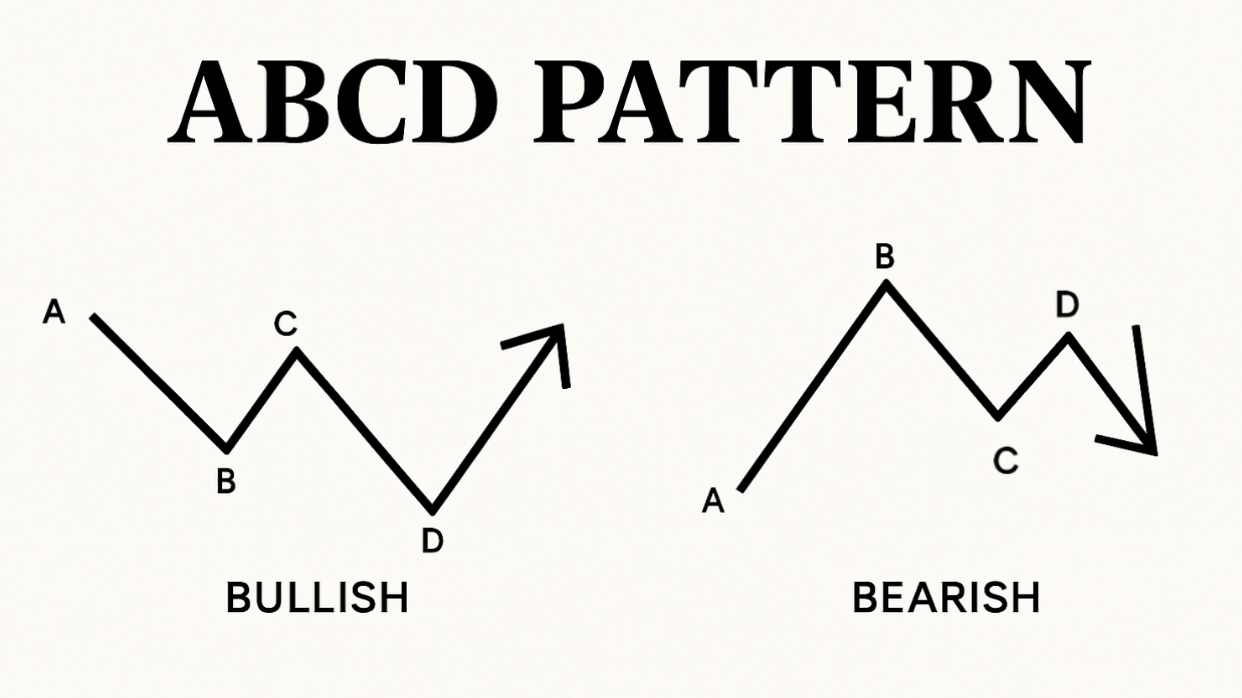
The ABCD pattern isn’t just about lines on a chart. It reflects how people behave in markets. By connecting four price points (A, B, C, and D), this pattern shows the fluctuations of market sentiment. It reveals how fear and greed drive price action. Understanding this psychology is key for traders who want to use the ABCD pattern profitably.
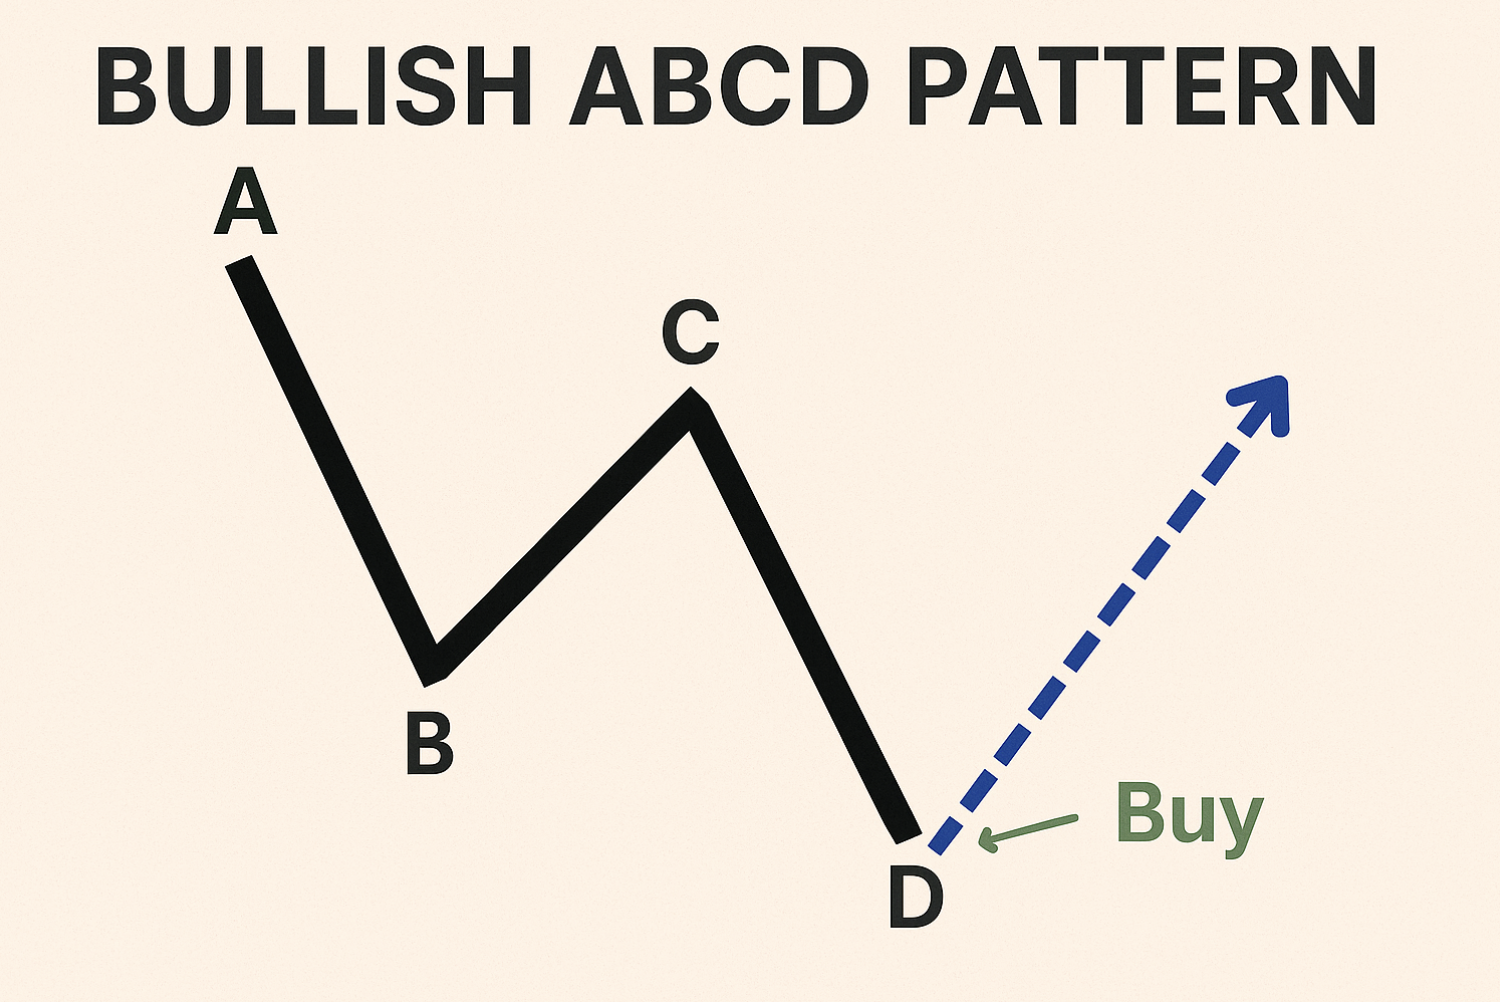
Consider a bullish ABCD pattern as an example. The initial leg (AB) is a decline driven by fear and selling. The next wave (BC) is a correction as buyers see an opportunity. This bounce often lacks conviction, which leads to the next leg down (CD). This final decline is where late sellers capitulate. This creates a potential buying opportunity for traders anticipating a reversal.
Fear, Greed, and the Formation of ABCD Patterns
The ABCD pattern’s power lies in its ability to capture shifting market psychology. Fear and greed are not random; they manifest in patterns. The ABCD pattern offers a framework for understanding and anticipating these swings, giving traders opportunities to capitalize on emotional extremes.
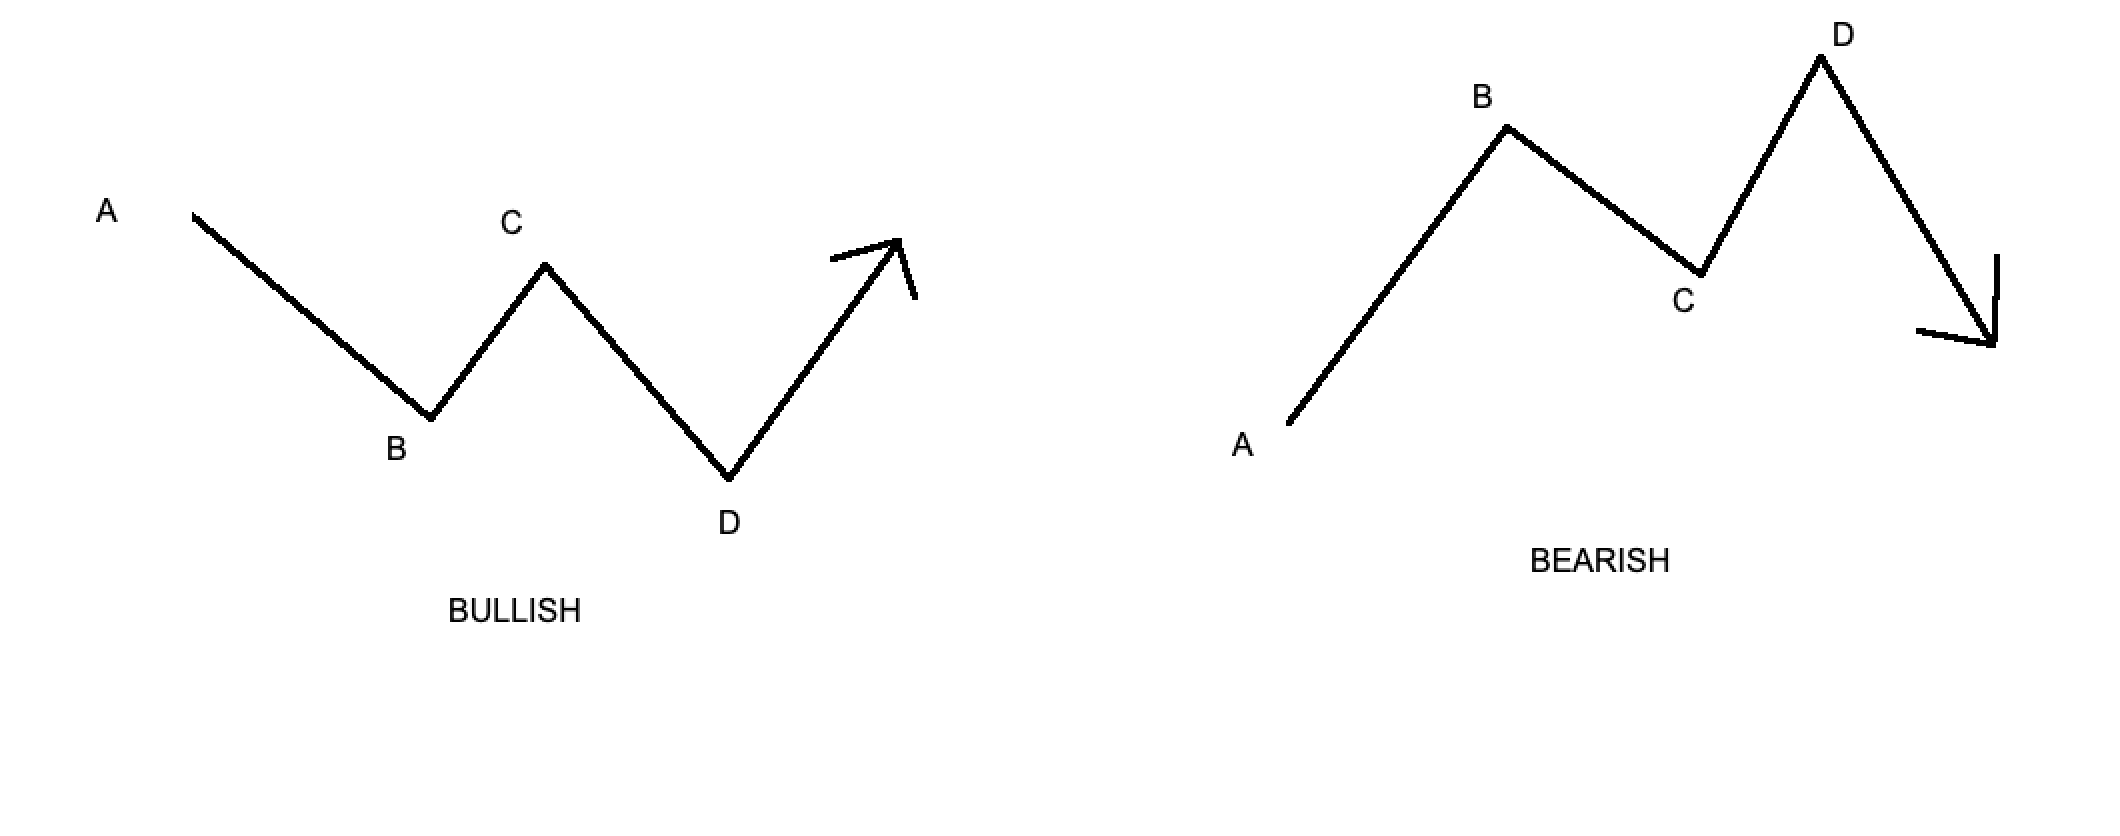
- Point A (Initial Extreme): This is the peak of fear in a downtrend or peak greed in an uptrend.
- Point B (Initial Retracement): Sentiment tentatively shifts. Some traders question the current trend.
- Point C (Secondary Retracement): The initial sentiment temporarily returns, trapping traders who entered early at point B.
- Point D (Second Extreme): This marks maximum emotional exhaustion, creating a high-probability reversal zone.
The ABCD pattern is popular due to its ability to predict trend reversals and provide entry points. Aligning price and time with Fibonacci ratios is key to identifying the pattern. In a bullish ABCD, leg AB often matches CD in length or time. The BC segment is typically 61.8% to 78.6% of AB. CD extensions can reach 127.2% or 161.8% of BC, creating a precise entry scenario. This pattern appears across various assets and timeframes, making it a versatile tool in Forex and equity markets. Many traders utilize TradingSim and historical data to refine their ABCD strategies, showcasing its relevance in modern trading.
The Edge of Understanding Market Psychology
Understanding the psychology behind the ABCD pattern gives traders a significant advantage. While knowing the pattern’s shape can lead to some wins, mastering it requires understanding why it works. This allows for more confident trades and adaptation to varying market conditions. Combining the ABCD pattern with other technical analysis tools and market context can greatly increase a trader’s probability of success.
Spotting High-Probability ABCD Patterns That Others Miss
Identifying textbook ABCD patterns is one thing; finding those with real profit potential is quite another. Experienced traders know that not all ABCD patterns offer the same opportunities. They possess the skill to distinguish between high-probability setups and false signals, which can often trap less experienced traders. This discernment involves a keen understanding of the subtle nuances within pattern formation, combined with a solid grasp of the current market context.
Validating ABCD Patterns for Increased Accuracy
A critical aspect of ABCD pattern trading is validation. Simply identifying the pattern is not enough. Traders need to confirm its validity using other tools and techniques. Doing so can significantly increase the chances of a successful trade.
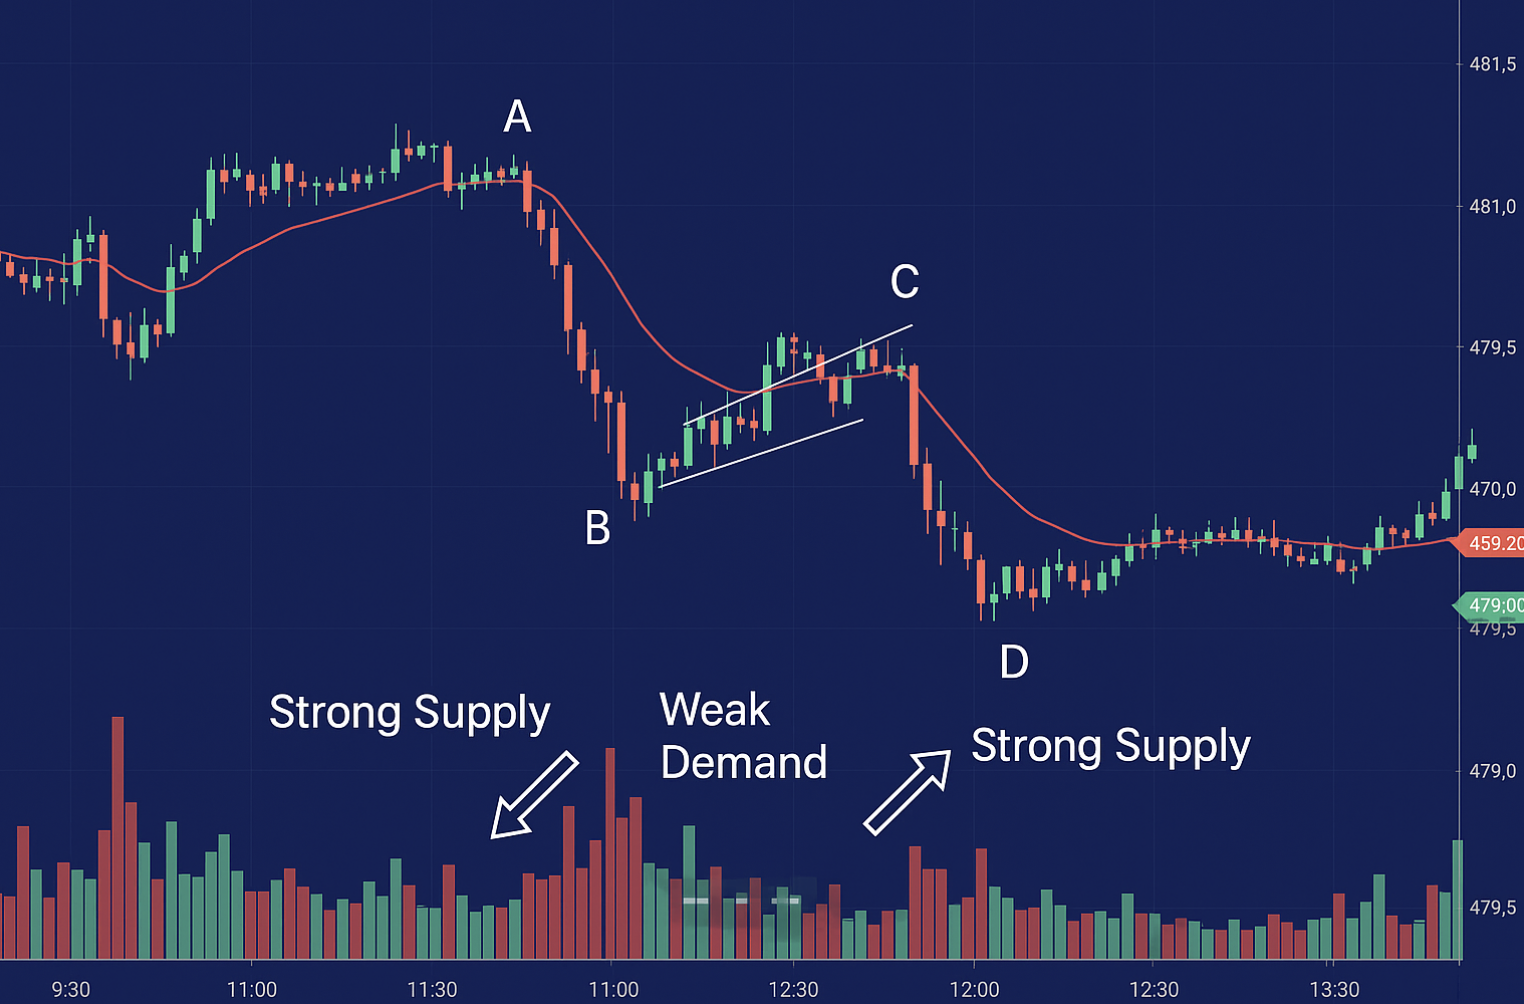
- Volume Analysis: Observe volume during the CD leg. Increasing volume confirms strong momentum in the anticipated breakout direction. Conversely, decreasing volume during the BC retracement further strengthens the pattern’s potential.
- Market Context: Consider the broader market trend. An ABCD pattern forming within a larger uptrend is more likely to result in continued upward movement. Conversely, a pattern within a downtrend may suggest a potential reversal.
- Supporting Indicators: Use indicators like the Relative Strength Index (RSI) or Moving Averages. These tools can help confirm overbought or oversold conditions and overall trend direction, adding another layer of confidence to the pattern.
These validation techniques help traders filter out less promising patterns and focus on those with a higher probability of success.
To better understand the key elements of bullish and bearish ABCD patterns, let’s examine the following comparison table:
Bullish vs. Bearish ABCD Pattern Characteristics
| Pattern Type | Formation Criteria | Fibonacci Relationships | Volume Characteristics | Confirmation Signals |
|---|---|---|---|---|
| Bullish | Forms in a downtrend, followed by an upward AB leg, a downward BC retracement, and a final upward CD leg | AB to BC retracement ideally 61.8%, BC to CD extension ideally 127.2% | Increasing volume on CD leg, decreasing volume on BC leg | Break above a resistance level, bullish candlestick patterns at point D |
| Bearish | Forms in an uptrend, followed by a downward AB leg, an upward BC retracement, and a final downward CD leg | AB to BC retracement ideally 61.8%, BC to CD extension ideally 127.2% | Increasing volume on CD leg, decreasing volume on BC leg | Break below a support level, bearish candlestick patterns at point D |
This table highlights the core differences between bullish and bearish ABCD patterns, focusing on formation, Fibonacci relationships, volume, and confirmation signals. Understanding these distinctions is key for accurately identifying and trading these patterns.
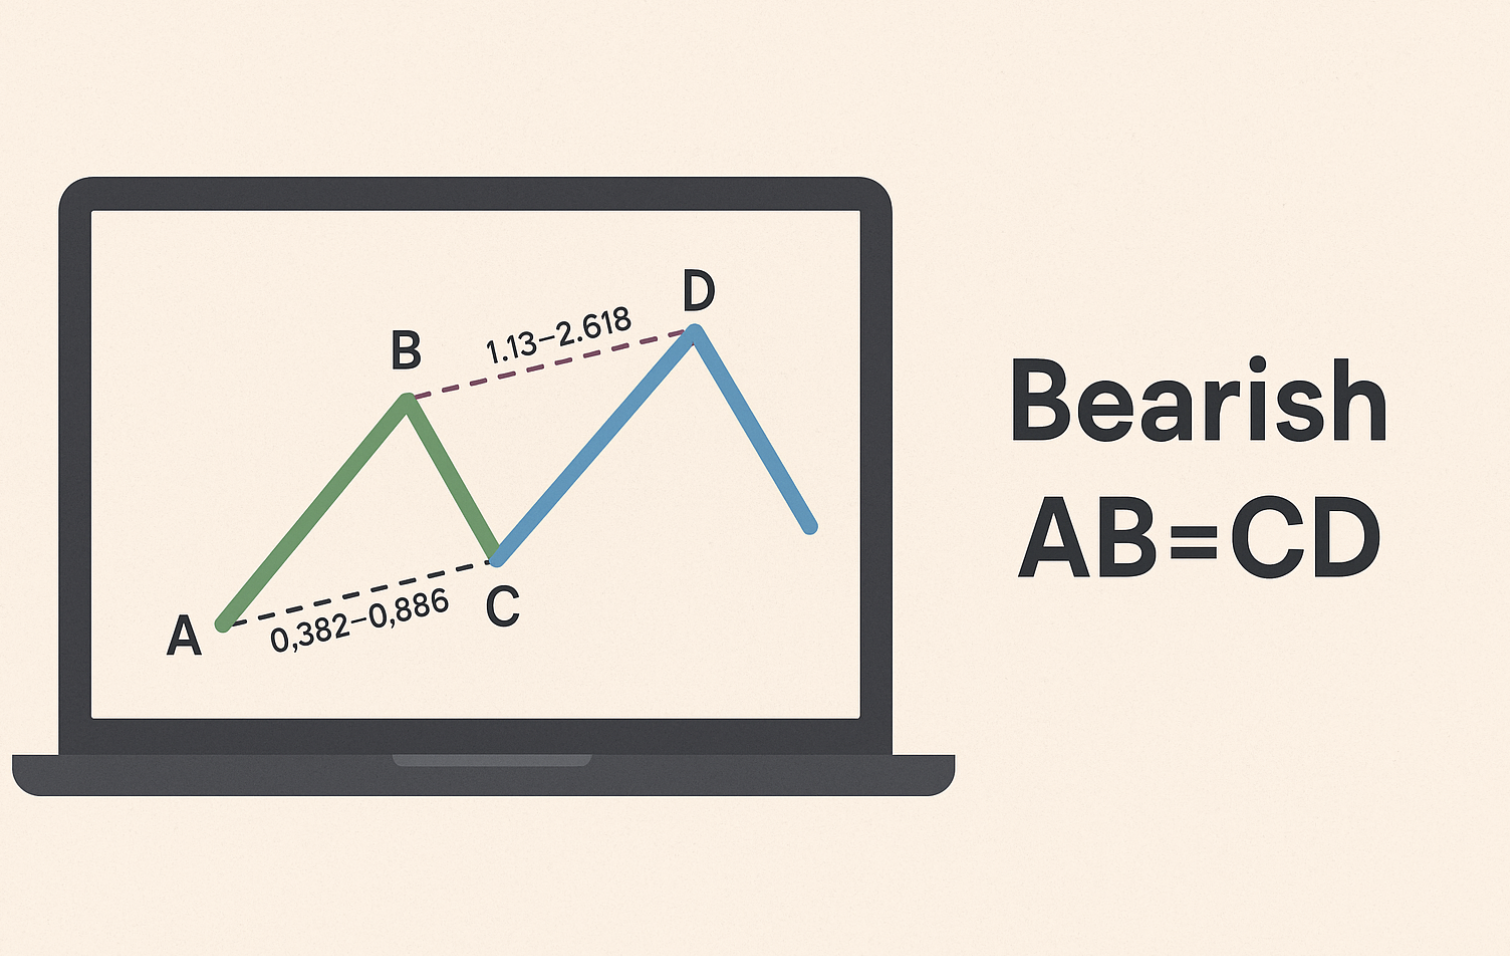
The following infographic further illustrates the importance of Fibonacci retracement ratios in ABCD pattern trading.
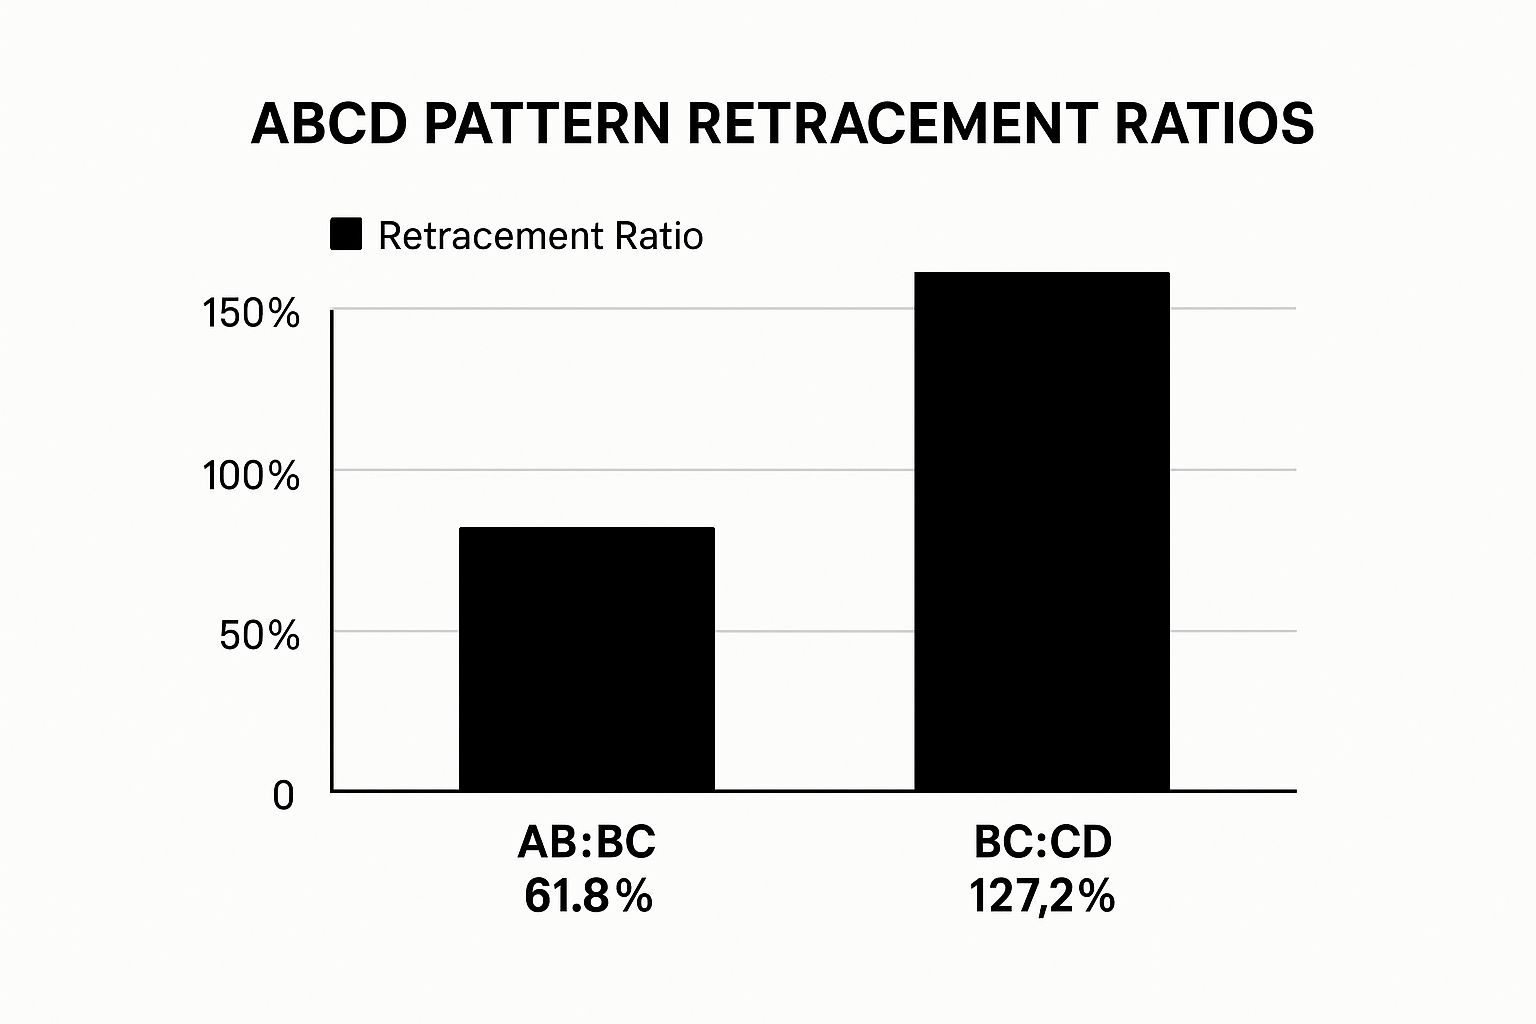
Recognizing these retracement relationships is essential for accurate pattern identification and setting appropriate profit targets and stop-loss levels. While deviations from these ideal ratios can still present valid trading opportunities, especially in volatile markets, they require additional caution and confirmation.
Timing Your Entry for Optimal Results
Even with a perfectly formed and validated pattern, incorrect entry timing can lead to losses. Understanding the nuances of timing is crucial for maximizing profitability in ABCD pattern trading.
- Entry at Point D: The most common entry point is at point D, anticipating the reversal. Waiting for confirmation, such as a candlestick reversal pattern or a break above or below a trendline, can significantly improve the trade’s risk-reward ratio.
- Early Entry (Aggressive): Some traders opt for an early entry, slightly before point D, aiming to capture a larger portion of the potential price move. This aggressive approach carries increased risk but also the potential for greater rewards. Strict stop-loss placement is essential with this strategy.
- Late Entry (Conservative): A more conservative approach involves entering after the price breaks out of the pattern at point D, confirming the reversal. This reduces risk but might mean sacrificing some of the initial price movement.
By mastering these validation and timing techniques, traders can significantly improve their ability to identify and capitalize on high-probability ABCD patterns. This mastery requires practice, patience, and a comprehensive understanding of market dynamics.
Fibonacci Mastery: The Mathematical Edge in ABCD Trading

The ABCD pattern is readily identifiable on a chart. But its real strength comes from combining it with Fibonacci ratios. These ratios, derived from the Fibonacci sequence, offer a mathematical basis for understanding and confirming ABCD patterns. This helps traders identify precise entry and exit points.
It also allows for better profit targets and risk management, filtering less reliable patterns and focusing on high-probability setups.
Key Fibonacci Ratios in ABCD Pattern Trading
Certain Fibonacci ratios are essential in ABCD pattern trading. These ratios help pinpoint potential turning points within the pattern. They also provide targets for taking profit and placing stop-loss orders.
For example, the BC leg usually retraces between 61.8% and 78.6% of the AB leg. Ideally, the CD leg extends to 127.2% or 161.8% of the BC leg. These relationships aren’t random. They reflect underlying market dynamics and recurring patterns in how traders behave.
Validating ABCD Patterns with Fibonacci Analysis
Fibonacci ratios help confirm a suspected ABCD pattern. If the BC retracement falls outside the typical 61.8% – 78.6% range, it might indicate a weaker setup. The same is true if the CD leg doesn’t hit the expected 127.2% – 161.8% extension.
This doesn’t automatically invalidate the pattern. However, it does warrant additional caution and confirmation from other indicators. Combining Fibonacci analysis with other technical tools, such as TradingView, strengthens the validation process, increasing confidence in potential trades.
Practical Application of Fibonacci Ratios in ABCD Trading
Fibonacci ratios aren’t just theoretical. They translate into practical trading strategies. They help establish precise profit targets by projecting potential price moves based on the pattern’s legs. They also inform stop-loss placement, limiting losses if the pattern doesn’t play out as expected.
For example, a stop-loss could be placed slightly below point A in a bullish pattern, or slightly above point A in a bearish pattern. Mastering these ratios is essential for maximizing profits and managing risk. This often involves practice and applying the concepts in live or simulated trading.
ABCD Pattern Trading Tactics That Actually Work
Understanding the ABCD pattern’s underlying psychology and Fibonacci ratios is essential. However, practical application distinguishes consistent profits from sporadic wins. This section explores specific trading approaches that yield results with ABCD patterns. We’ll discuss optimal entry timing, adapting tactics to various market conditions, and practical strategies for improving win rates.
Timing Your Entry: The Key to Profitability
Timing your entry within the ABCD pattern significantly impacts potential profits. Entering at the optimal moment maximizes profit potential while minimizing risk.
- The D-Point Entry: The most common approach is entering at point D, anticipating the reversal. Waiting for confirmation, such as a candlestick reversal pattern or a break of a trendline, improves the risk-reward ratio. This confirms the reversal before committing capital.
- Early Entry (Aggressive): Entering slightly before point D aims to capture a larger portion of the potential price move. This carries higher risk but offers potentially greater reward. A strict stop-loss is essential with this strategy.
- Late Entry (Conservative): This involves entering after the price breaks out from point D, confirming the reversal. This reduces risk but may sacrifice some initial price movement. It prioritizes confirmation over potential early gains.
To further illustrate the components of the ABCD pattern trading strategy, let’s examine the following table:
ABCD Pattern Trading Strategy Components
| Strategy Component | Description | Implementation Tips | Common Mistakes | Success Factors |
|---|---|---|---|---|
| D-Point Entry | Entering a trade at point D of the ABCD pattern | Wait for confirmation (candlestick reversal, trendline break) before entering. | Entering too early before confirmation. | Patience, discipline in waiting for confirmation signals. |
| Early Entry | Entering slightly before point D | Use a strict stop-loss order to manage risk. | Not using a stop-loss, leading to larger potential losses. | Quick reactions, ability to tolerate higher risk. |
| Late Entry | Entering after price breaks out from point D | Focus on confirming the reversal. | Missing a significant portion of the price move. | Prioritizing confirmation, accepting smaller but more reliable gains. |
| Trend Analysis | Determining the overall market trend | Align ABCD pattern trading with the prevailing trend. | Trading against the trend, reducing probability of success. | Understanding broader market context, identifying strong trends. |
| Support & Resistance | Identifying key support and resistance levels | Look for ABCD patterns completing near these levels for added significance. | Ignoring these levels, leading to poor trade entries. | Combining pattern recognition with support and resistance analysis. |
| Indicator Confirmation | Using supporting indicators | Confirm overbought/oversold conditions and trend direction with indicators like RSI or moving averages. | Relying solely on indicators without considering the ABCD pattern itself. | Integrating multiple analysis techniques for a more holistic view. |
This table summarizes the different entry strategies and key elements for successful ABCD pattern trading, highlighting potential pitfalls and important factors for success.
Adapting to Market Conditions
Successful ABCD pattern traders adjust their tactics to different market environments. No single approach works universally.
- Trending Markets: In strong trends, the CD leg might extend beyond the typical Fibonacci extensions (127.2% or 161.8% of BC). Traders might trail their stop-loss or use partial profit-taking to lock in gains as the trend continues.
- Ranging Markets: During consolidation, ABCD patterns can signal short-term reversals within the range. Traders should focus on tighter profit targets and be prepared for quicker reversals. Combining the pattern with support and resistance levels is crucial.
- Volatile Markets: In volatile markets, price swings can be erratic, making precise Fibonacci measurements challenging. Confirming the pattern with other indicators and using wider stop-losses can be prudent. This acknowledges the increased risk associated with volatility.
Combining ABCD with Broader Market Context
ABCD patterns are more effective when combined with broader market analysis.
- Trend Analysis: Determine the overall market trend. An ABCD pattern aligned with the prevailing trend has a higher probability of success.
- Support and Resistance Levels: Identify key support and resistance levels. An ABCD pattern completing near these levels adds significance.
- Other Indicators: Use supporting indicators like RSI or moving averages to confirm overbought or oversold conditions and trend direction. This provides further validation for the ABCD pattern.
Applying Execution Tactics Across Markets
Professional traders adapt their execution tactics based on the specific market they are trading.
- Forex: The 24/5 nature of the forex market creates numerous ABCD pattern opportunities. Traders often combine the pattern with candlestick analysis and focus on major currency pairs with higher liquidity.
- Equities: In equity markets, ABCD patterns can identify potential swing trading opportunities. Traders might combine the pattern with fundamental analysis and earnings reports to enhance their decision-making.
- Cryptocurrencies: The high volatility of cryptocurrency markets requires careful risk management when trading ABCD patterns. Using wider stop-losses and confirming the pattern with other indicators is crucial in this environment.
By mastering these tactics, traders can significantly improve their ABCD pattern trading success. Consistent profitability isn’t about avoiding losses entirely, but effectively managing risk while capitalizing on high-probability setups. This requires consistent practice, adaptation, and a comprehensive approach to market analysis.
Risk Management Secrets of Professional ABCD Traders
Consistent profitability with ABCD pattern trading isn’t just about finding the perfect entry point. It relies heavily on robust risk management. This means safeguarding your capital during unavoidable losses while maximizing gains on winning trades. Think of professional gamblers: they understand the house advantage and meticulously manage their bankroll to stay in the game. Professional traders use a similar approach with ABCD patterns.
Protective Stops Based on Pattern Structure
Instead of using arbitrary stop-loss percentages, professionals base their stops on the ABCD pattern’s structure itself. This provides a more logical and effective risk management strategy.
- Stop-Loss Placement: In a bullish ABCD pattern, a stop-loss is typically placed just below point A, a key support level. A break below this level signals pattern failure, prompting an exit. Conversely, in a bearish ABCD, the stop goes just above point A.
- Dynamic Stops: As the trade progresses favorably, the stop-loss can be adjusted to lock in profits. This trailing stop lets traders capture more of the potential price move while mitigating the risk of reversals.
This method provides a flexible approach, adapting to each ABCD pattern setup.
Dynamic Position Sizing for Each Setup
Position sizing is another critical risk management element. Professional traders avoid allocating the same capital to every trade. Instead, they adjust position size based on the perceived risk of each ABCD pattern. For more on risk management and pattern analysis, check out Colibri Trader’s further insights.
- Volatility Considerations: Smaller positions are used in volatile markets to limit potential losses.
- Confidence Levels: Higher confidence in a setup, perhaps due to confirming signals, may justify a larger capital allocation. However, even with high confidence, position sizes must stay within acceptable risk parameters.
This adaptable position sizing optimizes risk-reward profiles and protects capital in diverse market conditions.
Asymmetric Risk-Reward and Emotional Discipline
Professional ABCD traders often target asymmetric risk-reward ratios, aiming for trades where potential profits significantly outweigh potential losses. A 1:3 risk-reward ratio, for example, means $3 potential profit for every $1 risked.
- Scaling In and Out: Traders may scale in and out of positions, gradually increasing or decreasing size as the trade unfolds, to refine risk and boost profits.
- Emotional Control: Perhaps the toughest part of risk management is maintaining emotional discipline. Sticking to the trading plan and avoiding impulsive decisions based on fear or greed is essential. While emotions can surge when trades move against you, adhering to predetermined risk management rules is crucial for long-term trading success.
By implementing these strategies and staying emotionally disciplined, traders can greatly improve consistency and long-term profitability with ABCD pattern trading. This blend of technical analysis and risk management creates a strong foundation for trading success.
Real Results: ABCD Pattern Performance Across Markets
The ABCD pattern is alluring to traders due to its apparent simplicity. However, practical trading requires a deeper understanding than simply recognizing the pattern’s shape. This section explores the actual performance of ABCD pattern trading strategies in diverse market conditions, highlighting its strengths and weaknesses.
Market Environments and ABCD Pattern Success
The ABCD pattern’s efficacy varies considerably based on the market environment. In trending markets, it can provide clear entry and exit points, aligning with the prevailing price direction. This enables traders to capitalize on momentum and potentially achieve significant gains.
Conversely, in ranging markets, the pattern’s signals can become less dependable. Frequent price swings and false breakouts often lead to inaccurate predictions.
Furthermore, the pattern’s win rate is affected by specific markets and timeframes. Some traders find success using ABCD patterns on shorter timeframes, while others prefer longer ones for clearer pattern identification. This adaptability makes the pattern useful for both day traders and swing traders. A complete understanding requires analyzing the pattern’s performance in various markets like forex, equities, and cryptocurrencies. Read also: Explore ABCD pattern trading strategies further.
Adapting to Market Volatility and Trend Conditions
Successful traders understand that market dynamics are constantly shifting, necessitating adjustments to their ABCD pattern trading strategies. During periods of high market volatility, caution is crucial. Wider stop-loss orders can help manage risk.
Combining the ABCD pattern with other technical indicators provides additional confirmation. For example, incorporating volume analysis, RSI, or moving averages can help filter out false signals, enhancing trade accuracy.
During periods of lower volatility, more precise entries and tighter stop-losses can be employed. Traders should adjust their profit expectations in trending versus ranging markets. Trend following often presents greater profit potential. Range-bound trading typically requires more conservative profit targets. Adaptability is essential for successful ABCD pattern traders.
Real Trading Results and Case Studies
Reviewing real trading results provides a practical perspective on the ABCD pattern’s effectiveness. Theoretical discussions are valuable, but observing the pattern’s live market performance yields invaluable insights. Historically, the ABCD pattern has been a consistent strategy for traders focusing on short-term market swings. Its appeal stems from its clarity and predictability, providing specific entry and exit points.
For example, during the volatile market fluctuations of 2020, traders who integrated the ABCD pattern with other technical indicators reported notable success. The pattern’s ability to anticipate reversals allowed traders to position themselves advantageously. This adaptability is crucial in major financial markets, like the S&P 500 or the AUD/USD, where volatility can be significant. Learn more about the ABCD pattern’s historical performance.
Case studies, encompassing both successes and failures, offer a nuanced understanding. These real-world examples showcase effective pattern utilization and the challenges encountered. They highlight the importance of integrating the ABCD pattern with other trading principles and risk management techniques. Studying these examples can help aspiring traders avoid pitfalls and develop a more robust trading approach.