Take my trading potential quiz and get a custom report based on your unique strengths. What type of trader are you? It is FREE and you should take it even if you have some trading experience already.
The instant Amazon’s price action bestseller with hundreds of positive reviews. Learn the right way to use Price Action so your money starts working for you — finally. No guilt or excuses. Just a simple approach that works.
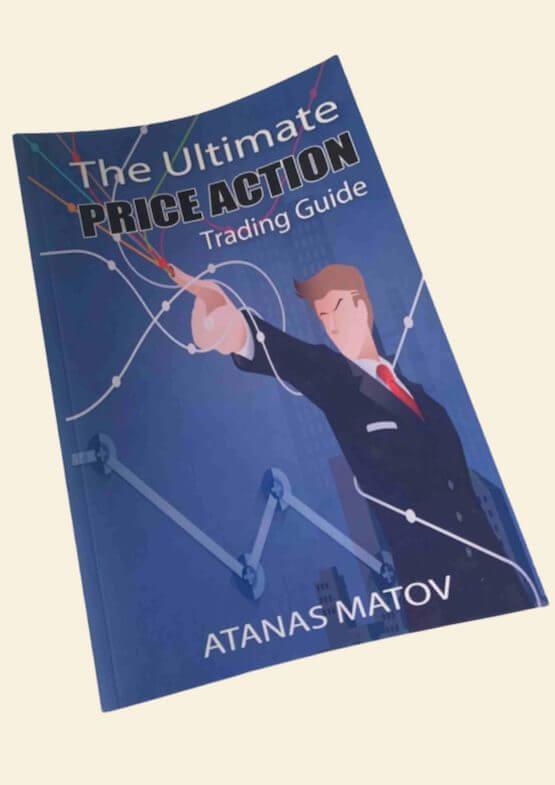
Stop paying $1,000s for expensive courses and pray they’re better (an expensive bet that rarely pays off). Start by learning the basics of trading with price action. We will teach you how to use this powerful tool, so you can finally stop trashing in the dark and start watching your trading pay back for the time invested in learning.
What would it look like for you to work on your own terms? Would you be your own boss, take 6 weeks of vacation every year, or never miss another one of your kid’s Little League games? How to go from newbie to supply and demand trading expert without the stress
We’ll show you how by sending our best content straight to your inbox.
Action-based, proven programs to help you improve your trading performance
Master the fundamentals of Supply and Demand Trading with our award-winning trading course. Thousands of traders have started their successful trading journeys with this course. Want to join them?
What you can’t expect from us: a degree, diploma, certificate or fancy badge. What you can expect from us: a transformation in your trading skills, performance, and consistency


“Technical analysis and price action are extremely popular tools in trading. Colibri Trader also discusses the psychological aspects and places a lot of emphasis on trading discipline and money management. Colibri Trader is extremely generous with his time and knowledge and he never let me alone in this hard and long trading journey. I can finally see all those efforts materialise into profitable trading. Thank you so much for sharing all that and always being there for us!”
Fanny Csts
30 April At 16:07
“It’s not the method, it’s the mentor. Colibri is very patient to reply each of my emails. Looking back, many of my questions seems to be stupid questions. But with colibri’s guidance, now i am able to see what trading is all about. Not only with trading, but also with life. Trading teaches us to know ourselves better. And colibri teaches us how to be a better us. Thanks Colibri!”
Marco Chan
30 April At 17:19
“Colibri Trader offers probably the best trading education online. So much amazing free content and a great trading course. Colibri Trader’s Price Action Method is probably the best trading system I have ever tested. Thanks for sharing your trading skills with us! I am forever grateful!!”
llja Isaac
30 April At 16:26
“I have paid for 4 Forex training courses from other mentors and this one that is being offered cheaper and is the BEST by far! I have been watching youtube videos for about 6 months now, so I know what to look for and I know what I need to learn and I can already tell that I will learn a LOT in this course. I also appreciate that the instructor is NOT trying to sell their platform or anything else to me. I am learning a lot and FINALLY understand price action which I was a bit confused with. Thank you very much!! I really appreciate this Instructor getting straight to the details and not talking about himself over and over again! Thank you I really appreciate this course!”
Er Honey Bhadla
1 May At 11:44