


What are Supply and Demand Zones and How to Trade with Them
What are Supply and Demand Zones and How to Trade with Them
Supply and Demand zones do offer a great insights into the structure of any market. If you have an idea of how to trade with support and resistance zones, you might find supply and demand zones very similar.
You won’t be mistaken.
Supply and demand zones are very similar if not the same. There are certain rules though that make them stand aside and IMHO shine brighter than just support and resistance. I will make sure you will find out exactly why in this article.
Else, to fast-track your learning curve, you can check out my Ultimate Supply and Demand Course.
What are Supply and Demand Zones
So, what exactly is a supply zone and a demand zone.
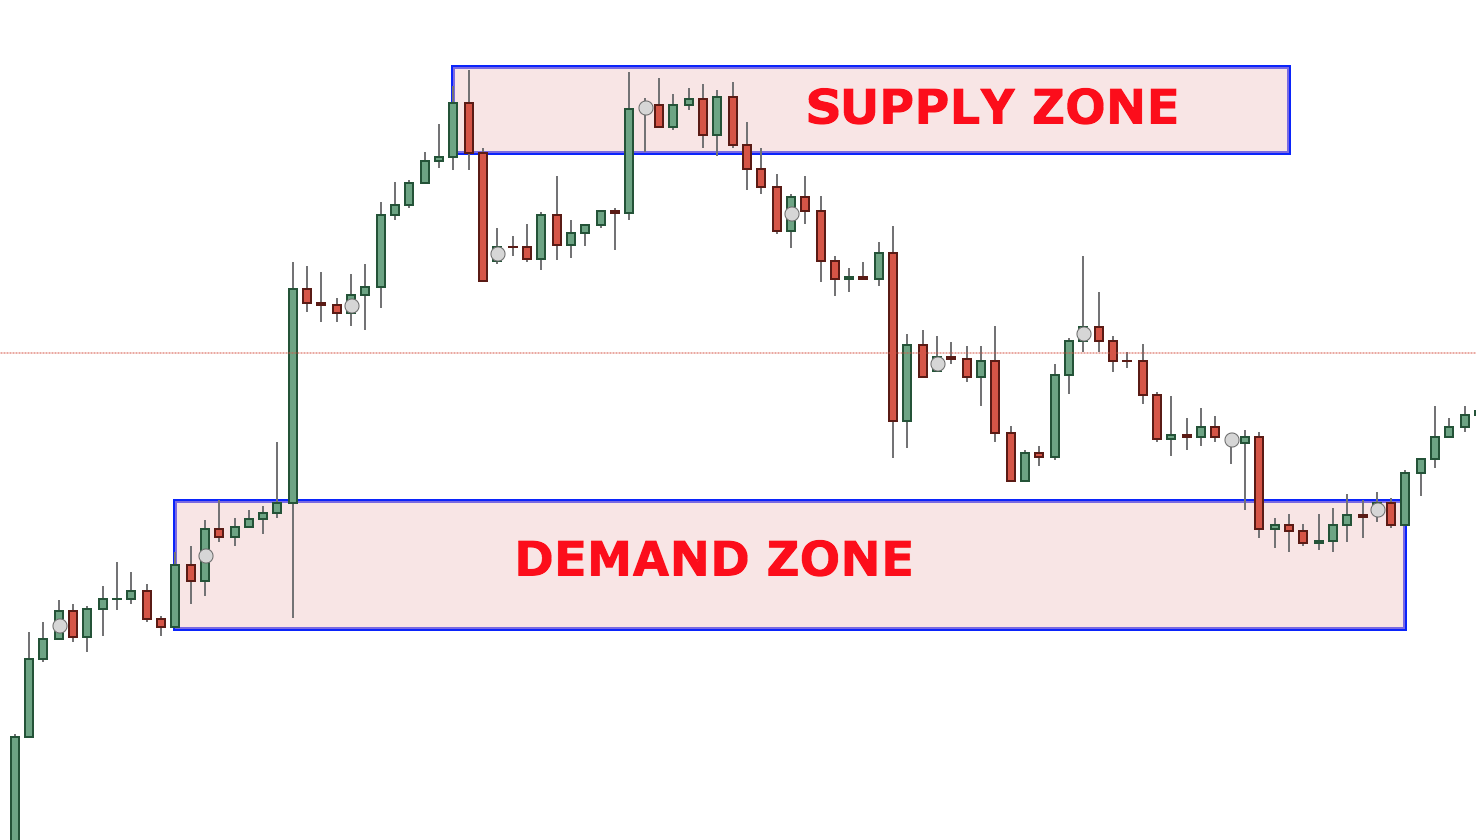
This would be best described by a chart:
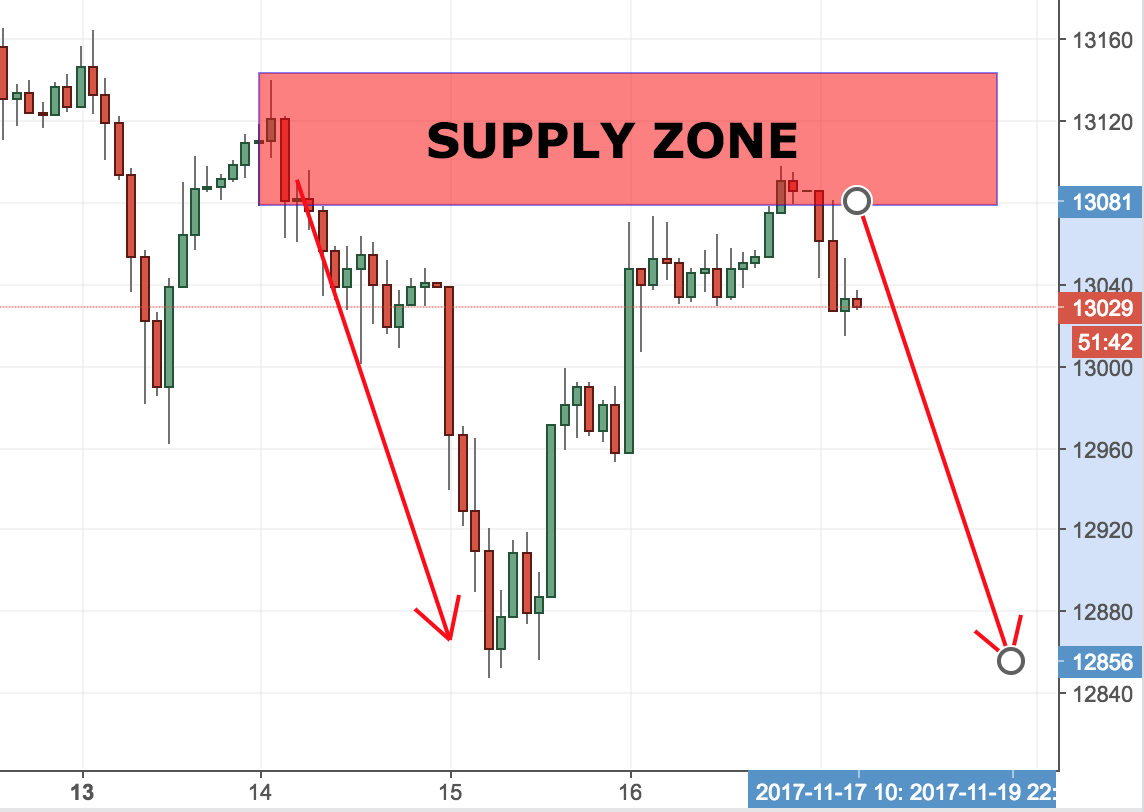
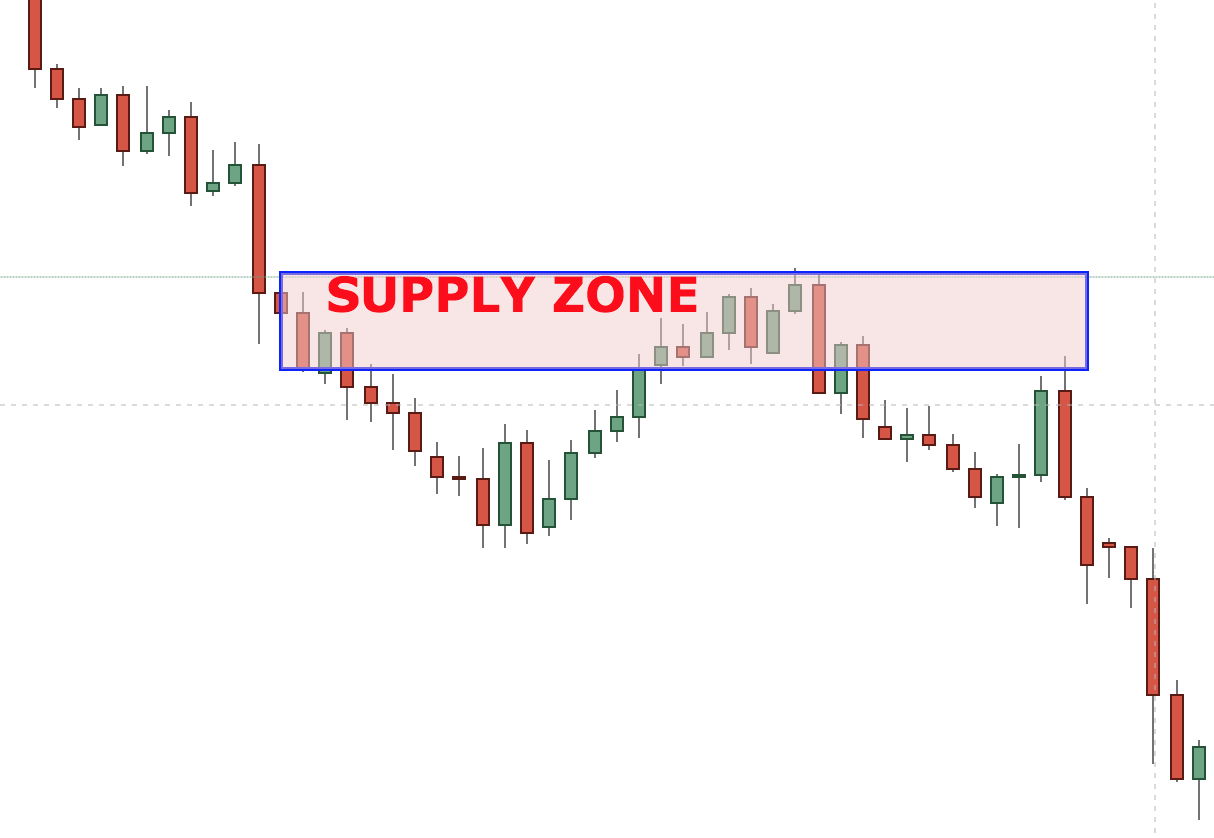
In the image above you see the German stock market DAX. The red zone is marked as a supply zone. This could also be defined as an active resistance level or a place where traders are selling huge amounts.
These levels are more broad than a resistance line. They are very similar to resistance zones.
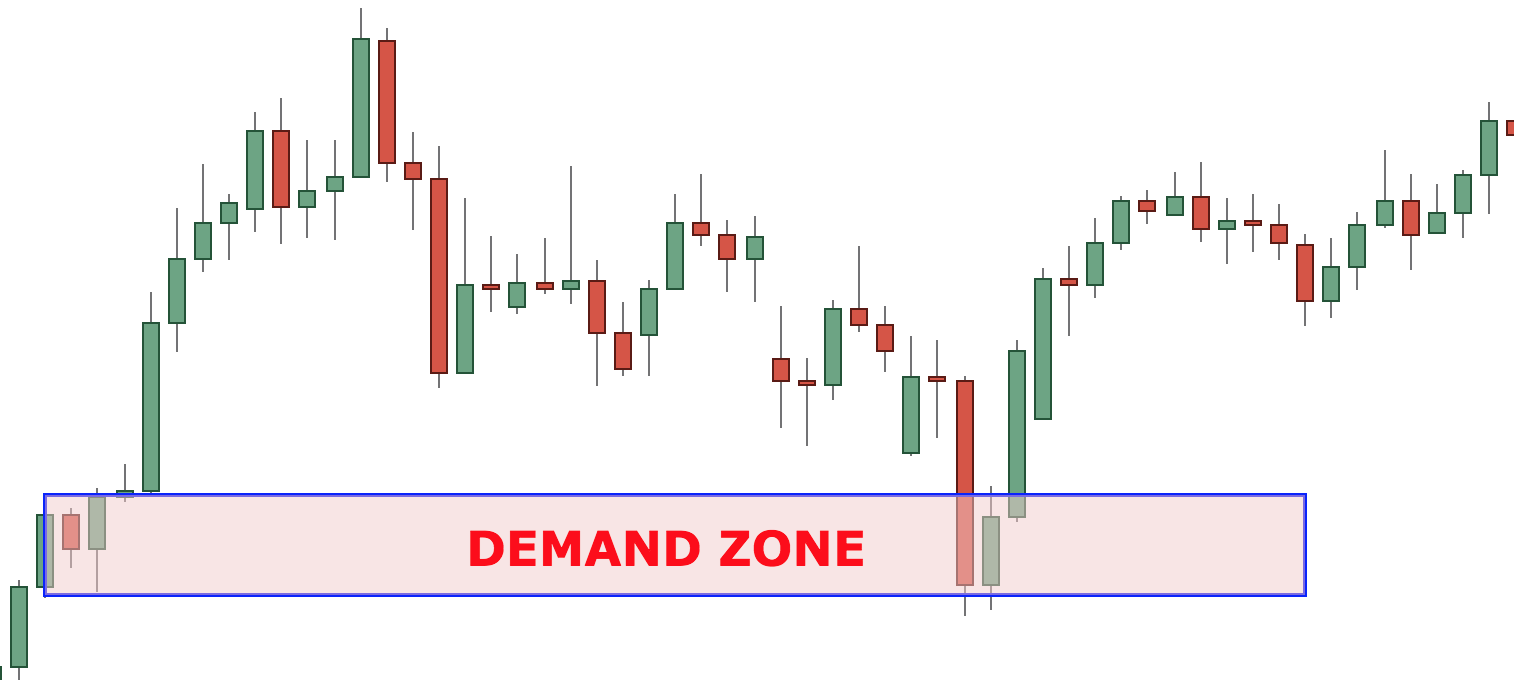
On the other side, a Demand zone is a broad area of support, just like the image below.
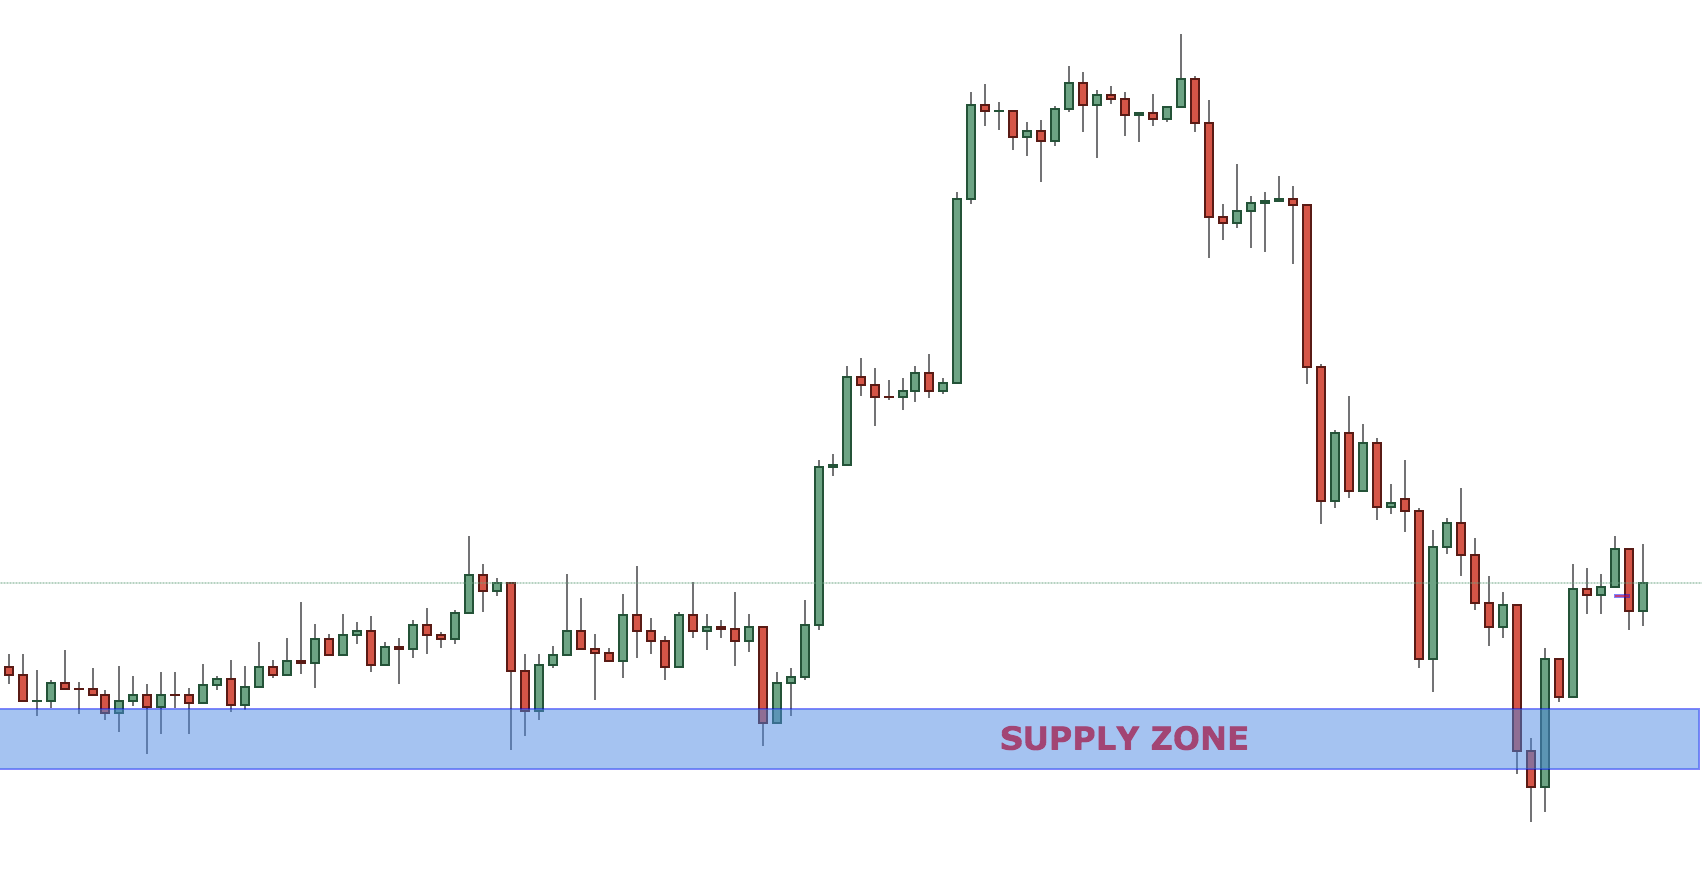
In the chart above you can see a supply zone or in other words a very broad support level. It is also a level concentrated in buyers. As you can see every time price approaches the supply zone it quickly jumps back up.
Another characteristic of supply and demand zones is the quick price action. As pointed out above, price action is very fast around those levels, so if there are opportunities they are quickly absorbed.
Here is a separate article that helps traders master price action trading with supply and demand

Candlesticks and Supply and Demand
A very important element of supply and demand trading is the use of candlestick charts in conjunction with it. Although I have written a very extensive article on Candlesticks, I will briefly touch them here.
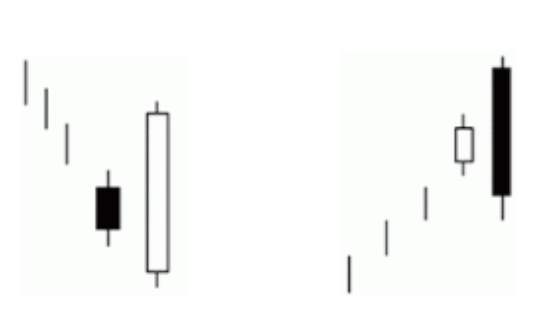
The two most important candlestick patterns used in conjunction with supply and demand levels are the pinbar and the engulfing pattern. The majority of traders using supply and demand zones will be looking for rejections or confirmations of these levels.
Therefore, it is essential that you can recognise at least those two candlestick patterns. Below is given an example of them both:
PINBAR
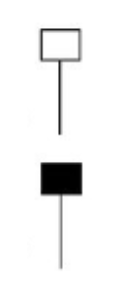
BULLISH AND BEARISH ENGULFING PATTERNS
In order to help you visualise even better candlesticks in action, I have included a real-life example:
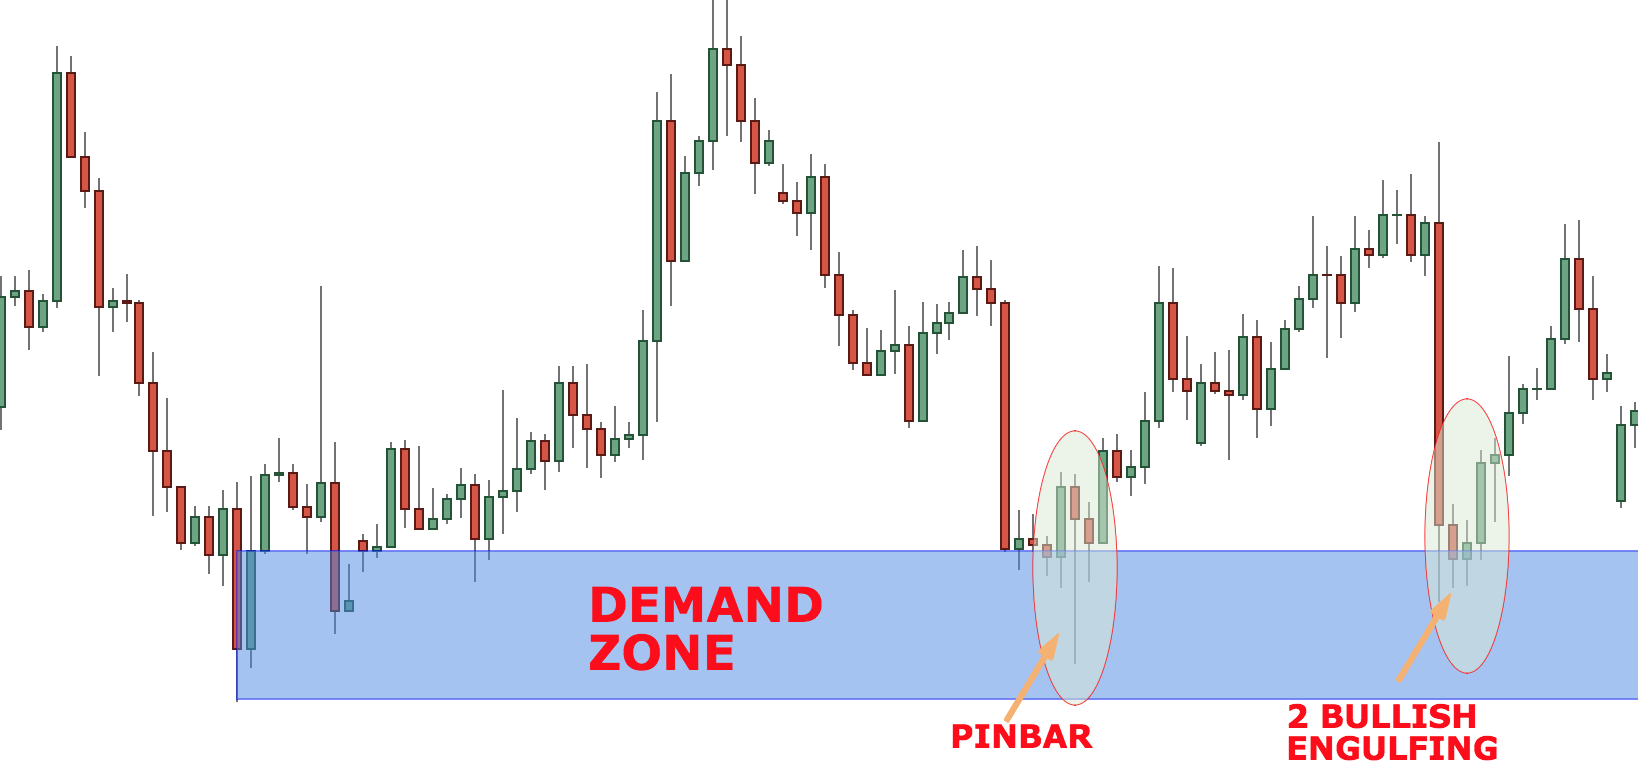
In the example above, there are two candlestick patterns- Pinbar and a 2 Bullish Engulfing Pattern. As you can see from the chart above, price quickly jumps higher after those candlesticks have been formed.
Support and Resistance Levels vs. Zones
As explained before, support and resistance levels are very similar to the zones. The only difference is that zones encompass larger area. The other difference is the way to draw supply and demand zones, but we will come to this later.
In practice, support and resistance and supply and demand zones are beasts from one and the same origin.
If that helps, you can even imagine supply and demand zones as large support and resistance areas with a huge concentration of buyers and sellers respectively.
Timeframes and Supply and Demand Zones
The good news is that Supply and Demand zones can be used with equal success on all timeframes. I would still recommend that you use them on timeframes higher than 60 minutes. Anything below that consists of a lot of noise and more false signals.
In my experience, the best timeframes to spot supply and demand zones are the 4H and the Daily.
The Setup- How to Find Supply and Demand Zones
The best way to find supply and demand zones is to look at a candlestick chart. Here is the order of things to do to spot supply and demand zones :
- Look at the chart and try to spot successive large successive candles. It is important that price moves a lot
- Establish the base (beginning) from which price started the quick move
- Usually, before a large move you have a small sideways move- that is where your supply and demand zone is
Let me give you an example, so you can understand what I mean by large successive candles: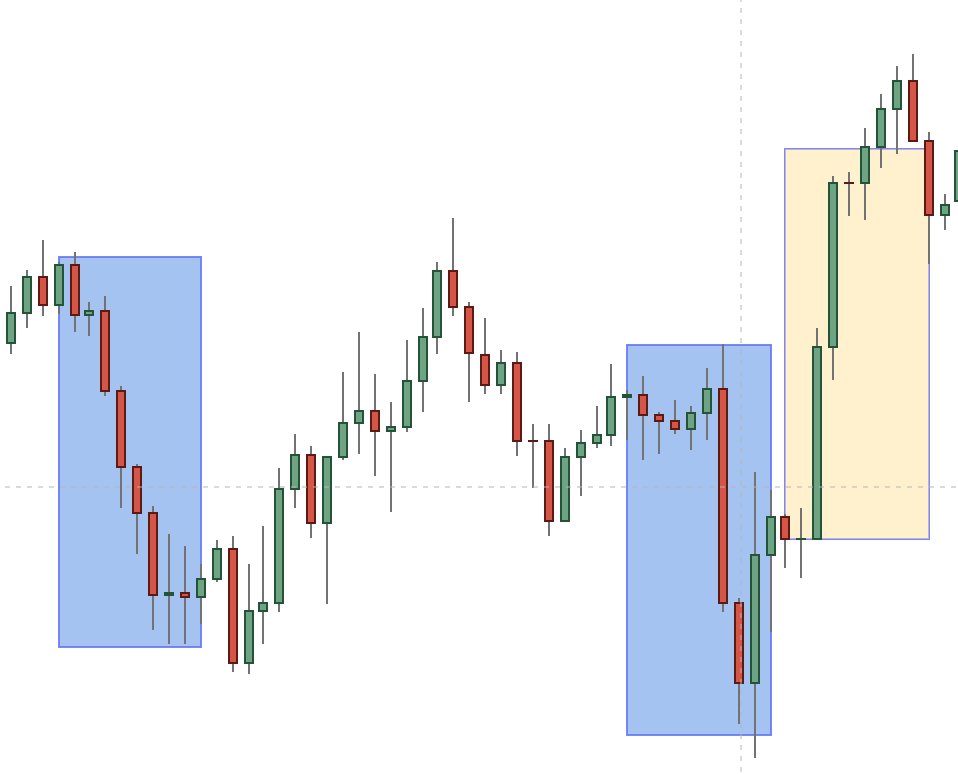
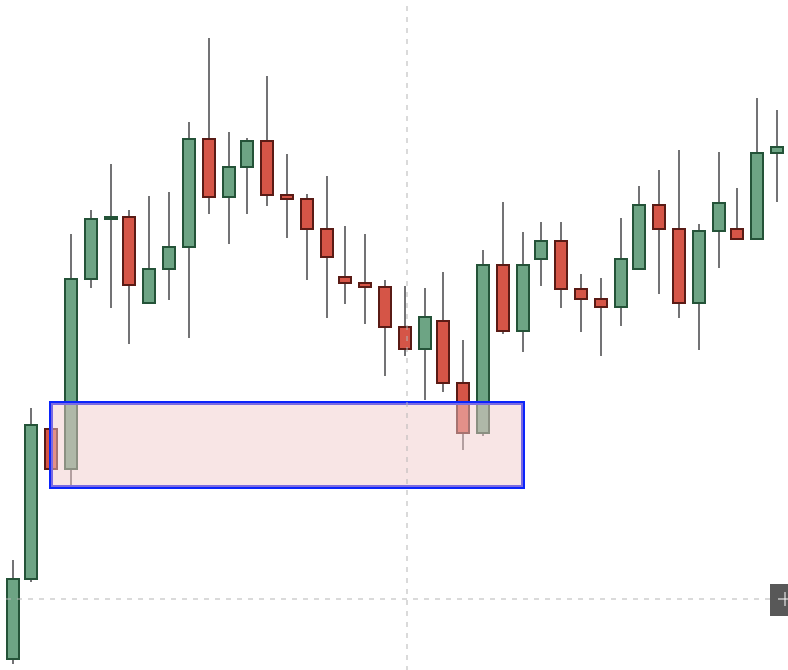
You can see in the image above that the three areas are showing areas of fast moving price. These are exactly the type of market moves you should be looking for. Now, the question remains- how do we define the supply and demand zones.
The best way to show is through an illustration. Let me draw them, so you can better visualise:
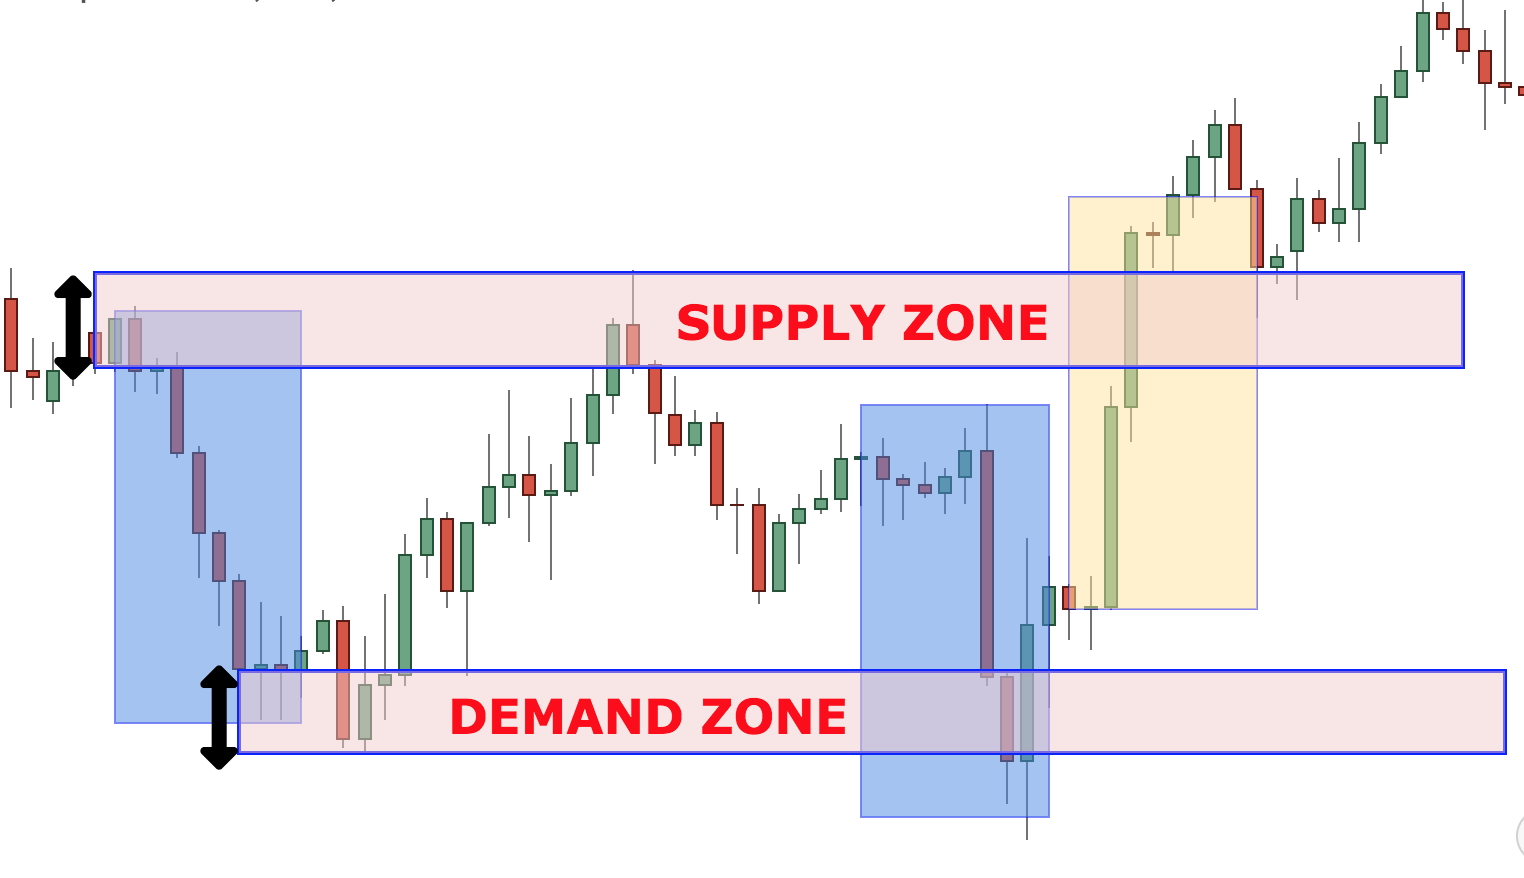
As you can see in the image above, the demand and supply zones are encompassing the base on the beginning of the move. It is very hard to be precise with those levels and here it is more of an art than science.
The good news is that after a while you get used to spot those levels and your eye turns into an automatic scanner.
Remember: The most important thing is to first a sharp move in either direction, after which you can pinpoint where it started from and roughly define the demand/supply zone.
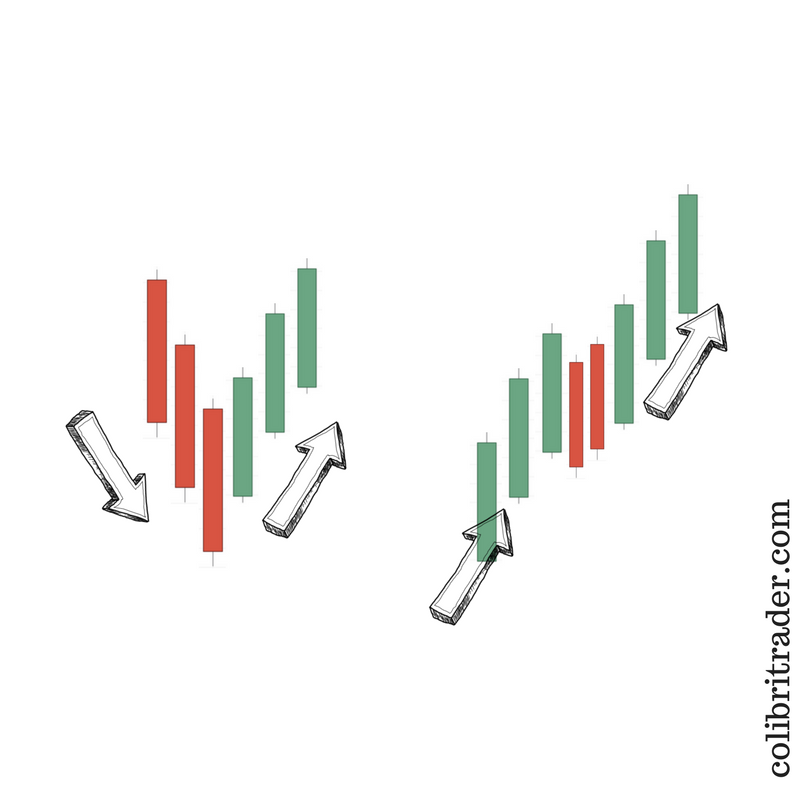
Different Types of Supply and Demand Formations
There are different supply and demand zone patterns. Some of the more popular ones are shown below:
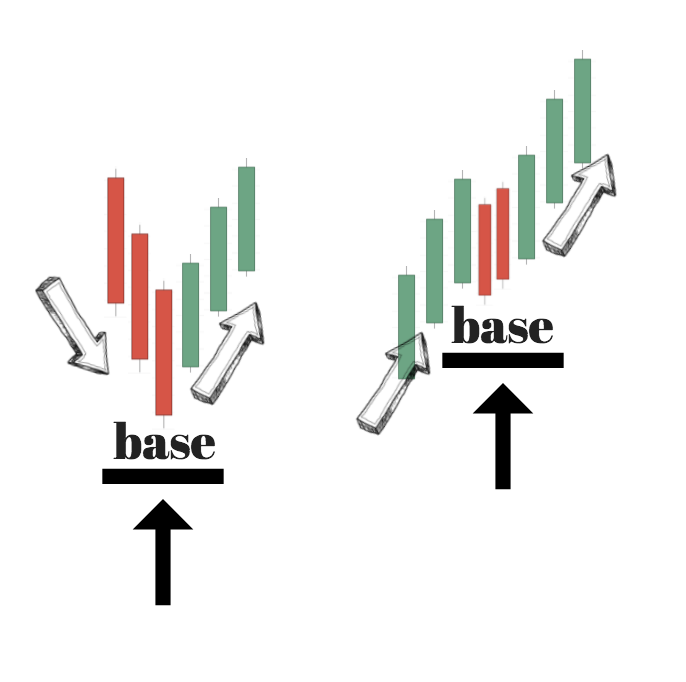
In the image above, there are two potential scenarios. In the first one on the left, we have price going down (D), then forming a base (B) and then going up (U) again. I will call this setup the DBU setup.
In the right image above, there is an uptrend (U) first. Then, we have the price forming a base (B) after which we have a continuation of the uptrend (U). I will call this setup UBU.
There are two possible setups when reviewing the supply and demand zones. They are:
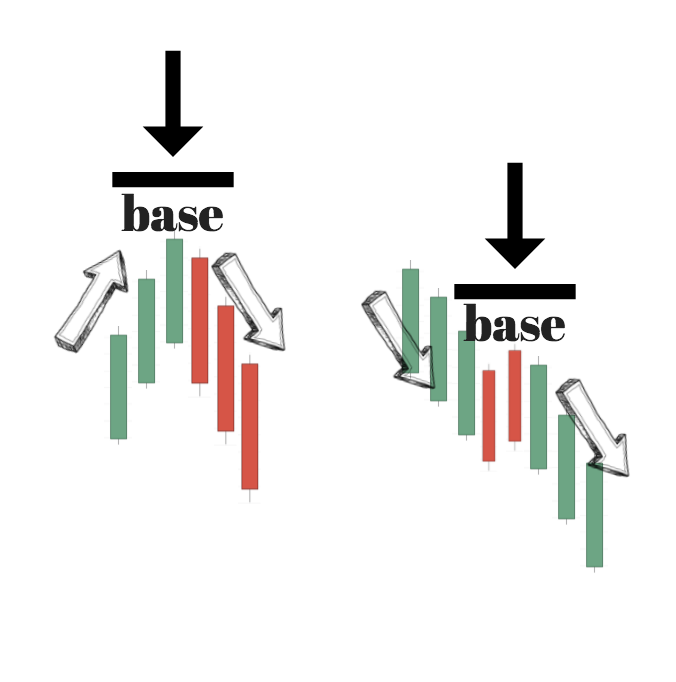
In the left image above, we have the prices going up (U), then forming a base (B) and then going down (D). I will call this the UBD setup.
In the right image above, we have price going down (D), then forming a base (B) and after that it continues its fall down (D). This is the DBD setup.
So, the 4 setups (you don’t need to remember the abbreviations) are DBU, UBU, UBD and DBD. This is how you can identify the different supply and demand zones.
How to Identify Supply and Demand Zones
So, how to identify those 4 major types of supply and demand formations. As pointed out above, you need to follow the three steps in order to identify the supply and demand zones.
- Look at the chart and try to spot successive large successive candles.
- Establish the base
- Draw the zone
As already outlined, it is hard to draw a precise zone- it takes time and practice to be able to spot those areas. What you need to do is just follow the rules and practice enough until you feel confident in drawing these levels.
Don’t forget that this is how everyone else using those levels successfully has learnt it. After a while, it will become natural and you will be able to spot them quickly.
Let’s check a few other examples of supply and demand zones now.
The first example is a 4H chart of the USDCAD:
It is important to note here that a demand/supply zones can and often is including the tails of the candles. As you can see from the demand zone above, there is a large lower tail that is included in the zone.
The next image is taken from the daily chart of the AUDUSD. As you can see, this is a typical UpBaseUp (UBU) pattern (as defined above).
The next setup is taken from the Daily chart of the USDCAD. In it, you can see a typical DownBaseDown (DBD) pattern.
Let’s continue with the rules of entry, stop loss and take profit and then look at some more examples.
Entry, Stop Loss and Take Profit
For the sake of showing those levels, let’s first use an example.
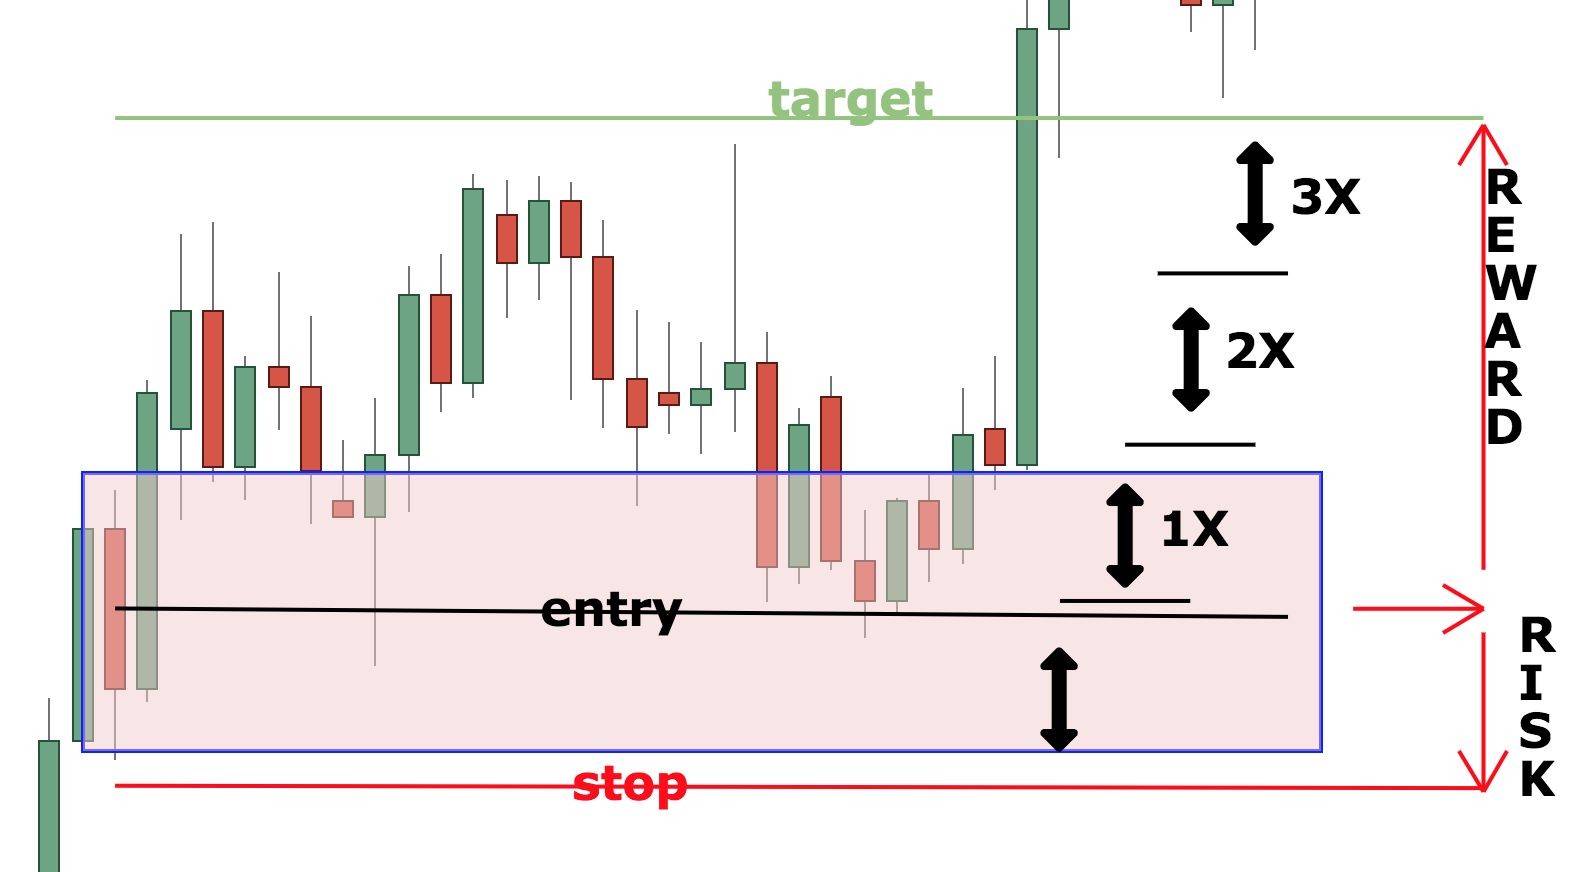
In the image above, you can see the supply and demand trading rules. This is just one way you can trade with supply and demand zones. Different traders will have different rules, but what is important to note here is that you should always be aiming at higher rewards than the risk taken.
In the example above, the ratio is 1:3. The entry is usually the middle of the supply or demand zone. The stop is usually 5-10 pips below the demand zone, as indicated by the red line. Your target should be at least 2x or 3x your risk (as indicated by the image above).
These are just indicative parameters. In order to achieve mastery in trading, you will need to spend more time and practice than reading just a single article. If you are interested to learn more about my professional trading strategy and join the rest who did, you can get it HERE.
Example 1 of Supply and Demand
Let’s give another example of supply and demand, so it can become more clear to you.
This example is taken from the USDJPY daily chart. You can see that we have a UpBaseUp (UBU) pattern above. The demand zone is clearly defined by the upper and lower boundary.
An alternative way to approach those levels is by using another tool for confirmation or another timeframe for confluence.
Again- different traders will use different strategies, what matters in the end is your P/L.
Example 2 of Supply and Demand
In this second example, I will show the daily chart of the GBPJPY.
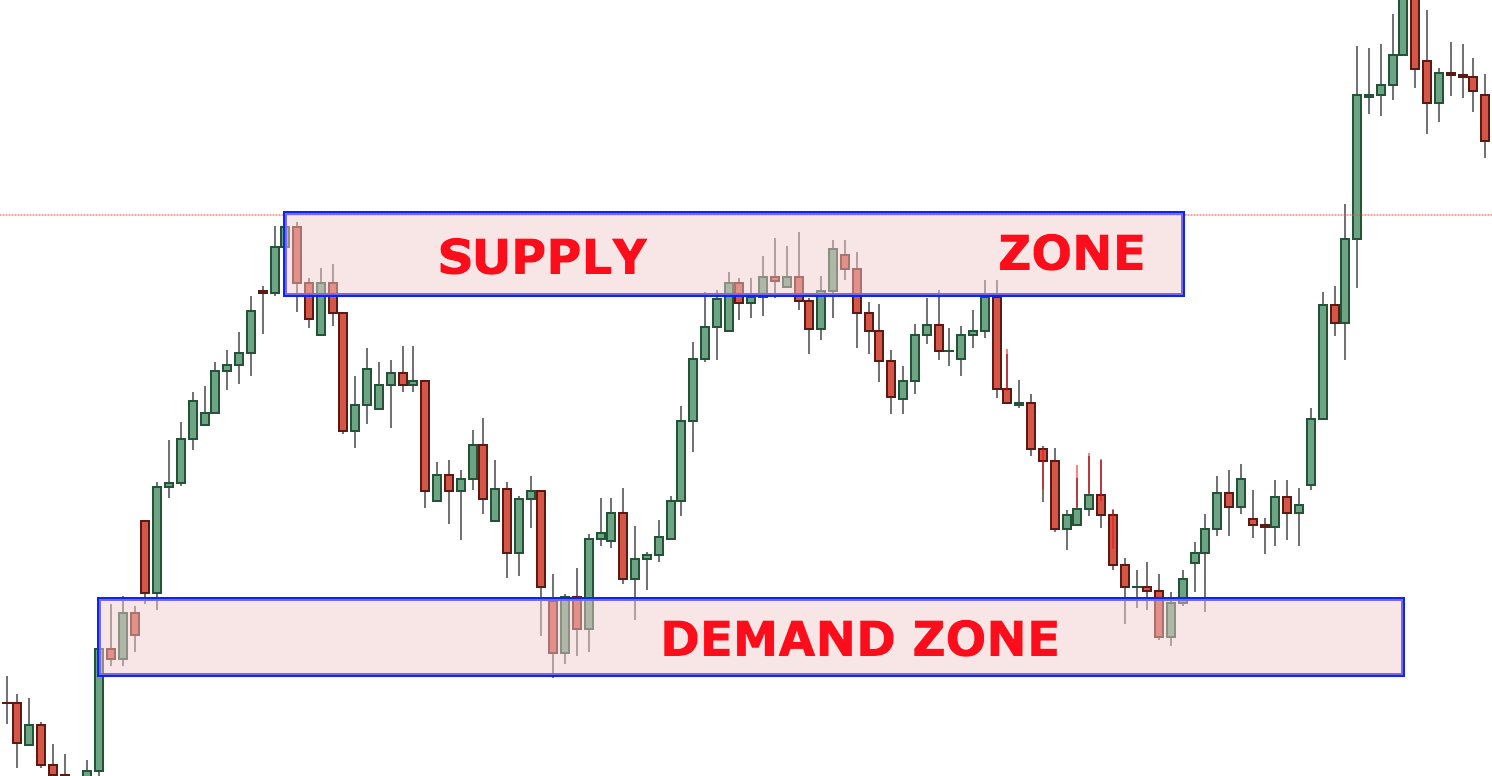
You can see two supply and demand zones. The demand zone is where all the big buyers are located. The supply zone is where all the big sellers are located.
You can see how fast the price is moving once it reaches one of those levels.
I can continue giving more and more examples, but in the end of the day, it comes ultimately down to you to start spotting those areas. You need to practice until you get the hang of it. It might take some time, but demand and supply zones are a wonderful tool for the price action trader.
You can also, check out my advanced supply and demand article, which will expand on the topic.
Do Not Expect Miracles
As with anything else, supply and demand zones have their cons, as well. There is no perfect trading strategy or tool. What makes a difference along the way is your attitude towards trading.
A few are the most crucial things beginner traders need to pay more attention to:
- Proper trading education
- Trading practice (preferably on a Demo account first)
- Trading discipline
- Sticking to your rules in good and bad days
- Open mind
Being able to tick those 5 boxes will give you more freedom than you can imagine. As Auberon Herbert has put it:
“You will not make a man wiser by taking freedom of action from him. A man can only learn when he is free to act.”
Happy Trading,
Colibri Trader
p.s.
If you want to continue your learning experience, check out my professional trading course
In case you want to learn more about Support and Resistance, here is probably the most comprehensive article online
hi colibri,
thanks fot showering us with this article. visiting your site once in a while is just like visiting church of trading.
while we go to church every sunday, we most of the time will be rejuvinated with some holy scriptures, although we can guess what the priests are saying as we hear it over and over again.
same goes here, after a while, i think i know what you are saying, and we need to be rejuvinated by you saying it again so we are reminded and not take things for granted.
we have moses with God’s commandements for living life. we have colibri with commandements for making money from trading.
want to know what God’s commandements for trading with consistency written through colibri?
join colibri’s professional course.
-harry
I like the way you guys explains these topic
Thanks! Let me know if you have any questions
You guys are great
Hi you have mentioned how to mark base by covering all the weaks. Is there any condition to mark top area. How we are coming to the conclusion.
What do you mean by “weaks”? Can you elaborate, please?
Best article I wish I can have the copy to read it again and again. Thank you
Good staff
Good staff I like.
Thank you!
Greater education
Thank you Samora!
Superb articles…simple and easily understandable..keep on doing….
Thank you Akhila! Anything else, please let me know.
Perfect thanks
No problem! Let me know if there is anything
I am new to trading,please direct me on how to get started.
Hi David, you can start with my articles on supply and demand zones and lines. Then if you still have questions, please let me know on admin@colibritrader.com. I hope that helps!
i would like to say i like your supply and demand zone stategic i wish and i beg you to help me that pdfto ma emal
Please e-mail me and I will send you the PDF.
Excellent Article! However, in the section called Candlesticks and Supply and Demand Levels, I am confused as to what you mean by the 2 Bullish Engulfing Pattern. It does not look like the previous bars are being engulfed by the candle and wicks of the Bullish Candles.
Thanks for the feedback, Eric. If you check my article on Bullish and Bearish engulfing pattern, you will see my take on it. Anything else, please let me know or drop me a PM to my e-mail. Cheers
Ah ok I just read the article and understand what you are getting at now. I can see how those patterns would signify a strong upwards/downwards movement.
Just to clarify a 2 Bullish engulfing pattern means there are 2 Bullish Candles where at least 1 of them engulfs the previous Bear Candle? And if there are 3 Bullish Candles, it is still an engulfing pattern if at least 1 engulfs the previous Bear Candle?
The point is for the candles to engulf the previous candle- whether be it 1 or 3, the principle is the same- it is the market psychology that stands behind and this means that sellers are “overpowering” buyers
Yes, that is exactly what they do. I am glad you have covered this article 🙂 This is probably one the best patterns out there
Best article ever!! Thank u for making trading easy
Thanks for the reinforcing words! Let me know if you have any questions
Excellent Article! I have a question. As in the support and resistance zones, a broken supply area becomes into a demmand zone?
Yes, you can say that! Great question 🙂
I have gone through your thoughts and teaching three to four times. It is well explained on demand and supply zone. I have read many writers but you have given clear concept. So many many thanks to you and your team.
Thank you for the nice words, Vinod! I hope this article can help you to reach consistency in trading! Stay positive!