


Trading with Price and Time

Trading with Price and Time
Download the Contracting Triangles Spreadsheet
Trading with price and time has been the absolute target of generations of traders. Putting a price forecast is one thing. But being able to determine the time or when the market reaches the target, is another.
If something comes close to the holy grail in trading, that’s price and time.
Nothing else.
Throughout the technical analysis history, many traders tried to put the two together. Some, like W.H. Gann, were so successful, that became legends. For instance, Gann famously predicted the price of a particular stock on a certain day, weeks in advance. As it goes with legends, his ways of trading with price and time died with him.
Most of the trading tools used by Gann still exist today. However, the way to combine them to predict both the price and the time in a trade isn’t known anymore.
But few patterns and trading theories still use the price and time concepts together when making a forecast. One famous way of using the time we’ve covered in a previous article.
The head and shoulders pattern is more powerful when the right shoulder takes about the same time as the left one. Hence, the time comes to reinforce a reversal pattern.
The Elliott Waves Theory uses the time concept extensively. In fact, we can still say with certainty that two things put an order in the complexity of the Elliott theory: Fibonacci numbers and the time rules.
Elliott used time in combination with price to confirm a pattern. Things need to happen in a defined period, or the move isn’t impulsive or corrective.
We’ll use this article to illustrate how price and time work with the Elliott Waves Theory. But also to show how to use the time concept in a pattern that is very common in today’s currency market: rising or falling wedges.
Trading with Price and Time – Elliott Approach
Somewhere in the middle of 1930’s, Ralph Elliott began to study the stock market. Fascinated by the advances and declines that seemed random, he documented them in strong relation with human sentiments of optimism and pessimism.
For instance, an exuberant market always rises following a certain pattern.
But is the same pattern true during panic selling?
After years of studies, he put down the rules of what is now known as the Elliott Waves Theory.
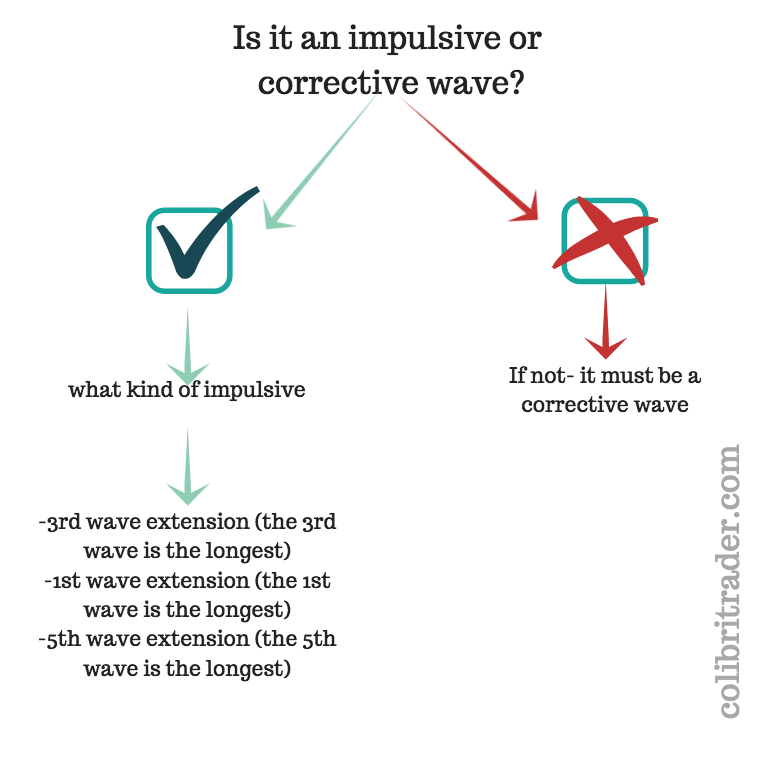
Starting from a straightforward question (is a move impulsive or corrective), the theory is nothing, but a logical process meant to reveal the next pattern to unfold.
Here’s how the logical process works:
- Is this an impulsive or corrective wave?
- If yes, what kind of impulsive wave
- 3rd wave extension (the 3rd wave is the longest)
- 1st wave extension (the 1st wave is the longest)
- 5th wave extension (the 5th wave is the longest)
- If not, it must be a corrective wave
- If yes, what kind of impulsive wave
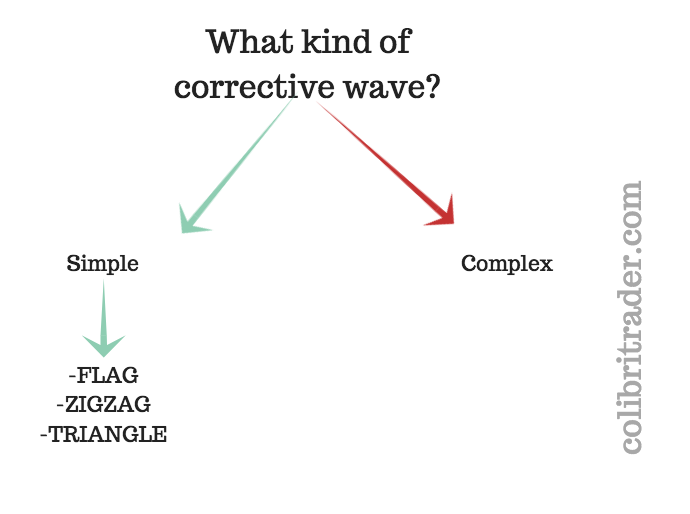
- What kind of corrective wave
- Simple
- Flat
- Zigzag
- Triangle
- Complex
- Simple
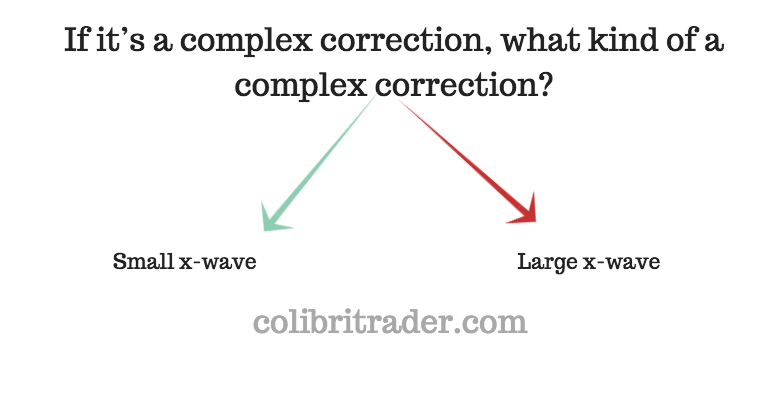
- If it’s a complex correction, what kind of a complex correction?
- Small x-wave
- Large x-wave
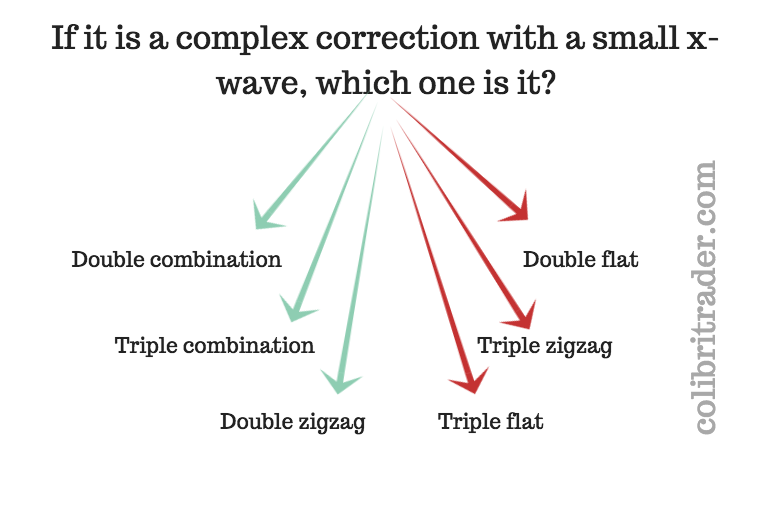
- If it is a complex correction with a small x-wave, which one is it?
- Double combination
- Double flat
- Double zigzag
- Triple combination
- Triple flat
- Triple zigzag
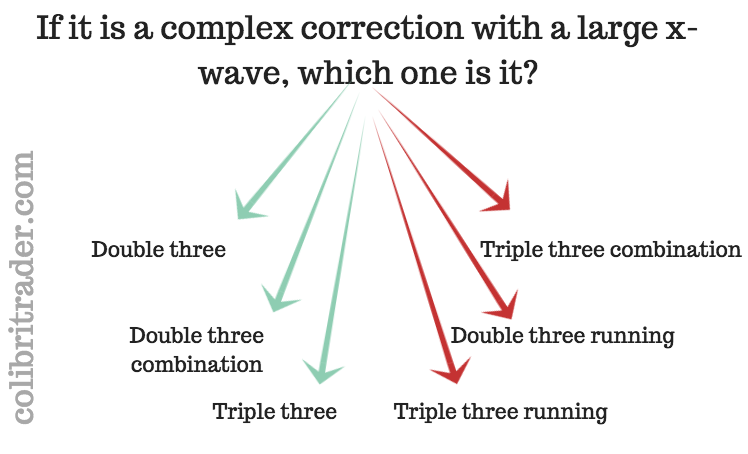
- On the other hand, if it is a complex correction with a large x-wave, which one is it?
- Double three
- Double three combination
- Triple three
- Triple three combination
- Double three running
- Triple three running
These are pretty much all the patterns discovered by Elliott. He documented them extensively, and the next challenge was how to put everything together.
He used time and Fibonacci ratios to lay down things that must happen in a pattern. And so, trading with price and time using the Elliott Waves Theory became a reality.
The Rule of Equality when Trading with Price and Time
We won’t cover all the situations when trading with price and time works with the Elliott Waves Theory. Instead, we’ll pick some of them to illustrate how powerful a trade is when it combines both price and time.
Important: One of the rules laid down by Elliott is called the rule of equality.
It applies only to impulsive waves, and many traders believe it refers only to price. Instead, it uses the time element too.
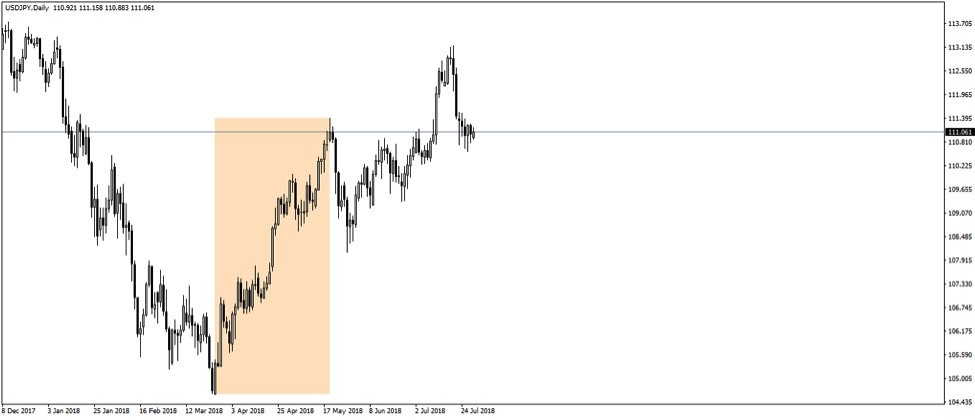
To explain it we’ll use examples to see how price and time together confirm or not an Elliott Waves scenario. The above chart shows the USDJPY on the daily timeframe, with the bounce from the 105 level looking like a possible impulsive move.
But, is it?
A five-wave structure is, indeed, evident, but the entire move needs to respect all the rules of an impulsive wave. INCLUDING the rule of equality.
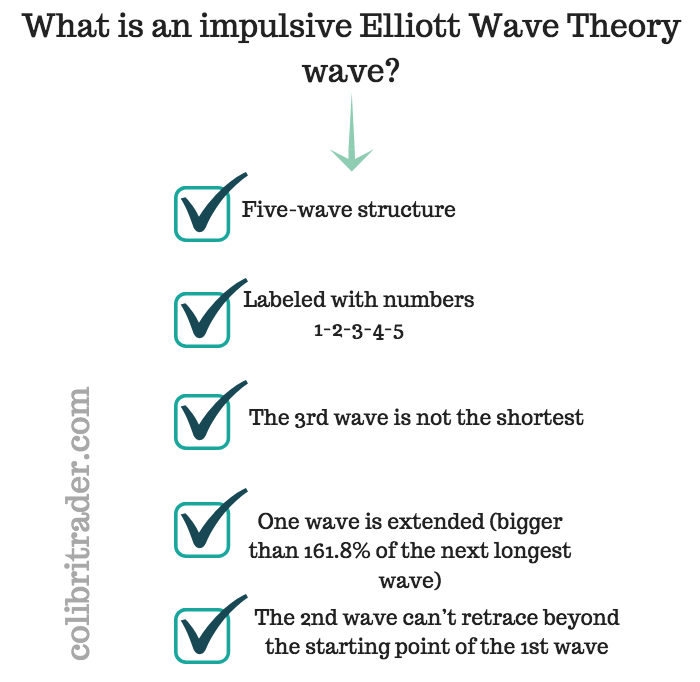
Before going into details about what the rule of equality is, let’s have a quick reminder of what an impulsive wave with the Elliott Waves Theory is:
- Five-wave structure
- Labeled with numbers 1-2-3-4-5
- One wave is extended (bigger than 161.8% of the next longest wave)
- The 3rd wave is not the shortest
- The 2nd wave can’t retrace beyond the starting point of the 1st wave
The highlighted area in the chart above shows the price action from the bottom, indicating a possible five-wave structure. Moreover, it seems to follow all the rules of an impulsive wave, a 3rd wave extension.
But, is it?
Rule of Equality Explained
All the rules of an impulsive move listed above aren’t enough to call it impulsive move. While the 1-2-3-4-5 seems valid, only the price and time together give the final answer.
For a five-wave structure to be an impulsive move:
- Wave 1 and wave 5 should not be equal in price
- Instead, they should relate to a Fibonacci ratio in the 61.8%-161.8% range reciprocity
- Wave 1 and 5 should take about the same time or relate to 61.8%-161.8%
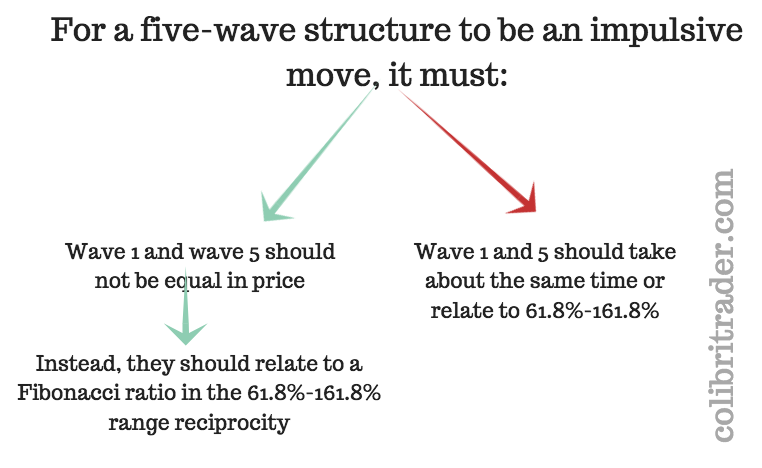
Hence, the first rule refers to price (the length of the two waves) while the second one to time (the time taken for the two waves to form).
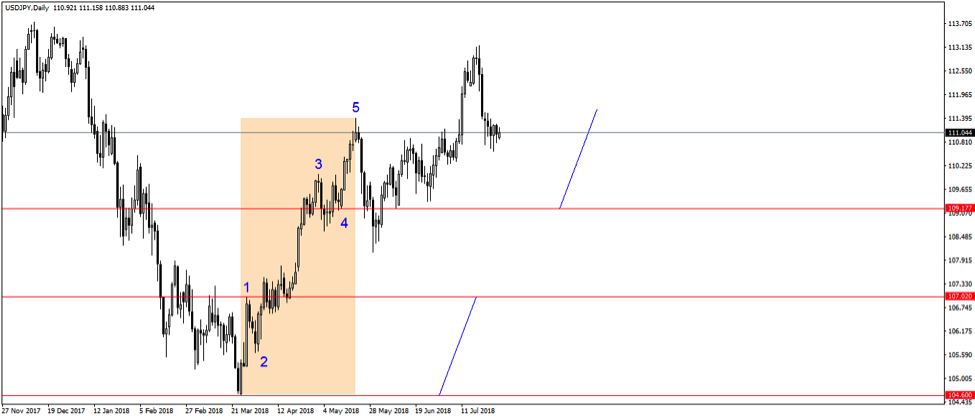
A close look tells us this is no impulsive move for the simple reason that the 5th wave equals the 1st wave in price. The two blue lines tell us they’re almost equal.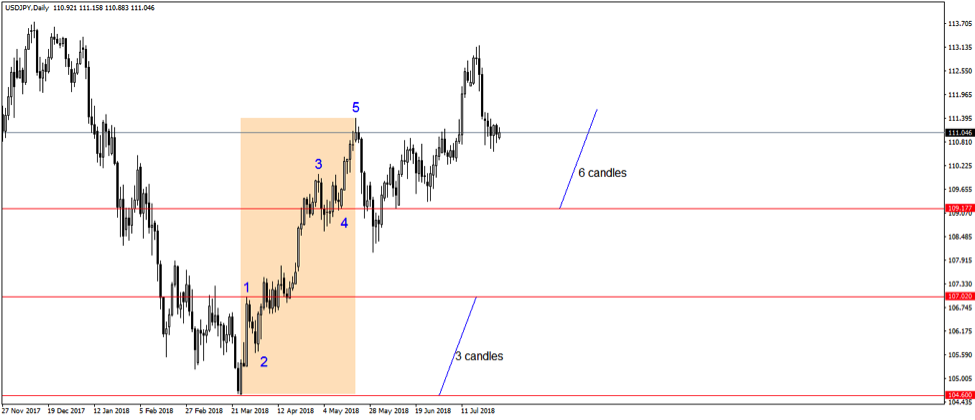
Also, if we measure the time taken for the 1st wave (3 candlesticks) and the time it took wave 5 to form (6 candlesticks), we notice it doesn’t match the rule. Hence, while the pattern looks like an impulsive move, in reality, it isn’t.
Price and time in technical analysis as used by Elliott keep the trader on the right side of the market.
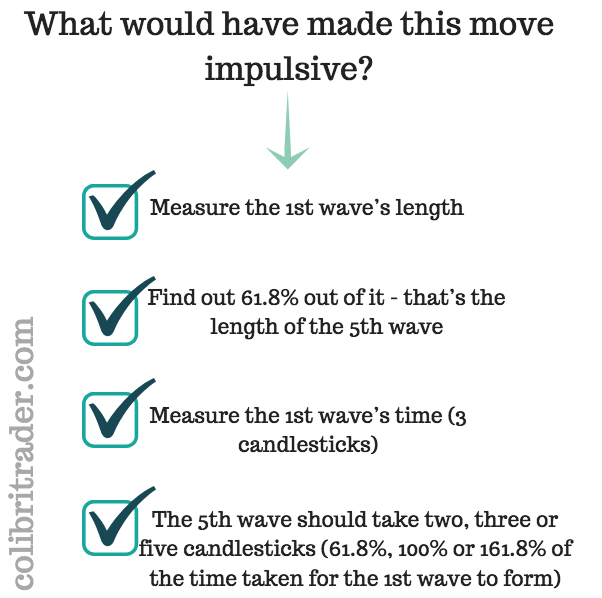
What would have made this move impulsive? Here are the steps to check:
- Measure the 1st wave’s length
- Find out 61.8% out of it – that’s the length of the 5th wave
- Measure the 1st wave’s time (3 candlesticks)
- The 5th wave should take two, three or five candlesticks (61.8%, 100% or 161.8% of the time taken for the 1st wave to form)
Trading with price and time means integrating both concepts in such a way to confirm the patterns documented in the Elliott Waves Theory. In this case, the USDJPY potential impulsive move failed the price and time test.
Price and Time with Rising or Falling Wedges
As reversal patterns, rising and falling wedges often appear in the currency market. They show the price hesitation towards the top or the bottom of a trend, making only marginal highs or lows before turning.
A wedge is a beautiful top or bottom formation that allows trading with price and time. In fact, in doing that, traders keep a disciplined approach to trading so that they avoid false patterns.
The nature of a wedge is given by a series of higher highs and higher lows (in the case of a rising wedge), or lower lows and lower highs (in the case of a falling wedge).
As all traders know by now, a rising wedge is “falling,” meaning it anticipates bearish price action and a falling wedge is “rising,” or expects future bullish price action.
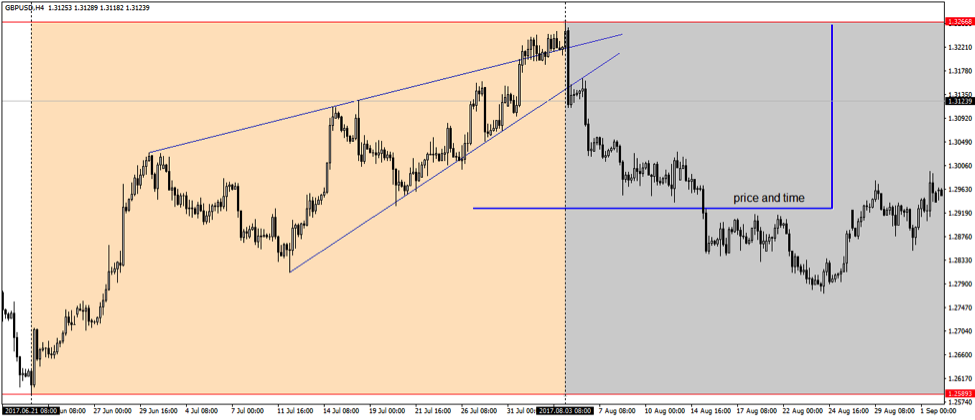
Connecting those series with a trendline gives the nature of a wedge. Here’s an example on the GBPUSD pair.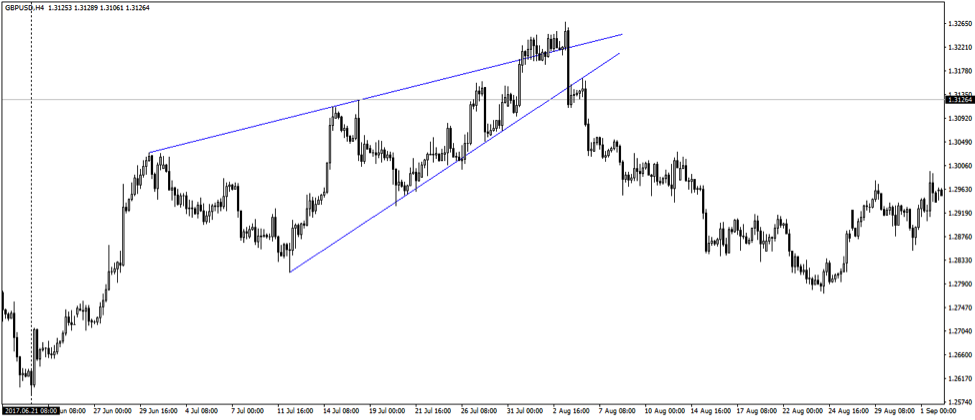
The pair advances but in doing that, it forms a series of higher highs and higher lows. Moreover, the higher highs are only marginal.
Connecting the points using two trendlines, the rising wedge becomes visible.
The focus shifts to the break of the lower trendline. Ideally, the price action to follow will retest the trendline, making it a perfect entry from a market geometry point of view.
In this case, it does, and that’s the entry on the short side.
When trading a wedge, the stop-loss is mandatory on the maximum (in the case of a rising wedge) or minimum (in the case of a falling wedge) point of the wedge.
How about the take profit?
This is where trading with price and time comes in.
Rules to Trade a Wedge
First, traders measure the time taken for the wedge to form. Next, they project that time on the right side of the chart from the moment the wedge ends.
Finally, the expected target is fifty percent retracement in less than half of the time it took the wedge to form.
Hence, price and time together come to limit the market’s possibilities after the pattern’s completion.
Thus, it keeps an objective and disciplined approach to trading.
As it turned out, the price broke lower and retested the trendline formed by connecting the higher lows.
Traders go short and usually place a stop-loss order at the top and a take profit at the fifty-percent retracement of the wedge.
But, the move MUST come in less than half the time it took to form the wedge.
If time expires and the price doesn’t reach the target, traders that use price and time together will just close the trade.
This is how trading with price and time keeps a disciplined approach to the market. Moreover, a simple look at the chart above tells us that the risk-reward ratio isn’t negligible at all.
Terminal Impulsive Waves Explained via the Price and Time Combination
Elliott couldn’t just ignore wedges. He found out that when they form, most of the times appear at the end of a bullish or bearish trend.
He named them terminal impulsive waves as they end an impulsive move. Hence, the logical place for such a pattern comes as the 5th wave of an impulsive wave.
Moreover, he documented the way the price behaves in a terminal pattern and concluded that only price and time together can confirm the pattern.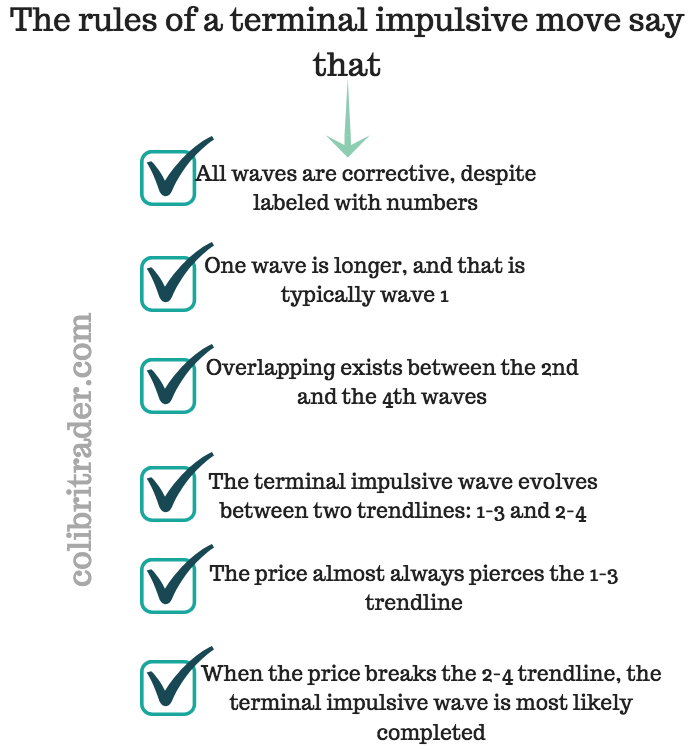
The rules of a terminal impulsive move say that:
- All waves are corrective, despite labeled with numbers
- One wave is longer, and that is typically wave 1
- Overlapping exists between the 2nd and the 4th waves
- The terminal impulsive wave evolves between two trendlines: 1-3 and 2-4
- The price almost always pierces the 1-3 trendline
- When the price breaks the 2-4 trendline, the terminal impulsive wave is most likely completed
But trading with price and time means setting the take profit considering them both. The Elliott rule for a terminal impulsive wave implies that the market will fully reverse the pattern in less than half of its time.
GBPUSD – Price and Time in a Wedge
Applying the rules to the same GBPUSD wedge from earlier, we see an interesting phenomenon. The price does break lower, but time doesn’t confirm the pattern.
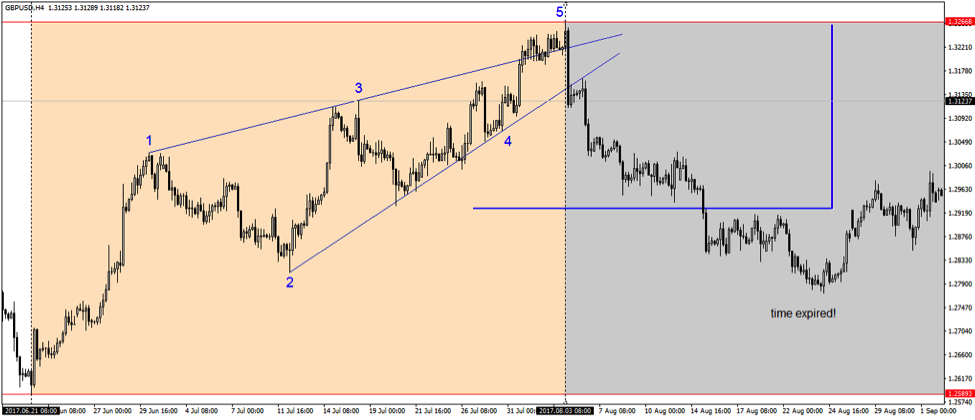
As it keeps moving lower, with every candlestick that passes, the time gets closer to expiration. In the end, it expires, but the terminal impulsive wave isn’t completely retraced.
At that moment, traders close the trade.
Important: It was time, not price, which forced traders to close the trade, as the Elliott rules of trading with price and time didn’t confirm the terminal impulsive move.
However, the trade ended in a profit. Remember the entry level?
When the price breaks the 2-4 trendline.
Coupled with the exit on the time expiration, the profit is even bigger than when using the standard interpretation of trading a wedge explained earlier.
Remember: The end result of trading with price and time tells us that this rising wedge isn’t a terminal impulsive move.
Hence, it isn’t the 5th wave of an impulsive wave. How can we check that? That’s easy: just have a look at the price action before the wedge’s formation.
As the chart below confirms, no five-wave structure is visible ahead of the wedge’s formation. Hence, no terminal impulsive wave in place!
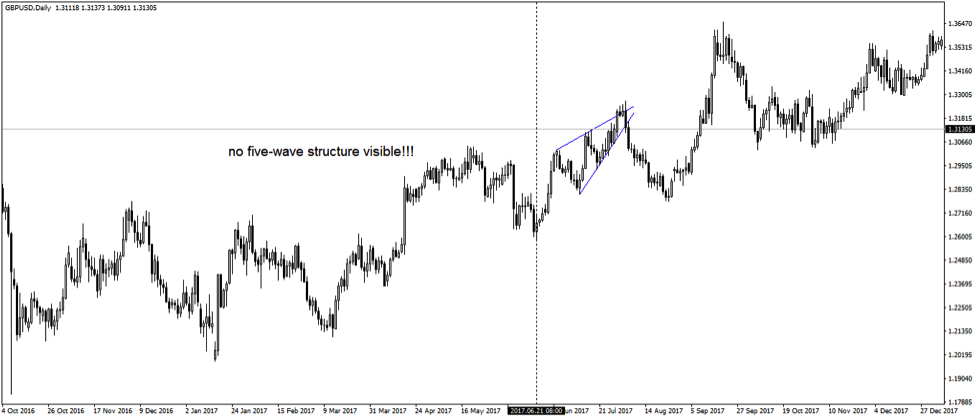
Moreover, as it turned out, the rising wedge didn’t even form at the end of a bullish trend, as classic

technical analysis tells us.
But this didn’t stop savvy traders to profit from the pattern. Trading it either as a classic wedge or as a terminal impulsive move part of the Elliott Waves Theory.
In both cases, the trades resulted in a profit only because trading with price and time means closing a trade only if the take profit comes in due time.
If time expires, traders close the trade as the pattern isn’t confirmed.
Conclusion
Trading with price and time adds another tool to a trader’s money management system. That, obviously, is the use of time as a deciding factor when setting up a trade.
Elliott’s approach of looking for time to confirm a pattern is wonderful. He used the same concept in many other situations that are part of his theory.
For instance, at one point in time, a trader needs to decide if a corrective wave is simple or complex. The only way to do that is if he/she uses the time element.
Namely, the move that follows the simple correction must respect some time constraints. Or, the price that follows the simple correction must respect time.
Hence, price and time together “seal” the pattern.
This article aimed to illustrate what can be done in technical analysis when trading with price and time. Moreover, the situations and concepts presented here do only give you a few examples.
Not all patterns allow the incorporation of the time element in an analysis. Perhaps because it is so difficult to tell when a move should come, technical traders have a hard time finding ways around using both price and time.
However, of the patterns and concepts that exist, the ones presented here (wedges and terminal impulsive waves) are wonderful ideas of how to blend the two for the perfect trade.
In one instance, as we showed in this article, the time didn’t confirm the pattern. Yet, the trade resulted in a profit, because trading with price and time forbids keeping a position open after time expires.
I’ll cover other patterns that use the price and time concepts in future articles. Until then, keep in mind that being right when trading implies knowing where the price goes and when. One without the other just doesn’t work.
Happy Trading,
Colibri Trader