


Trading With the Stochastic Indicator Like a Pro
Trading With the Stochastic Indicator Like a Pro
Perhaps one of the most underrated oscillators, Stochastic appears in the default indicators’ list of every trading platform. Trading with Stochastic shares the same rules of trading as any other oscillator. But, as you’re about to find out, it offers excellent opportunities for the disciplined trader.
The oscillator is nothing new in the technical analysis field. Developed by George Lane in the late ‘50s, it was used to interpret and analyse the stock market.
Contents in this article
- Trading with Stochastic – Describing the Oscillator
- Trading with Stochastic Using the Standard Interpretation
- Setting Up Proper Risk-Reward Ratios when Trading with Stochastic
- Divergences when Trading with Stochastic
- How to Adapt the Money Management System when Trading with Stochastic
- Looking for Reinforcements when Trading with Stochastic
- Trading with Stochastic on Lower Timeframes
- Keep an Eye on the Lower Highs Series
- Conclusion
Sixty years later, the same oscillator still serves similar purposes. Because financial markets evolved and new products appeared, the Stochastic indicator remains a reliable source of technical information.
Because of its formula, the Stochastic indicator works on any market, providing the same information. For this reason, Forex brokers offer it as a universal oscillator to use on all products offered (FX, crypto, CFDs, etc.).
When trading with Stochastic, all the rules of trading with an oscillator remain valid. Moreover, the Stochastic oscillator offers great risk-reward ratios if traders focus on its strengths and not weaknesses.
 In this article, we’ll treat trading with Stochastic to make a profit. Furthermore, we’ll look into finding risk-reward ratios that make sense. And, ratios that allow traders to profit from the Stochastic oscillator with not much of a hustle.
At the end of this article, you’ll wonder why Stochastic is such an underrated oscillator when it could provide great signals. As always, the answer lies in-between. It is the trader’s responsibility to build a strategy and to follow it religiously. And, only after a while, interpreting the results tells if the indicator is worth the trouble or not.
Let’s see if this indicator is worth your time…
Trading with Stochastic – Describing the Oscillator
Like any oscillator, Stochastic is displayed at the bottom of the main chart. In a separate, small window, the oscillator resides only in positive territory.
Trading with Stochastic, therefore, means interpreting the values of the two lines that form the oscillator, the %K and %D. It shows the relation between the current price and its range over a predefined period.
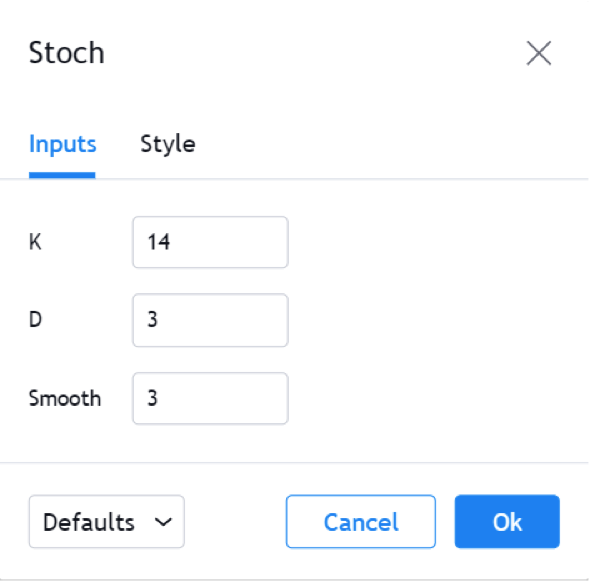
The default settings for the two lines (signal line and a slow-moving average) are 14 and 3, as Lane intended. The majority of trading platforms use this setup to this day.
Basically, the Stochastic oscillator finds a range between the highs and lows of a currency pair over a given period.
We won’t insist here on the formula used. That’s easy to find and not important when trading. Instead, we’ll focus on how you can utilise Stochastic in your trading.
When applied on a chart, trading with Stochastic means interpreting the two lines in the chart below: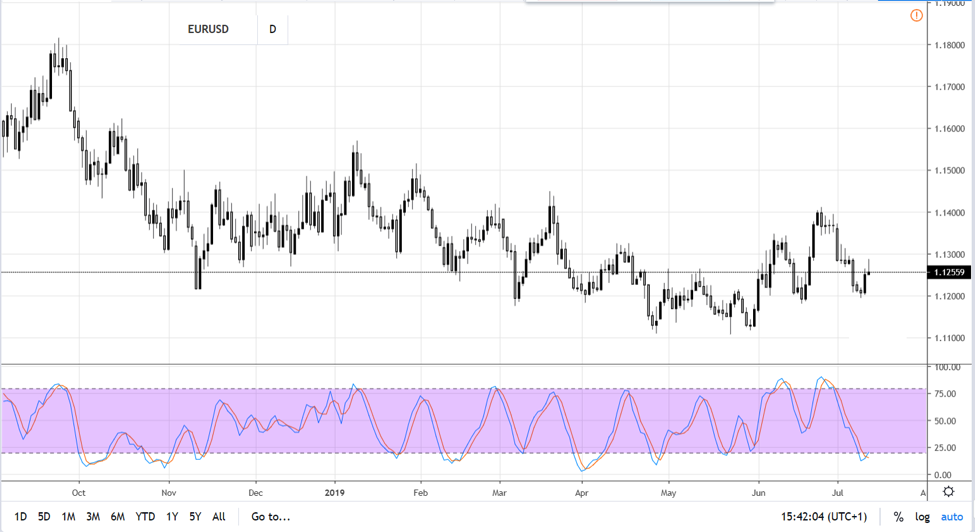
This is the daily EURUSD chart. The small window below the price chart shows the Stochastic oscillator with the settings mentioned earlier.
The highlighted area is the area where the price spends most of the time. Some traders call it a neutral or useless area. But, as you’ll see in this article, it does have some uses.
Above and below the area are values bigger and smaller than 80 and respectively 20. In other words, the classic overbought (>80) and oversold (<20) levels.
They act just like in the case of other similar oscillators. For instance, the RSI – Relative Strength Index also has overbought and oversold areas.
Naturally, a move below the 20 implies oversold conditions. That is where traders prepare to go long. Or, a move beyond 80 means overbought conditions. That is where traders get ready to sell.
Trading with Stochastic Using the Standard Interpretation
Trading with Stochastic implies interpreting two lines, not just one like in the case of the RSI. A signal line (%K) and a moving average of it (%D). Because of that, the Stochastic oscillator has a tremendous advantage over other indicators.
More precisely, it is more visible. It leaves no room for doubt.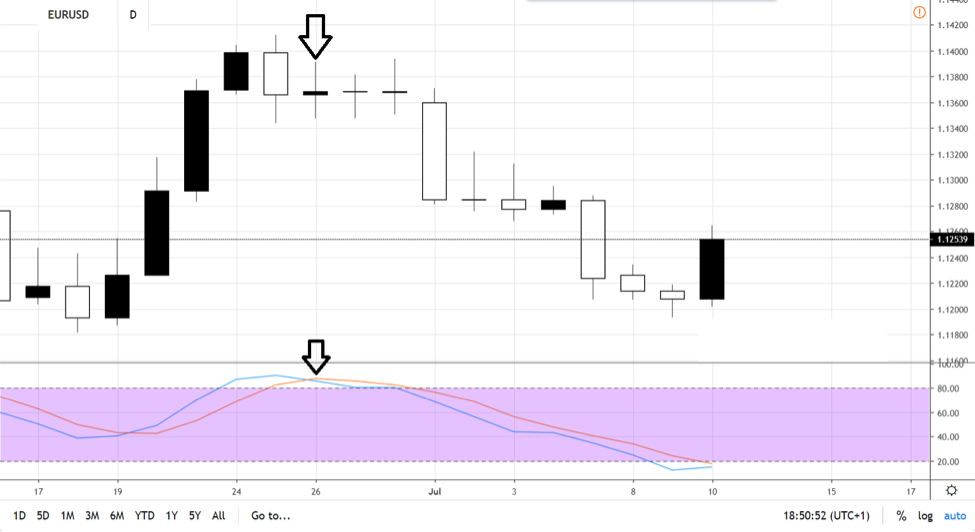
The EURUSD daily chart from above shows how the standard interpretation works. Trading with Stochastic using the standard interpretation means buying or selling below oversold and above overbought levels.
However, because a signal line exists, we should use. Therefore, only for the Stochastic oscillator to reach the overbought level is not enough.
Next, the signal line should cross below the %D line. That’s the “signal” to go short.
In the screenshot from above, when the blue line crosses below the red one, a signal appears.
Ideally, the cross between the two Stochastic lines forms beyond overbought and oversold levels. Namely, above the 80 and below the 20 levels.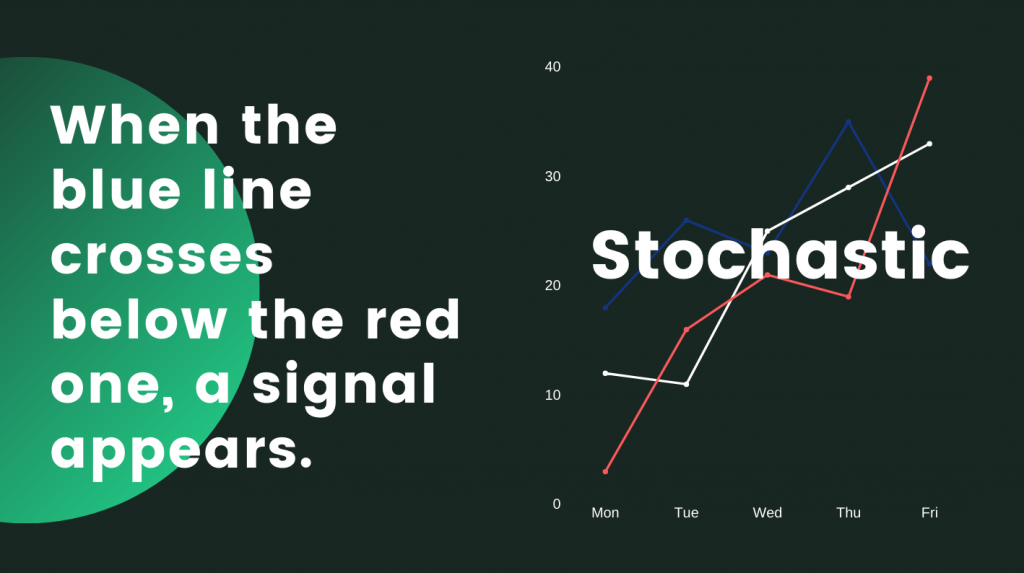
However, some traders use all the crosses and don’t focus only on one of the lines to reach the overbought or oversold levels.
The EURUSD example is a recent one. Because of the timeframe, it signalled the beginning of a new trend.
But trends do not form after each Stochastic cross. For this reason, the way to trade is always to consider a proper risk-reward ratio.
Setting Up Proper Risk-Reward Ratios when Trading with Stochastic
Here’s an exemplary setup. First, place the stop-loss above the highest point of the previous swing (when selling). Draw a line and mark the level. Or, simply place the cross-hair on the candlestick and see where the highest point is.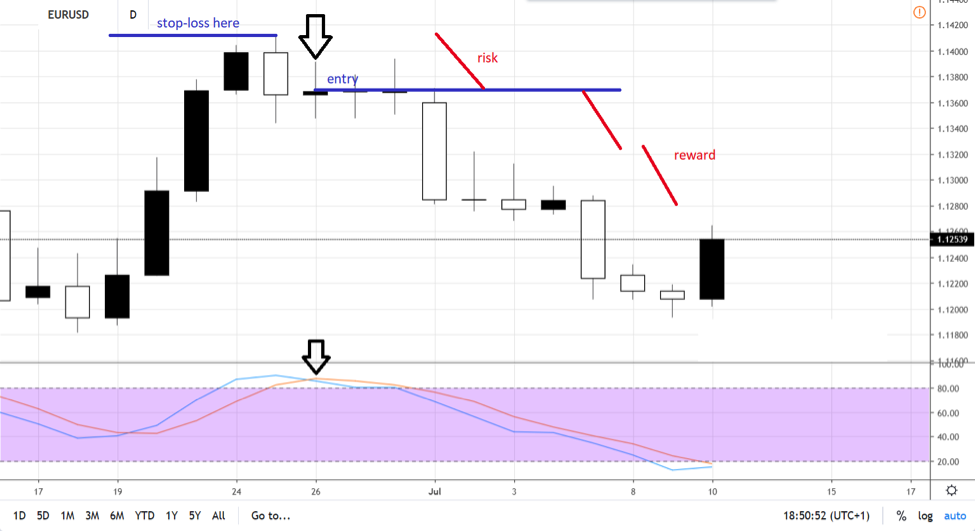
Second, enter at the close of the candlestick corresponding to the Stochastic signal. Make sure you wait for the candlestick’s close. Otherwise, the Stochastic signal may disappear.
Next, measure the risk for the trade. Easy stuff. Just calculate the difference between the entry point and the stop-loss.
Still, at this step, decide on the volume to trade. An essential money management rule says that risking more than one or two percent of the trading account on any given trade is not wise. At least, not for FX trading.
Therefore, set the volume according to the pips distance. Then, transform the value of a pip in such a way that the value of the pips risked doesn’t exceed one or two percent of the overall equity in the trading account.
Finally, set the right “reward” level. Always, but absolutely always, the reward MUST exceed the risk taken on a particular trade. The higher the ratio, the better.
For the currency market, 1:2 is a good starting risk-reward ratio. You’ll break-even by winning one and losing on two trades in the long-term. The key here is to constantly use the same or better rr ratios when trading with Stochastic. Or, with any other indicator or trading setup.
Divergences when Trading with Stochastic
A divergence appears when the price goes in one direction. And, the oscillator goes in a different direction.
The two, diverge. Simply put, they move in opposite directions.
Because the oscillator uses multiple periods to plot a value, traders put more trust in it. Thus, the price is the one to “lie.”
The things to keep an eye on are:
- Bullish divergence
- The price makes two consecutive lower lows
- The Stochastic oscillator doesn’t confirm the second low
- Bearish divergence
- The price makes two successive higher highs
- The Stochastic oscillator doesn’t confirm the second high
Straightforward, right?
Now let’s see an example.
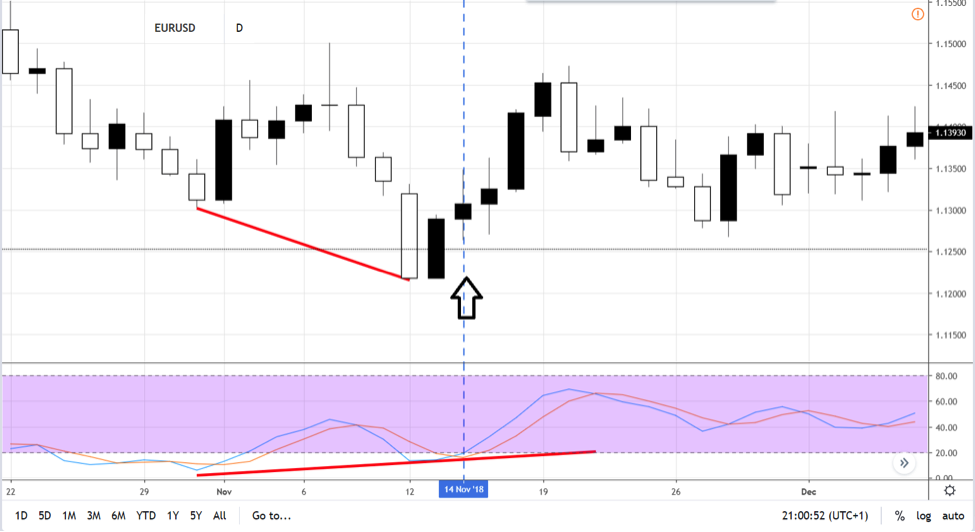
Check the chart above. It’s still the EURUSD daily timeframe.
The price falls, moving in a bearish trend. And, like in any bearish trend, it forms a series of lower lows.
However, the Stochastic oscillator doesn’t confirm the second lower low. Hence, a divergence between the price and the Stochastic oscillator appeared.
Hold your guns and don’t trade right away. First, wait for the candlestick to close. Second, wait for the Stochastic signal. Finally, enter at the close of the candlestick that corresponds to the Stochastic signal.
How about the money management rules? Using similar steps as the ones described earlier, this is how the trading setup looks like:
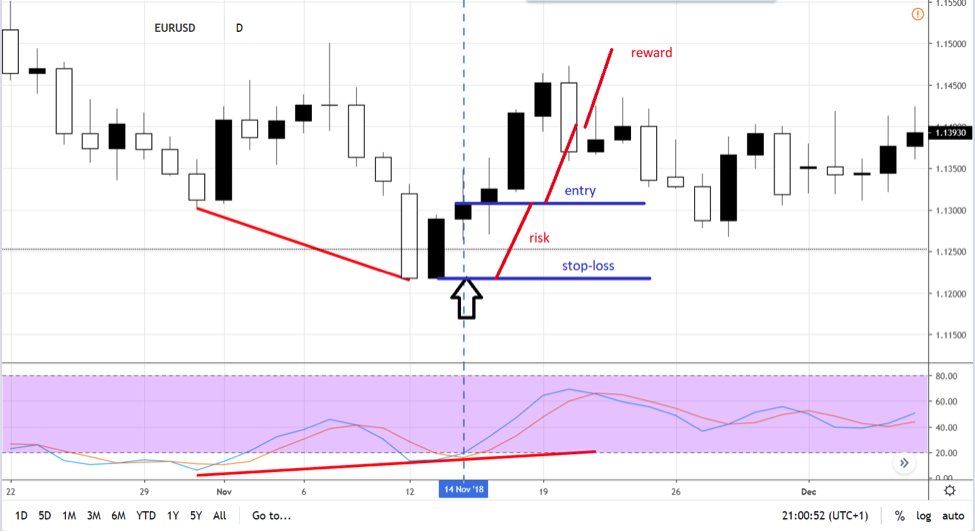
As you can see in the chart above, the price did move to the upside. The bullish divergence worked. However, it didn’t reach the “reward” level. As it is often the case, especially on bigger timeframes like this one (daily), the market sentiment changes on nothing at all.
How to Adapt the Money Management System when Trading with Stochastic
As it is often the case, the currency market spends time during consolidation periods. It means that the Forex market participants wait for the next sessions or sessions to see what next.
Therefore, even a risk-reward ratio like 1:2 is too big. That’s especially true when trading with Stochastic on bigger timeframes.
The examples used so far are from the daily EURUSD chart. The pair needs trending conditions on the lower timeframes to reach take-profit.
However, during summer, or around holidays, the price action stalls. Hence, waiting for the 1:2 rr ratio may prove useless.
Or, maybe the price will reach the take-profit level in the end, but other adjacent costs may affect the account. For instance, at the time of writing this article, trading the EURUSD on the long side pays a negative swap.
It’s quite expensive to keep a long position open on the EURUSD pair. The ECB (European Central Bank) holds the key interest rate into negative territory, thus affecting the interest rate differential.
Therefore, many traders decide to use a conservative approach when facing such conditions. A few steps are enough to protect the trading account. For example, you could consider the following scenario:
- First, wait for the price to reach 1:1. It means that you measure the risk and project it from the entry-level. Wait for the price to reach it.
- Second, book half the position at 1:1 and move the stop-loss for the remaining at break-even. As a result, the margin becomes available for new trading opportunities.
Looking for Reinforcements when Trading with Stochastic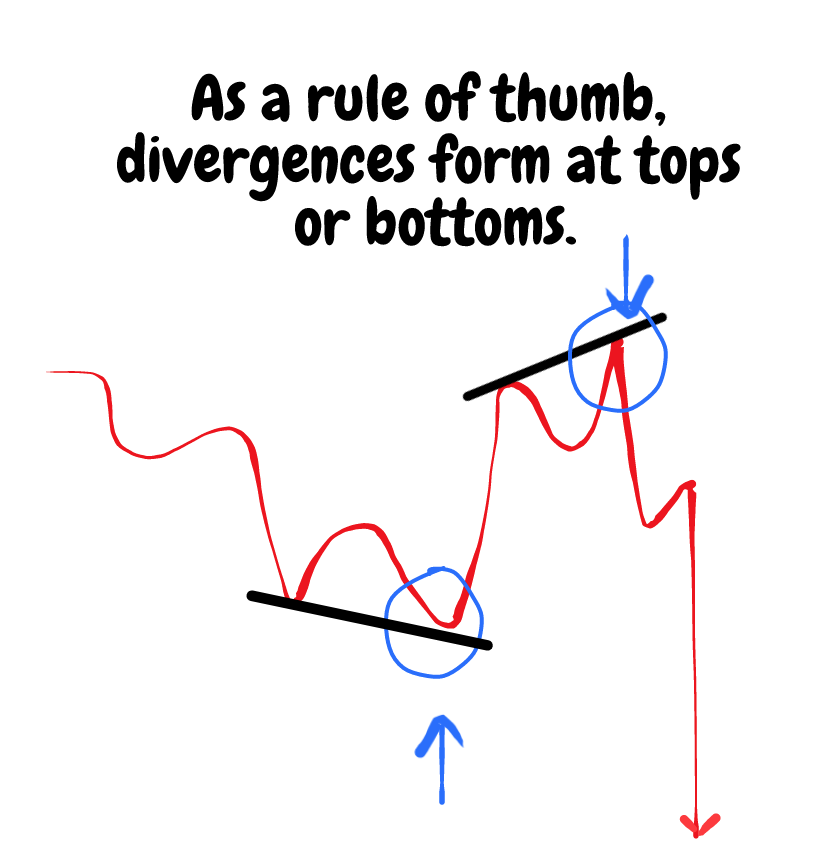
When trading divergences with Stochastic or with any other oscillator, it helps to have another signal pointing to the same direction. That’s a confirmation, and it acts as a reinforcement for the trading idea.
As a rule of thumb, divergences form at tops or bottoms. Therefore, it helps to look for reversal chart patterns. Ideally, reversal patterns that take as little time to form as possible.
Obviously, Japanese candlesticks pattern fit the bill. Most of these patterns are one, two, or three-candlesticks patterns.
In other words, when trading with Stochastic, it also helps to look for a Japanese reversal pattern. Look for a hammer, shooting star, piercing, engulfing, morning or evening stars, and so on.
Coming back to the EURUSD example used earlier, we see that a piercing pattern follows right after the bullish divergence. As a reminder, the piercing is a bullish pattern that:
- has two candlesticks
- the second candlestick closes into the previous candlestick’s territory, exceeding 50% retracement but no more than 100%
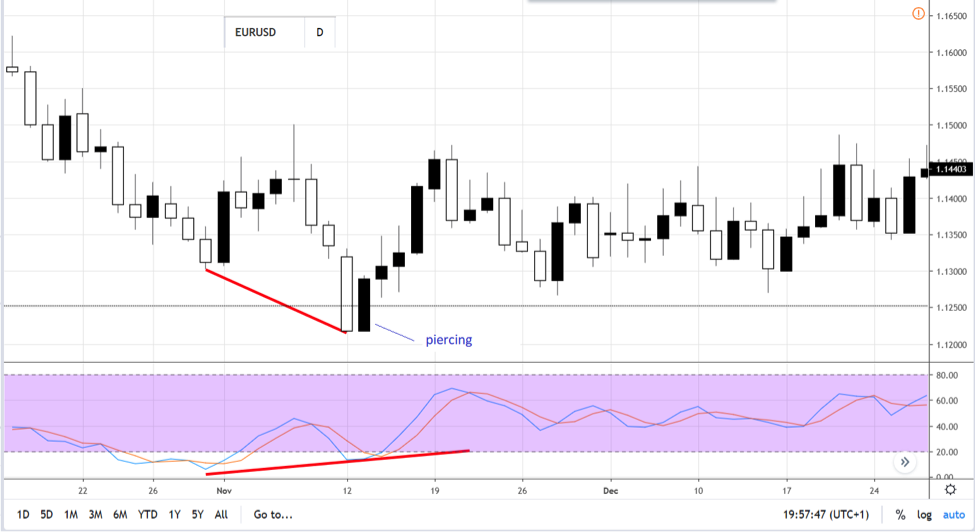
The piercing pattern only comes to reinforce the bullish setup on the EURUSD pair. It is no wonder that the price continued to the upside for the next consecutive four trading days.
Trading with Stochastic on Lower Timeframes
Some retail traders wonder if the Stochastic oscillator is of any use on the lower timeframes.
It could be!
The thing is that most retail traders like scalping. Going in and out of the market for a quick profit makes sense as it avoids emotions and costs of keeping a trade open overnight.
The following strategy shows how trading with Stochastic as a trend indicator works. In fact, it is a combination of different factors that lead to it.
At the core of this strategy stands a new level we must define. That is the middle of the Stochastic range.
If the overbought and oversold levels are 80 and 20, the middle value is 50. Let’s put it on a chart, this time on the EURUSD five-minute timeframe. It works as well as any other currency pair when trading with Stochastic in the direction of the underlying trend.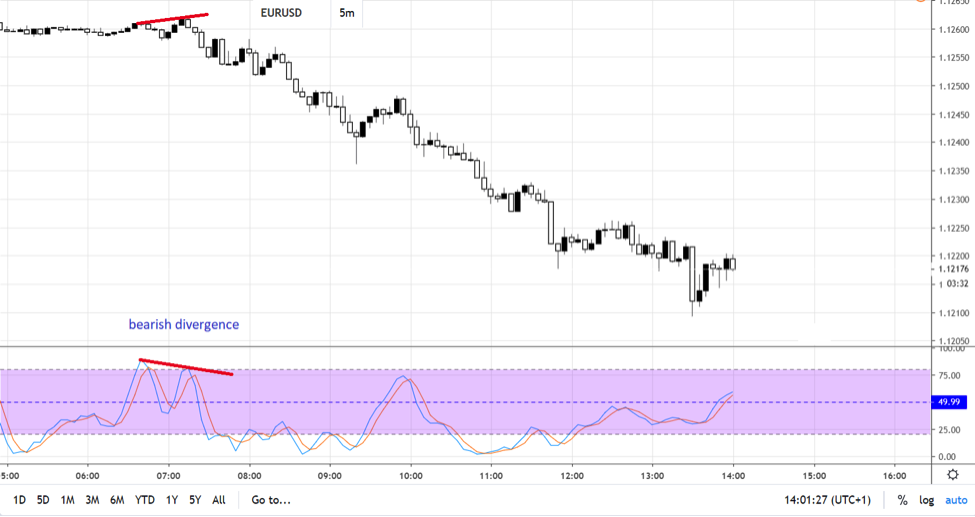
A bearish divergence formed on the EURUSD five-minute chart. The Stochastic oscillator didn’t confirm the second higher high the price made. Hence, there’s a bearish bias for the scalper.
The next thing to do is to wait for the Stochastic oscillator to move below the 50 level. That’s the entry point, always having a stop-loss at the highest point in the bearish divergence.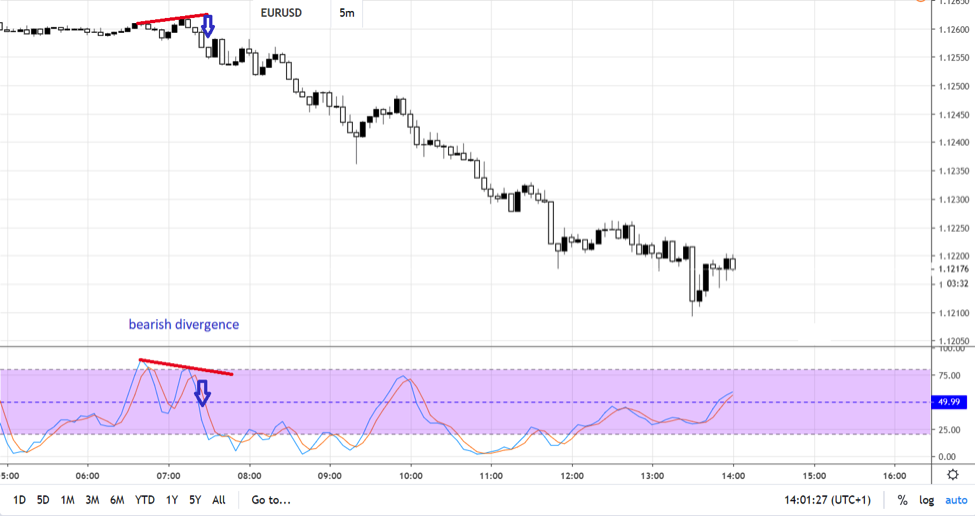
How about the target? Because we use the Stochastic indicator to ride a trend, we don’t know the trend’s strength.
Therefore, the exit isn’t given by a risk-reward ratio. Instead, we merely keep an eye for the oscillator to cross the 50 level in the opposite direction.
Keep an Eye on the Lower Highs Series
In a bearish trend, the lower highs and lower lows series are decisive. In this case, the EURUSD pair bounced.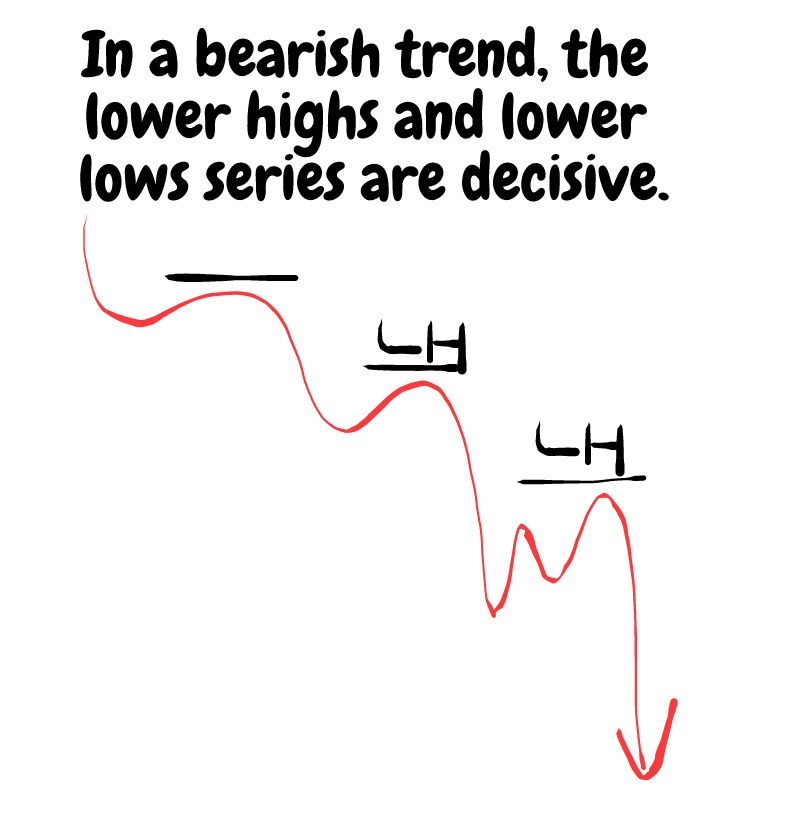
Next, the Stochastic indicator moved above the 50 mark. That’s the exit from the previous short trade.
However, while it did cross above the 50, it failed to break the lower highs series. The bearish trend remains in place.
Therefore, all we have to do is to wait for the Stochastic oscillator to turn. Next, have a little patience for it to cross the 50 level again. This time one the downside.
Finally, go short on the crossing of the 50 level, placing a stop-loss at the previous lower high. That’s the level to invalidate the bearish trend. If not broken, the market will keep doing the same thing over and over again.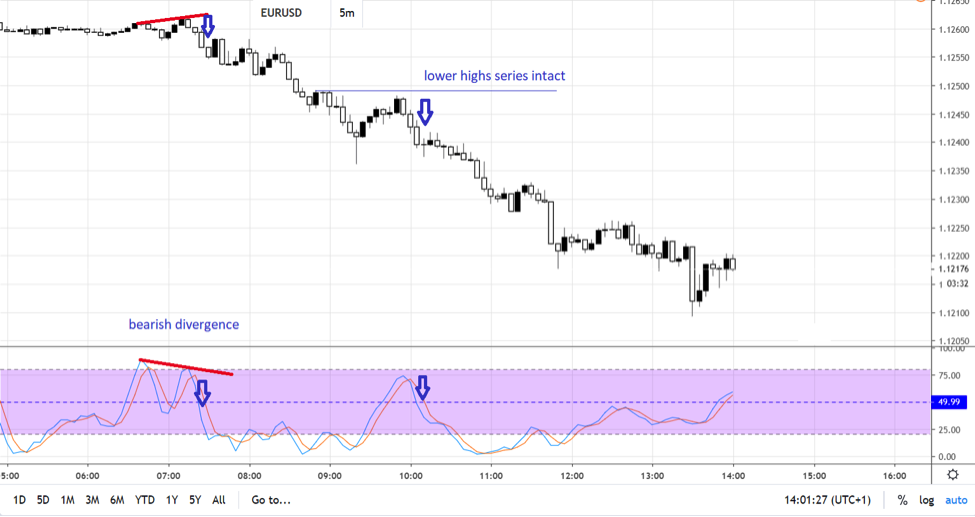
So now we have the second short trade, the entry, and the stop-loss. The exit, as mentioned earlier, is given by the Stochastic oscillator crossing the 50 level to the upside. It just did, as the chart below shows.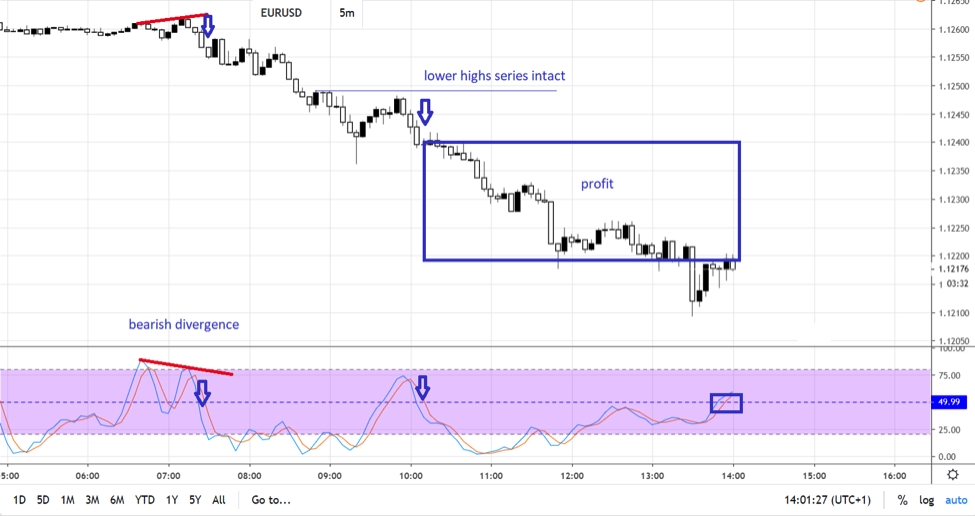
The blue square shows the profit. If we compare the risk (i.e., the difference between the entry and stop-loss levels) to the reward, the resulting risk-reward ratio exceeds 1:2 easily.
Conclusion
Trading with Stochastic follows the same path as trading with any other oscillator. That’s especially true if we think of the overbought and oversold levels and its standard interpretation: selling overbought and buying oversold.
Divergences also work with the Stochastic oscillator. Throughout this article, we presented both a bullish and bearish divergences, on longer and shorter timeframes.
Trading with Stochastic also works when used as a trend indicator. Oscillators that travel between overbought and oversold levels offer the possibility to profit when they cross the middle level.
For the Stochastic oscillator, the 50 value marks the level. Still, the 50 mark works well for another famous oscillator, the RSI. Finally, the 0 level on the MACD serves the same purpose.
But this article also focused on the importance of money management. Any trading setup doesn’t make sense without sound money management rules.
Managing the risk is paramount for a trading account. The right and normal way is for the account to grow as a sum of both losing and winning trades.
However, the winning ones must exceed both the size (particularly) and the number of the losing ones. This way, the trader embraces losses (which is absolutely normal) but focuses on the winning trades more.
Trading with Stochastic proves, once more, that discipline works in technical analysis. The most significant advantage when trading with Stochastic or with a technical indicator is that it smoothes out the emotional roller-coaster from a trader’s mind.
P.S.
Have you checked my other article on the Stochastic indicator?
notify me
Regarding what?