


Trading With Market Geometry- 5 Ways to Trade with Market Geometry
Trading With Market Geometry- 5 Ways to Trade with Market Geometry
Trading with market geometry has been fascinating traders ever since financial markets exist. In fact, the reason we’re here talking about technical analysis, patterns, trading principles, and theories, etc., belongs to market geometry.
Nowadays, trading with market geometry means mastering technical analysis.
Traders noted that the price (United States stock market was the “playground” for early technical analysis concepts) follows some patterns. Like humankind has a saying that “history repeats itself,” why not applying the same principle when trading financial markets?
Click Here to Get Your Market Geometry E-Book
This is how patterns were born. Traders documented the price action at market turns, and so they discovered reversal patterns.
From head and shoulders to rising and falling wedges, Japanese candlesticks to double and triple tops and bottoms, all represent patterns that reverse a trend. Others are simply continuation patterns, merely showing the price building energy before the trend resumes.

Market Geometry and Time
They all have something in common: time. While the focus is on price (forecasting future prices to profit from the market move), the decisive element is time. Or, it should be.
Price and time is an exciting concept in technical analysis. Not only that it tells where the market goes, but also when!
Think of planning a trip to, say, London, to visit your relatives. You know the destination, but you also know the timing as you plan the trip.
The same is in technical analysis. Some patterns show the direction (the destination), but how about the time when the price is supposed to reach the target?
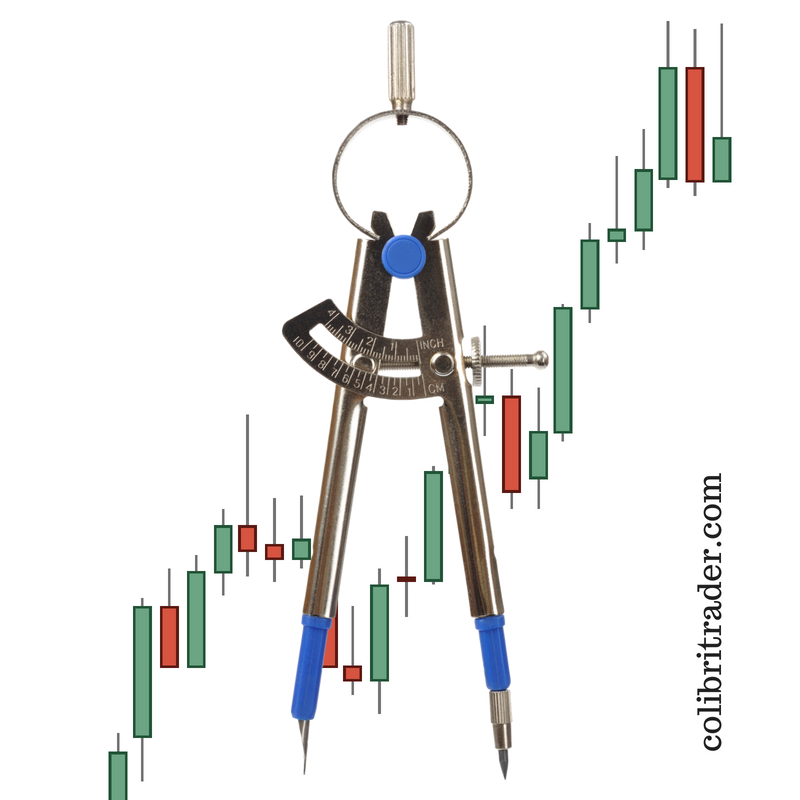
When trading with market geometry concepts, traders combine both price and time. While a sophisticated idea, when using price and time one is close to mastering trading.
For the passionate trader, no effort is too big for the perfect trade. But the perfect trade is closer when trading with market geometry principles that use price and time.
Trading with Market Geometry Price Action Principles
As you’ve already noticed, the key to market geometry is price and time. This article aims to show both simple and complex ways of trading with market geometry concepts.
Among other, we’ll cover:
- using market geometry to find support and resistance levels
- price and time with classic technical analysis patterns
- Elliott Waves trading with market geometry
- Fibonacci ratios in market geometry trading
- psychological levels when trading with market geometry
- D. Gann as the father of price and time
 But above all, we’ll aim at how trading with market geometry principles improves trading considerable. And that comes from the simple fact that most of the tactics shown here use both price and time in a forecast.
Trading with market geometry principles is like believing things happen for a reason. A trader must have an open mind and eye too.
On top of that, a trader must imagine things beyond logic sometimes. Don’t ask how, but why. Don’t say it’s impossible, but what if?
Are you that type of trader?
Price Action When Trading with Market Geometry
Price action or the ability to trade with a naked chart (naked trading) is our starting point in this market geometry journey. Have a look at the AUDUSD chart below.
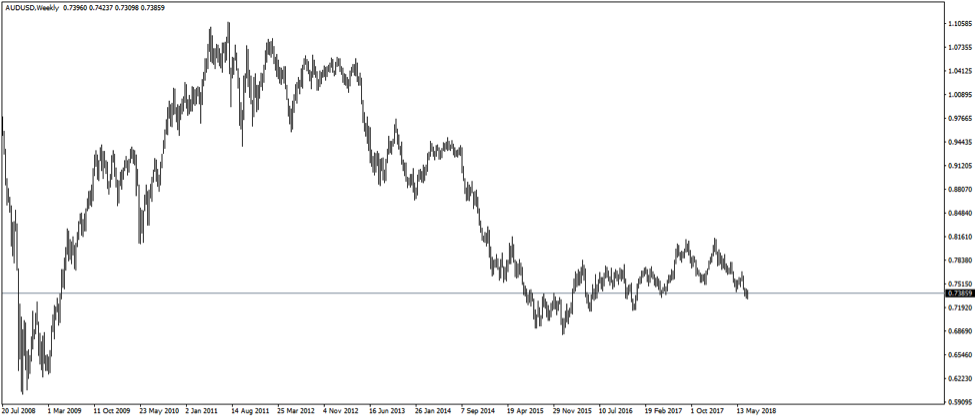
It shows the price action on one of the most popular trading pairs for the last ten years (2008 – 2018). At first glance, a naked chart like this tells nothing.
However, the technical trader uses market geometry to find support and resistance levels. This simple concept projects horizontal support and resistance on the right side of the chart.
From left to right, we see the market rising aggressively. At one time, it forms a double top confirmed but future price action.
It turned out to be a fake reversal. Bulls came back with a vengeance and the market made new highs.
Despite the fact that the price broke higher, that area is here to stay. Trading with market geometry means focusing on the smallest details to find technical clues.
In this case, that’s a resistance area. Because the price managed to break through, resistance turned into support. That’s previous info to take and project on the right side of the chart.
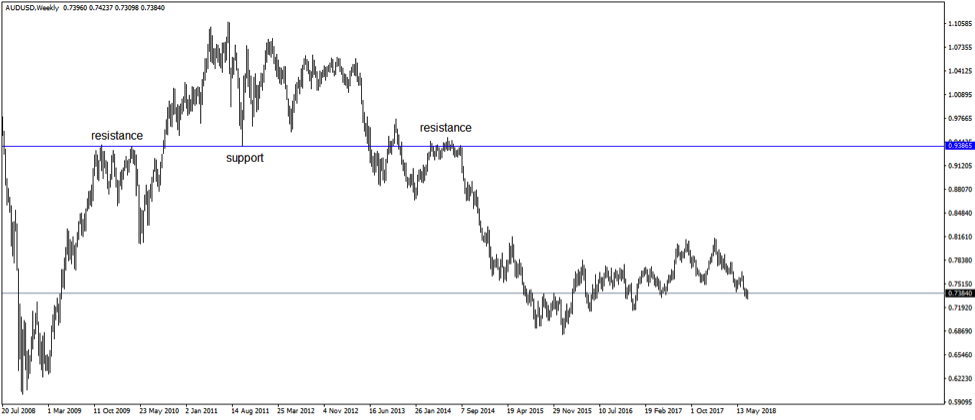
That double top formed in 2009. Trading with market geometry implies projecting future levels.
Hence, marking the double top with a horizontal line should project future support and resistance levels. Oh, and it did!
One year later, the area proved a strong support when the AUDUSD pair fell out of bed. Moreover, in 2014, or five years later, support turned into resistance again.
Geometry in Trading – Projecting Levels
Such simple geometric principles are enough to keep a trader on the right side of the market. No one says to trade the weekly timeframe. It’s too big.
However, knowing that the market is at strong support or resistance on such a big timeframe, helps to position on the right side of the market on lower ones.
For instance, if the AUDUSD is at potential support, traders would gladly consider bullish reversal patterns forming on lower timeframes (daily, 4h and even hourly).
The pair eventually broke lower. The RBA (Reserve Bank of Australia) started an easing cycle stimulated by the Fed in the United States running various quantitative easing programs.
Was there a way to project levels when trading with market geometry price action principles? The answer is YES.
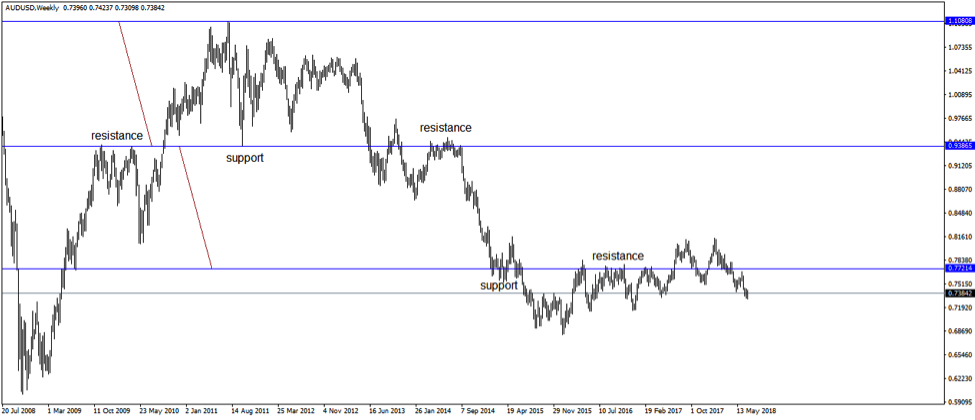
Traders simply project the distance from the top to the primary support and resistance described earlier. Fascinating enough, the resulting level proved to be key for trading the AUDUSD in the last three years.
For the trader able to build this kind of technical analysis, the market geometry is incomplete. What is technical analysis trading if we don’t prepare for potential essential areas on a chart?
Trading with market geometry price action principles ends with projecting the next level.
Remember?
What if?
What if the market keeps dropping? Is there a level where it might find support?
Funny enough, it is, and it coincides with the previous major bottom a decade ago.
Psychological Levels when Trading with Market Geometry
Another simple market geometry concepts relates to human nature. As people, we find it more comfortable to use round numbers in trading.
Remember: When setting stops or targets, traders often use round levels.
Don’t ask why just have a look at any trader’s journal, and you’ll see that this is a recurring phenomena.
In Forex trading, no level is more important than parity. That is when the two currencies that make the pair are equal in value.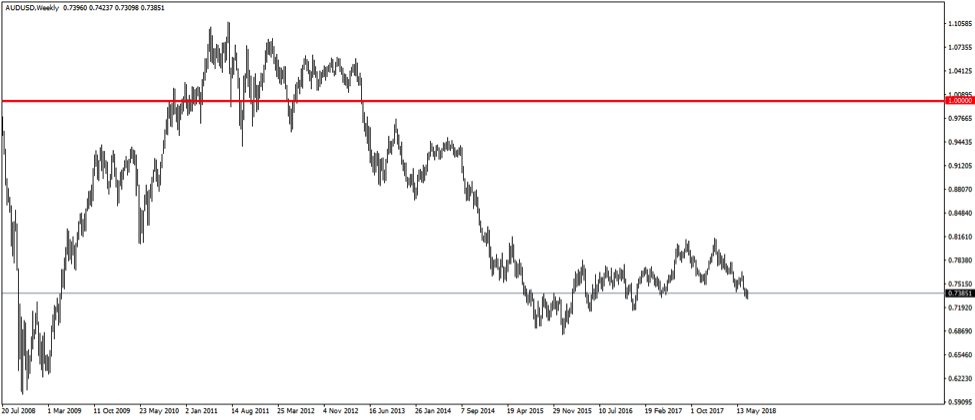
The red line shows the parity level on the AUDUSD pair. The market bounced and, while piercing above parity, it formed a reversal pattern (triangle) and broke lower.
Many currency pairs trade around parity (e.g., AUDNZD, USDCHF). But, few traders use the parity concept together with the most critical Fibonacci level: the golden ratio.

The golden ratio or the 61.8% level has many applications in technical analysis. Entire theories, like the Elliott Waves Theory, are built based on it.
It is only normal to use it when trading with market geometry. What is the 61.8% level between zero and one? You nailed it: 0.618.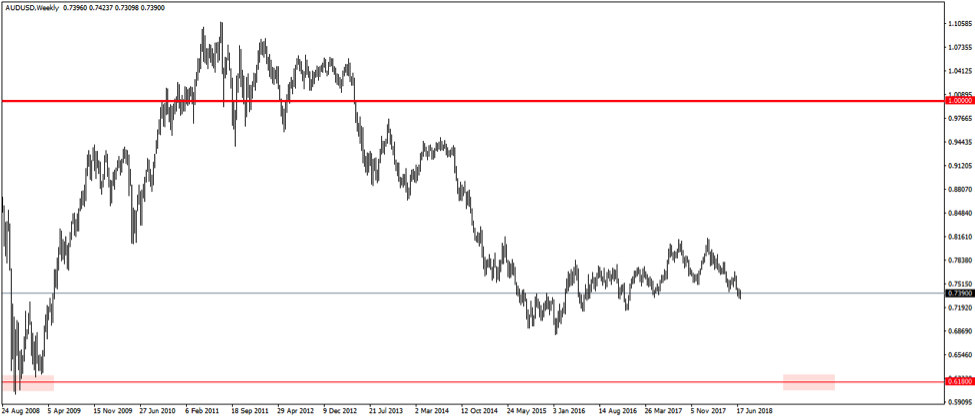
Now compare the chart above with the last one from trading with market geometry price action principles. Is it just a coincidence or market geometry tells us something?
Trading with Market Geometry – Price and Time
During years, many technical traders struggled to find the holy grail in trading. Its definition is price and time. Or, knowing where the market goes and when.
Obviously, this is the most difficult technical analysis concept. Mastering it leads to discipline in trading.
W.D. Gann is the father of the price and time concept. He firmly believed that everything moves for a reason.
 He also famously made a public statement calling for the price of a specific stock to reach a certain level at an exact day. The legend says he was right!
Gann trading is not the subject of this article. However, if we are to connect price and time, we needed to at least mention him and some of the concepts here made famous, like the 1×1 line or the Gann square.
Time is used to confirm patterns. And that, in market geometry analysis, is an important concept.
In other words, traders exit and enter a trade not simply for the reason that price reached a level. But also, for instance, because time expired.
Namely, the price and time principle when trading with market geometry requires the price to reach the target in a defined period. When time expires, and the price didn’t reach it, traders merely close the position.
Hence, savvy traders use time too in their analysis. Moreover, as we’ll show here, closing a trade because of time expiry, doesn’t necessarily mean the trade ends with a loss.
Market Geometry with Classic Technical Analysis Patterns
Every trader knows the head and shoulders pattern. If you are here and this article makes sense for you, you must know how the head and shoulders pattern looks like and how to interpret it.
It resembles the human body and has:
- two shoulders (consolidation areas)
- a head (a spike higher)
- a neckline
- one measured move
Quick question: where do you think most traders focus on?
Hint: it’s not time, apparently.
Well, the focus sits with the measured move, as it gives a target for the trade, after the neckline breaks. In Forex trading head and shoulders are ugly patterns.
Don’t expect them to appear like in textbook materials for the simple reason that the market swings violently due to the high-volatility environment. A head and shoulders pattern commonly on the FX market looks like below: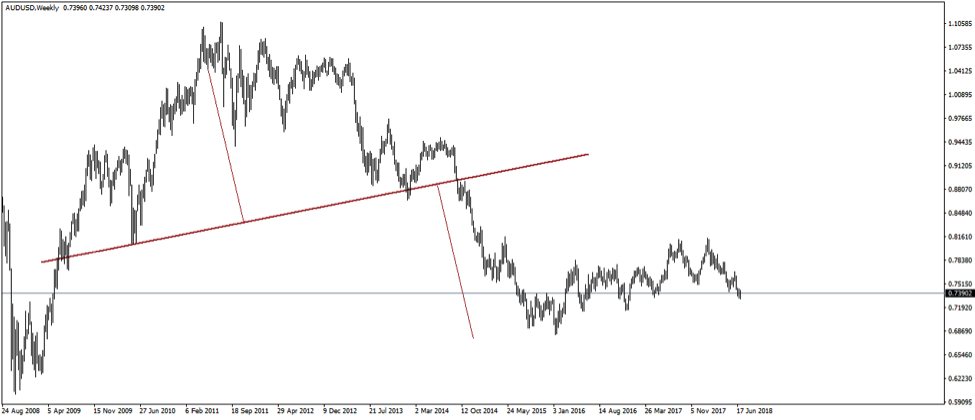
Yes, that’s the same AUDUSD weekly timeframe. The measured move projected from the neckline gives the price target. That’s where the focus with more traders is.
But that’s only after the fact. Namely, after the price breaks the neckline.
The focus, instead, should be on the two consolidation areas. Or, the two shoulders.
Geometry in Trading the Head and Shoulders
Price and time when trading with market geometry is a concept that requires experience. The head and shoulders pattern is perfect for illustrating the price and time concept.
When the market rises, nothing indicates the reversal pattern to come. If anything, the consolidation area on the left shoulder is interpreted as a continuation pattern.
However, by the time the head reverses, savvy traders suspect the head and shoulders formation. And, they prepare to trade it accordingly.
According to market geometry principles, they’ll use not only the price levels but also time. Namely, traders will use info from the left shoulder and project it on the right one. One of that info is time.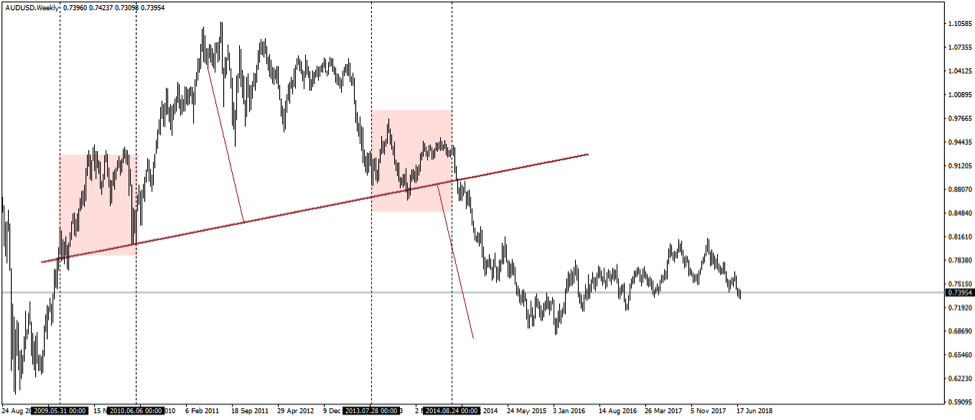
They just measure the time taken for the price to consolidate on the left shoulder. Next, traders project the time for the right shoulder’s consolation. The neckline’s break should come in about the same amount of time.
How about the price? The way to deal with price is to copy the neckline and project it from the top of the left shoulder.
Next, use a Fibonacci retracement tool to find out main Fibonacci levels (38.2%, 61.8%, etc.). Those are entry levels for the aggressive traders. The closer the time is about to expire before the break, the more aggressive trading becomes. No signs of a breakout after time expires? Traders simply exit the short positions.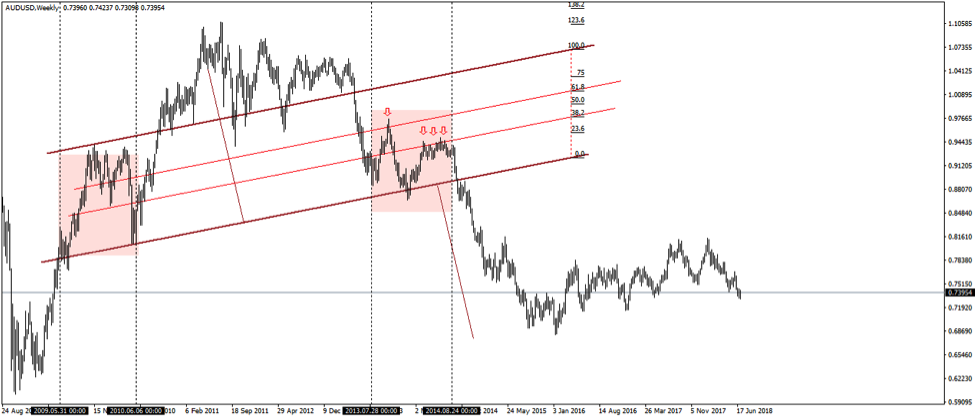
The chart above shows why trading with market geometry price and time principles makes sense.
Shorts intensified the pressure as the consolidation time on the right shoulder was about to expire. As it turned out, trading with market geometry proved to be quite something, as it gave great entries.
Trading with Market Geometry Using the Elliott Waves Theory
Elliott loved the price and time principle.
Important: Few traders know that if there is one thing that connects all the Elliott Waves rules, that’s time, and not price.
There are many places in the theory where time plays a crucial role. For instance, the entire Elliott Waves Theory deals with interpreting or labeling impulsive and corrective waves.
Time appears in both impulsive and corrective structures. As a quick reminder, the Elliott Waves Theory uses numbers to count impulsive waves and letters for corrective waves.
In impulsive structures, one rule is vital when labeling them. So-called the equality rule, it refers to both price and time to be respected.
Such market geometry is difficult to find in any financial product, not to mention when trading a currency pair. Yet, it is what makes the right Elliott Wave count possible and what differentiates wrong labeling from correct labeling.
Click Here to Get Your Market Geometry E-Book
Here are some of the instances when trading with market geometry is used in the Elliott Waves Theory:
- the 2-4 trendline of an impulsive move must be broken in less than the time it took the 5th wave to form
- the 5th and the 1st wave in a 3rd wave extension impulsive move relate both in price and time; they are equal or relate to 61.8% both in price and time
- in a zigzag, waves a and c take a similar time to form
We won’t illustrate any of them here. Instead, we’ll use the most common setup with the Elliott Theory: trading the b-d trendline of a contracting triangle.
B-D Trendline – Key Market Geometry When Trading Triangles
A triangle is the most common way for the market to consume time. If there’s any pattern likely to form during price consolidation, that’s a triangle.
We already mentioned that the AUDUSD price reversed from a triangular pattern. Here it is: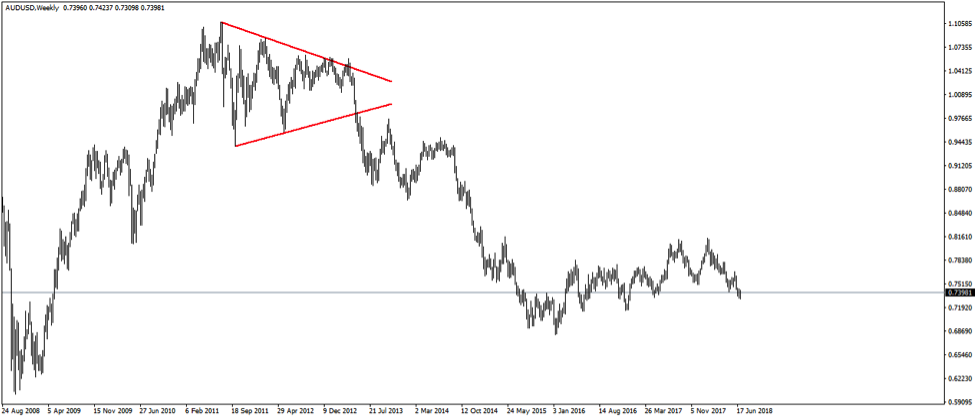
But it tells us nothing unless we find a way to interpret as Elliott wanted.
According to Elliott, a triangle is a corrective pattern. Hence, we should use letters to label it.
However, only labeling is not enough.
Important: Market geometry in a triangular formation calls for the price to break the b-d trendline in less than the time it took the e-wave to form.
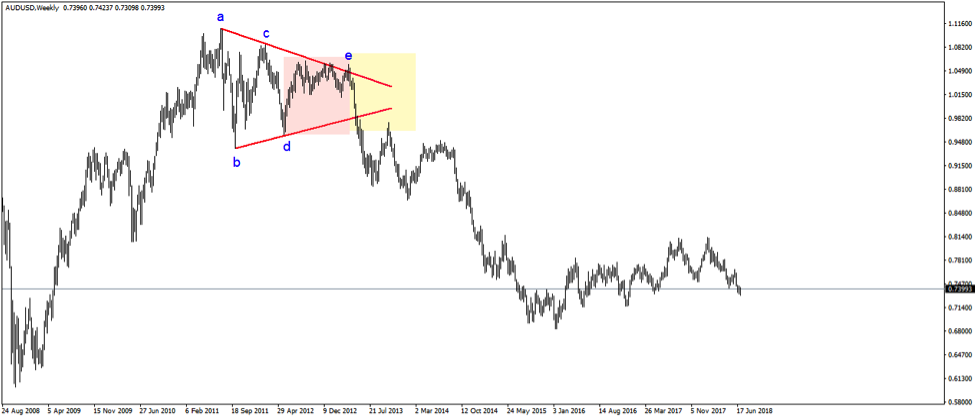
All triangles must respect this basic rule. If not, the pattern is not a triangle.
So, what, many of you will say. Well, that’s key in knowing when to start the count with the Elliott Theory.
If both price and time validate the triangle, the end of the previous wave coincides with the end of the triangle.
NOT with the absolute top!
Conclusion
Trading with market geometry respects beautiful concepts from all kind of trading theories and not only. Starting with simple principles and moving into more details, market geometry reveals a world of discipline given by both price and time.
Many trading theories and concepts use market geometry principles. From pure price action to Elliott Waves Theory, from Gann to simple pattern recognition, they all aim to forecast the right price.
In technical analysis, it is said that “the devil is in the details”. That’s so true as small details make the difference between the right and the wrong technical setups.
The art of speculation in financial markets blends flair with knowledge. While flair can’t be taught, knowledge can. And, if there’s any one thing to master, that’s trading with market geometry.
Check out my professional traders’ programme or watch an extract below:
p.s.
If you have not done so, get your free copy of the Market Geometry E-Book
It’s a excillent post.Thanks.
Thanks Zahid!
hi- love market geometry-
i am trying to find a coder for NT 8 that has experience w/ geometry. if u can assist thaat would be great.
thxs kaymicalo@gmail.com
Hi Kay, unfortunately this is outside my scope. If you have any other trading related questions, please let me know