


The Way I See Support and Resistance in These 3 Currency Pairs
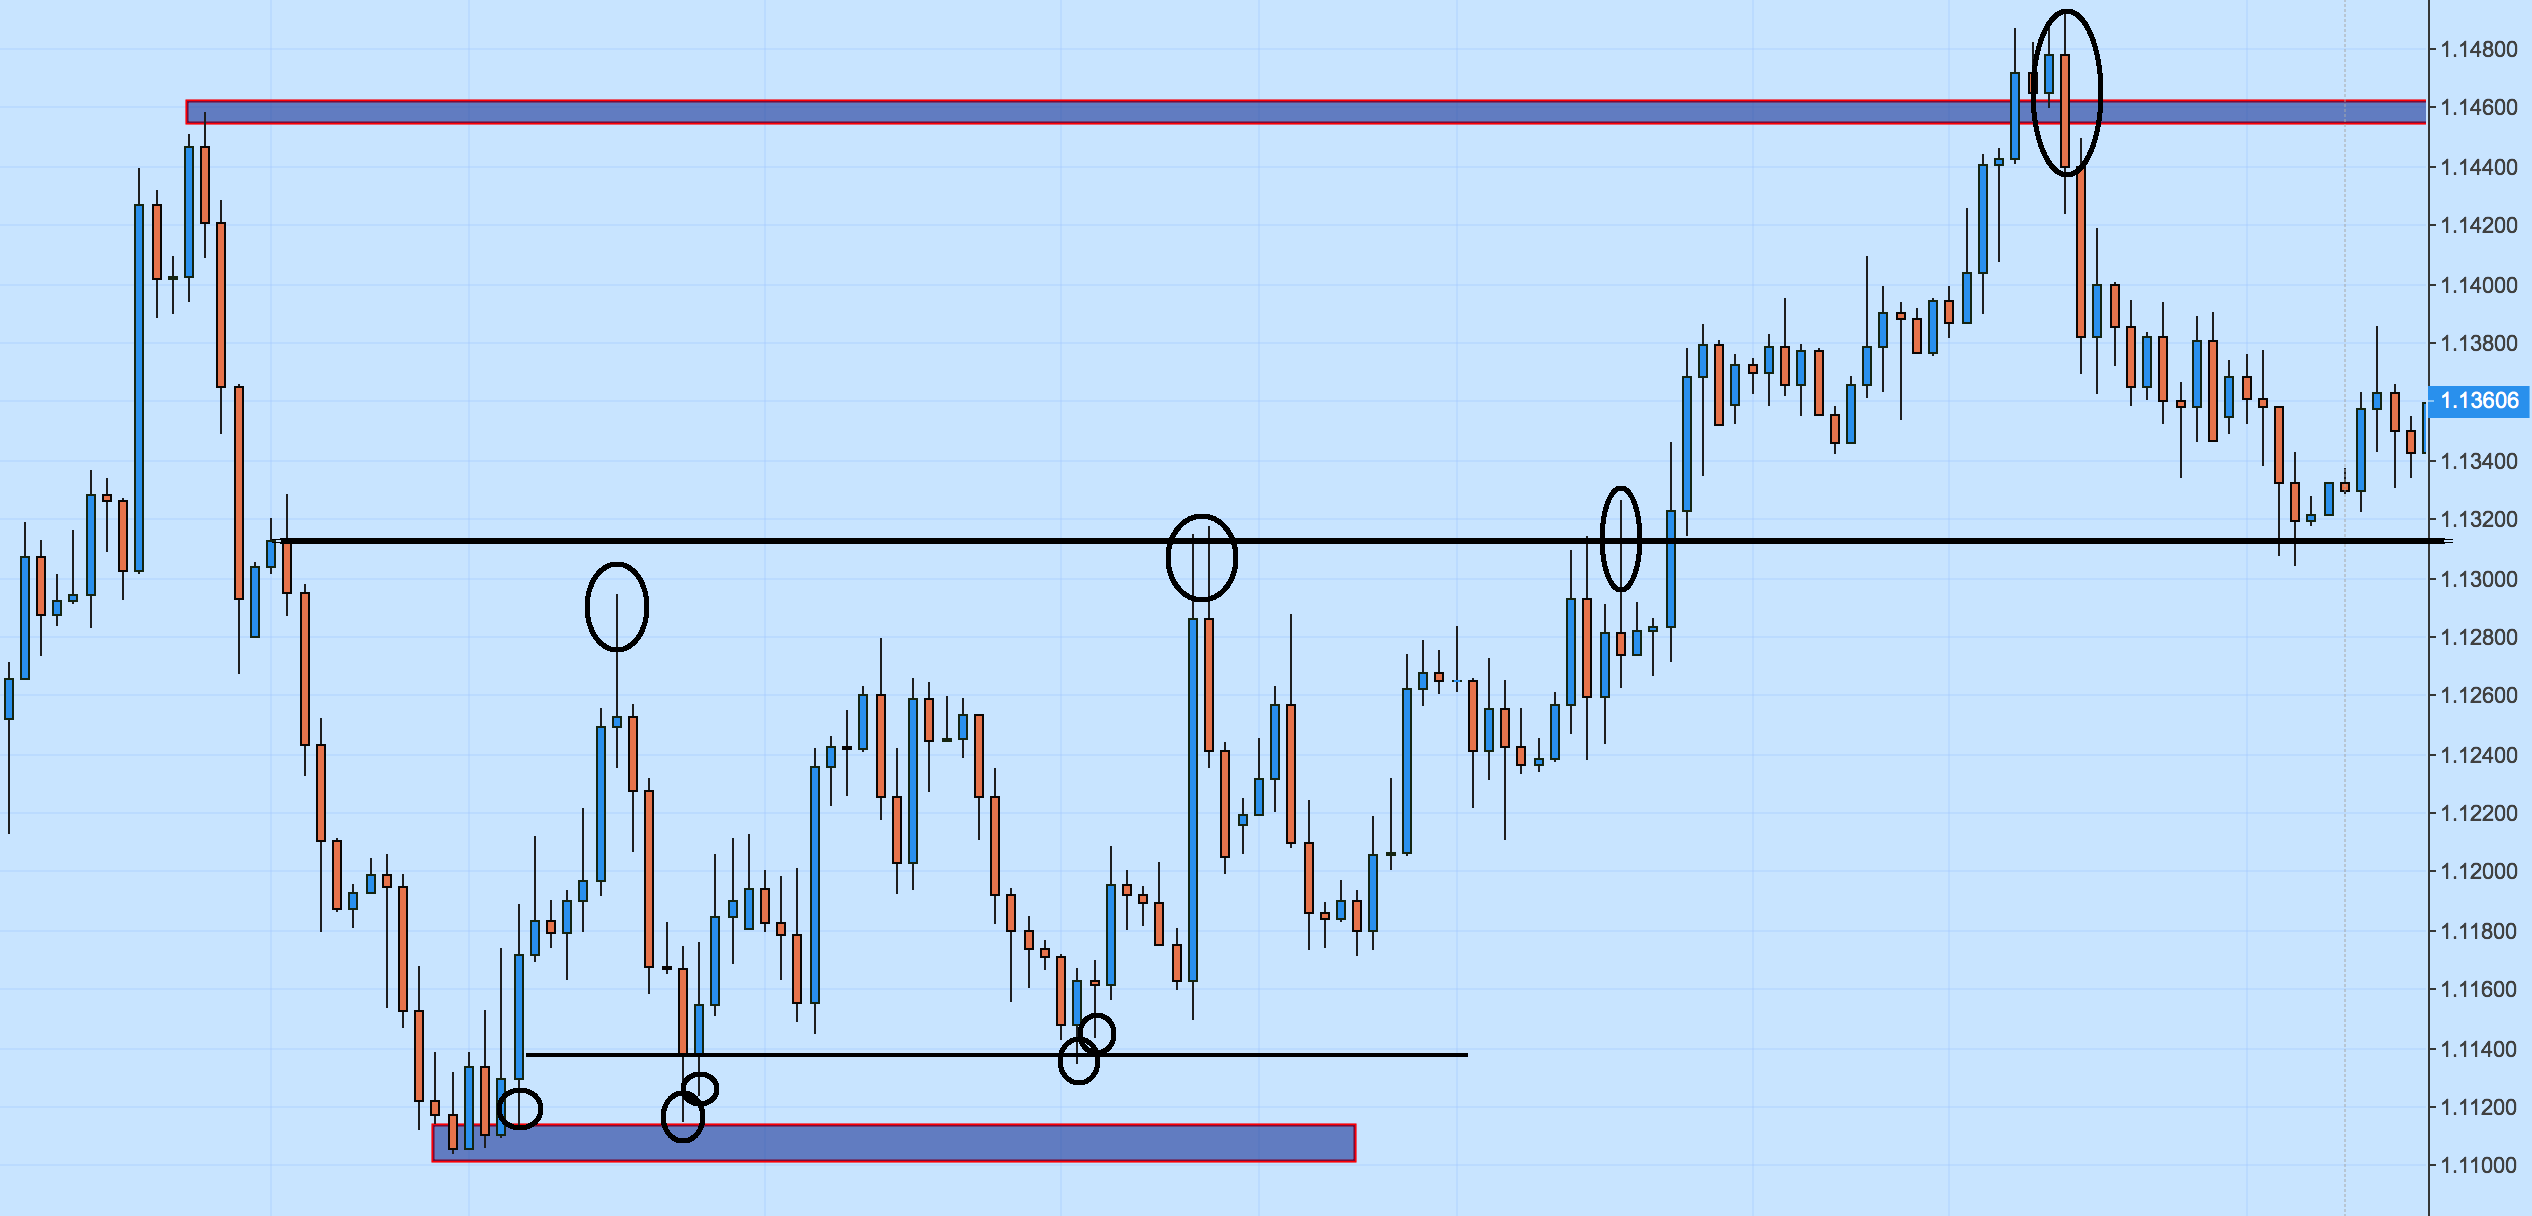
In these series of charts I will show you how I see support and resistance and confirmation from the price. The first chart is EUR/USD 4 Hours. Have a look at the rejections that price is having around the major and minor support and resistance levels marked off on the chart.
Let’s move on to the next currency pair- GBP/USD. I have done the same thing. I am showing the 4 Hour chart and the major/minor support and resistance levels. The rejections around those levels clearly show us the hesitance of market players to take decision, thus giving a carte-blanche for the market participants to push the price to the other side.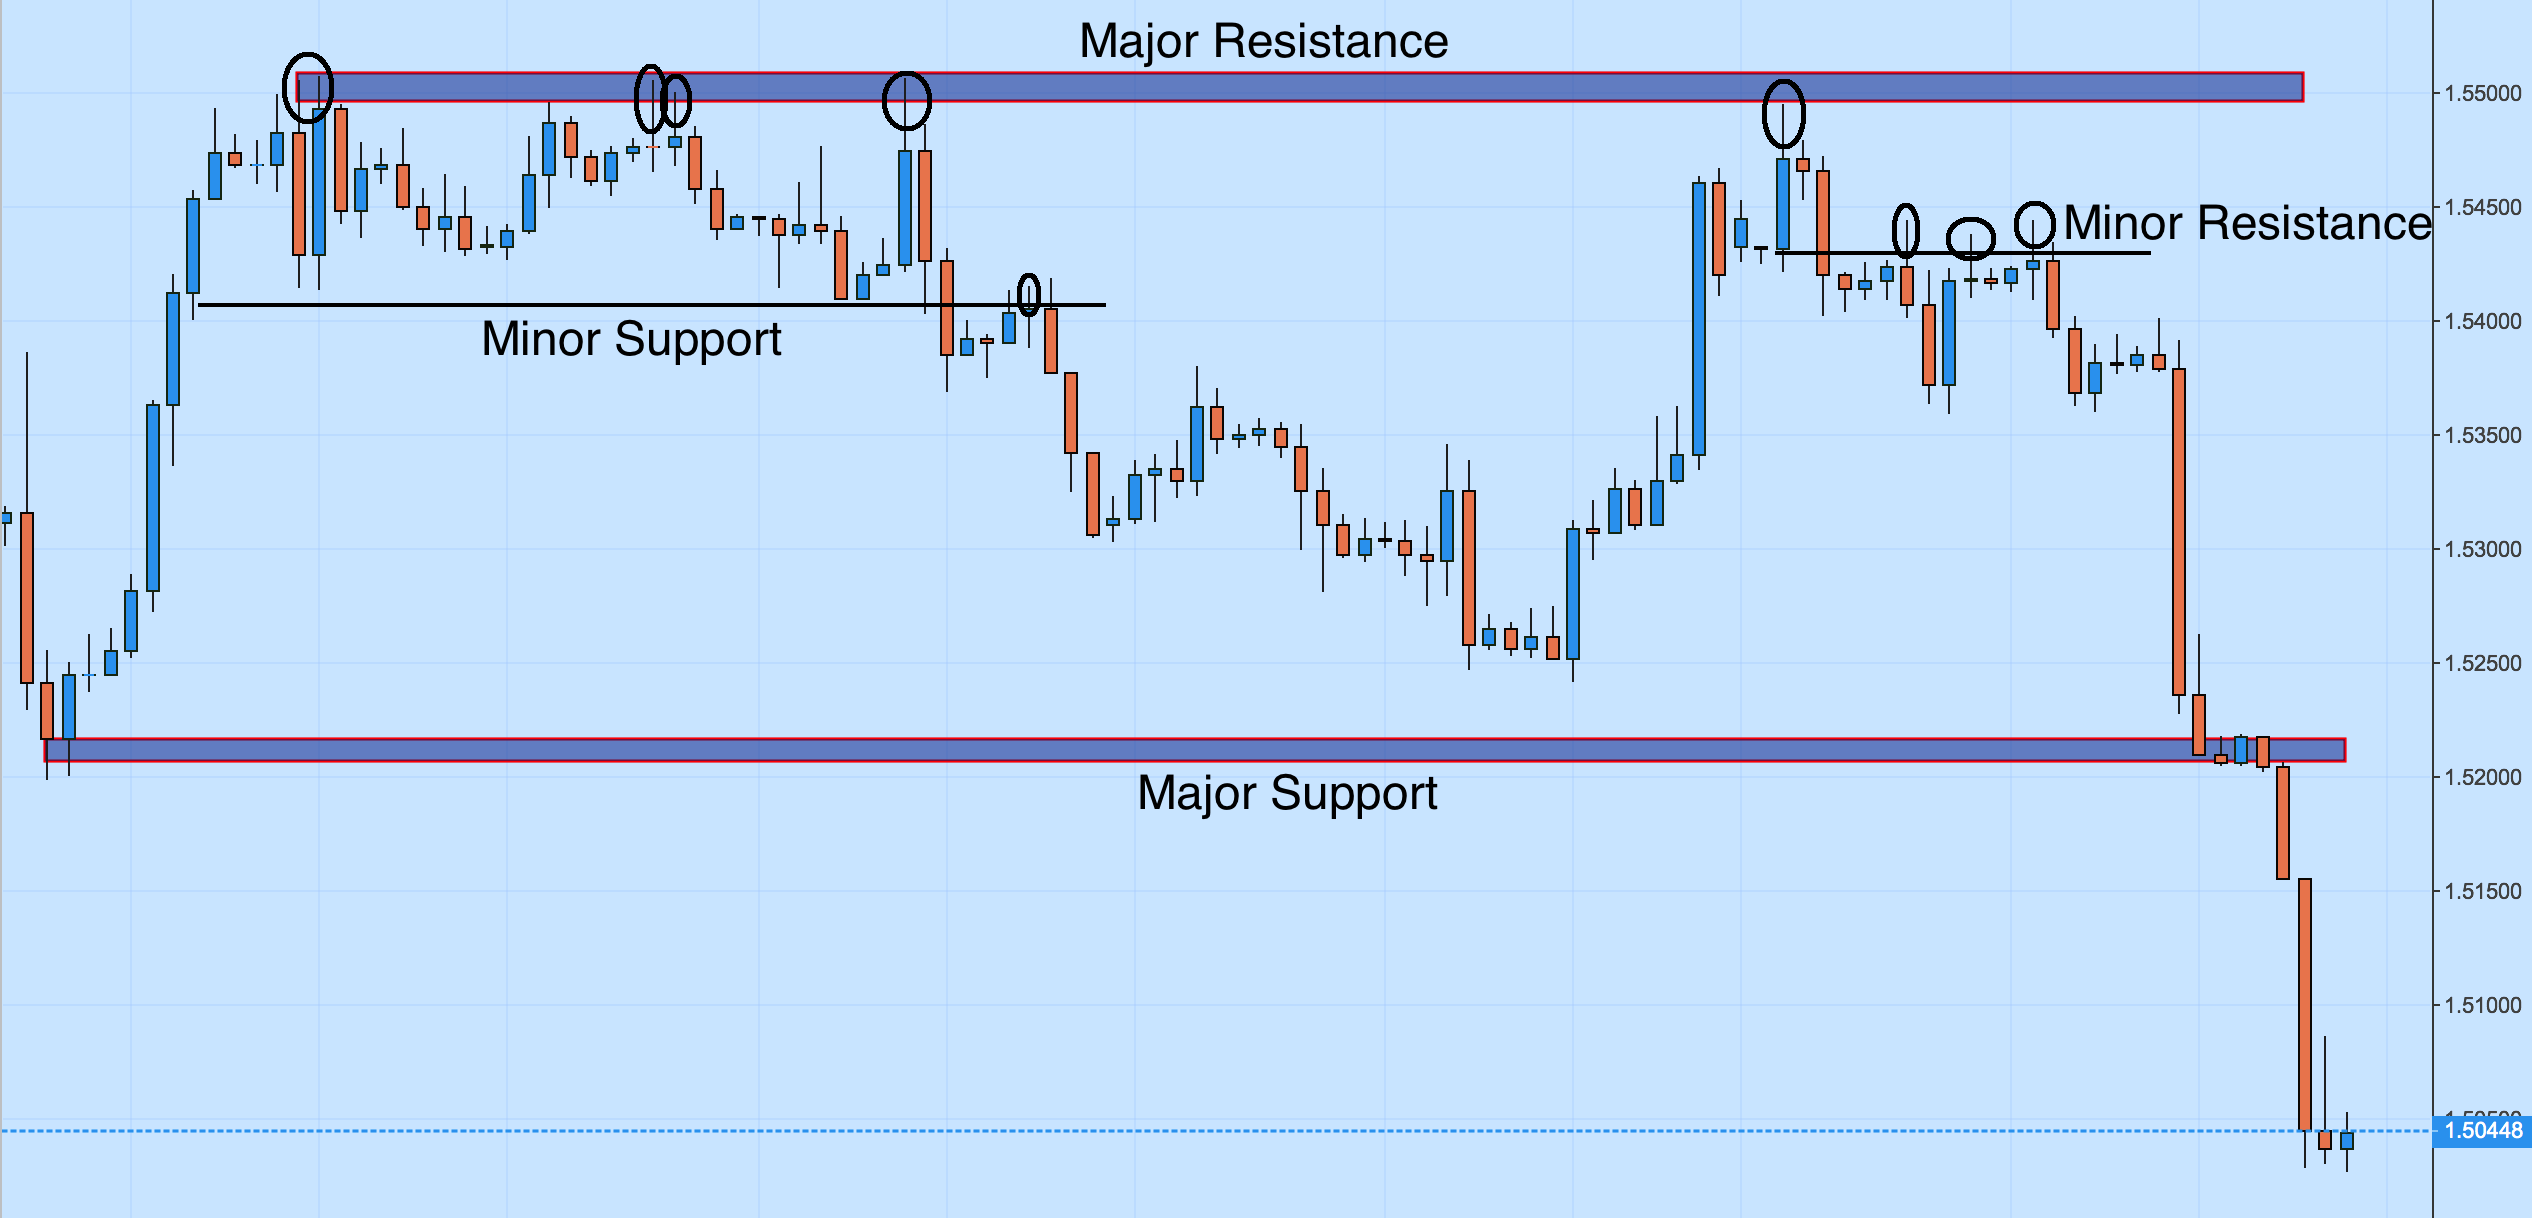
In the last chart, I am showing the USD/CAD 4 Hours chart. The same behaviour in market participants can be monitored. This leads us to believe that no matter what the instrument is, the market’s behaviour around these levels is similar. We can have either a hesitance (in the form of pin bars or rejections) or a strong breakout that takes out all stops. But, in most of the time (80% or even more) markets are trading between their support and resistance levels. 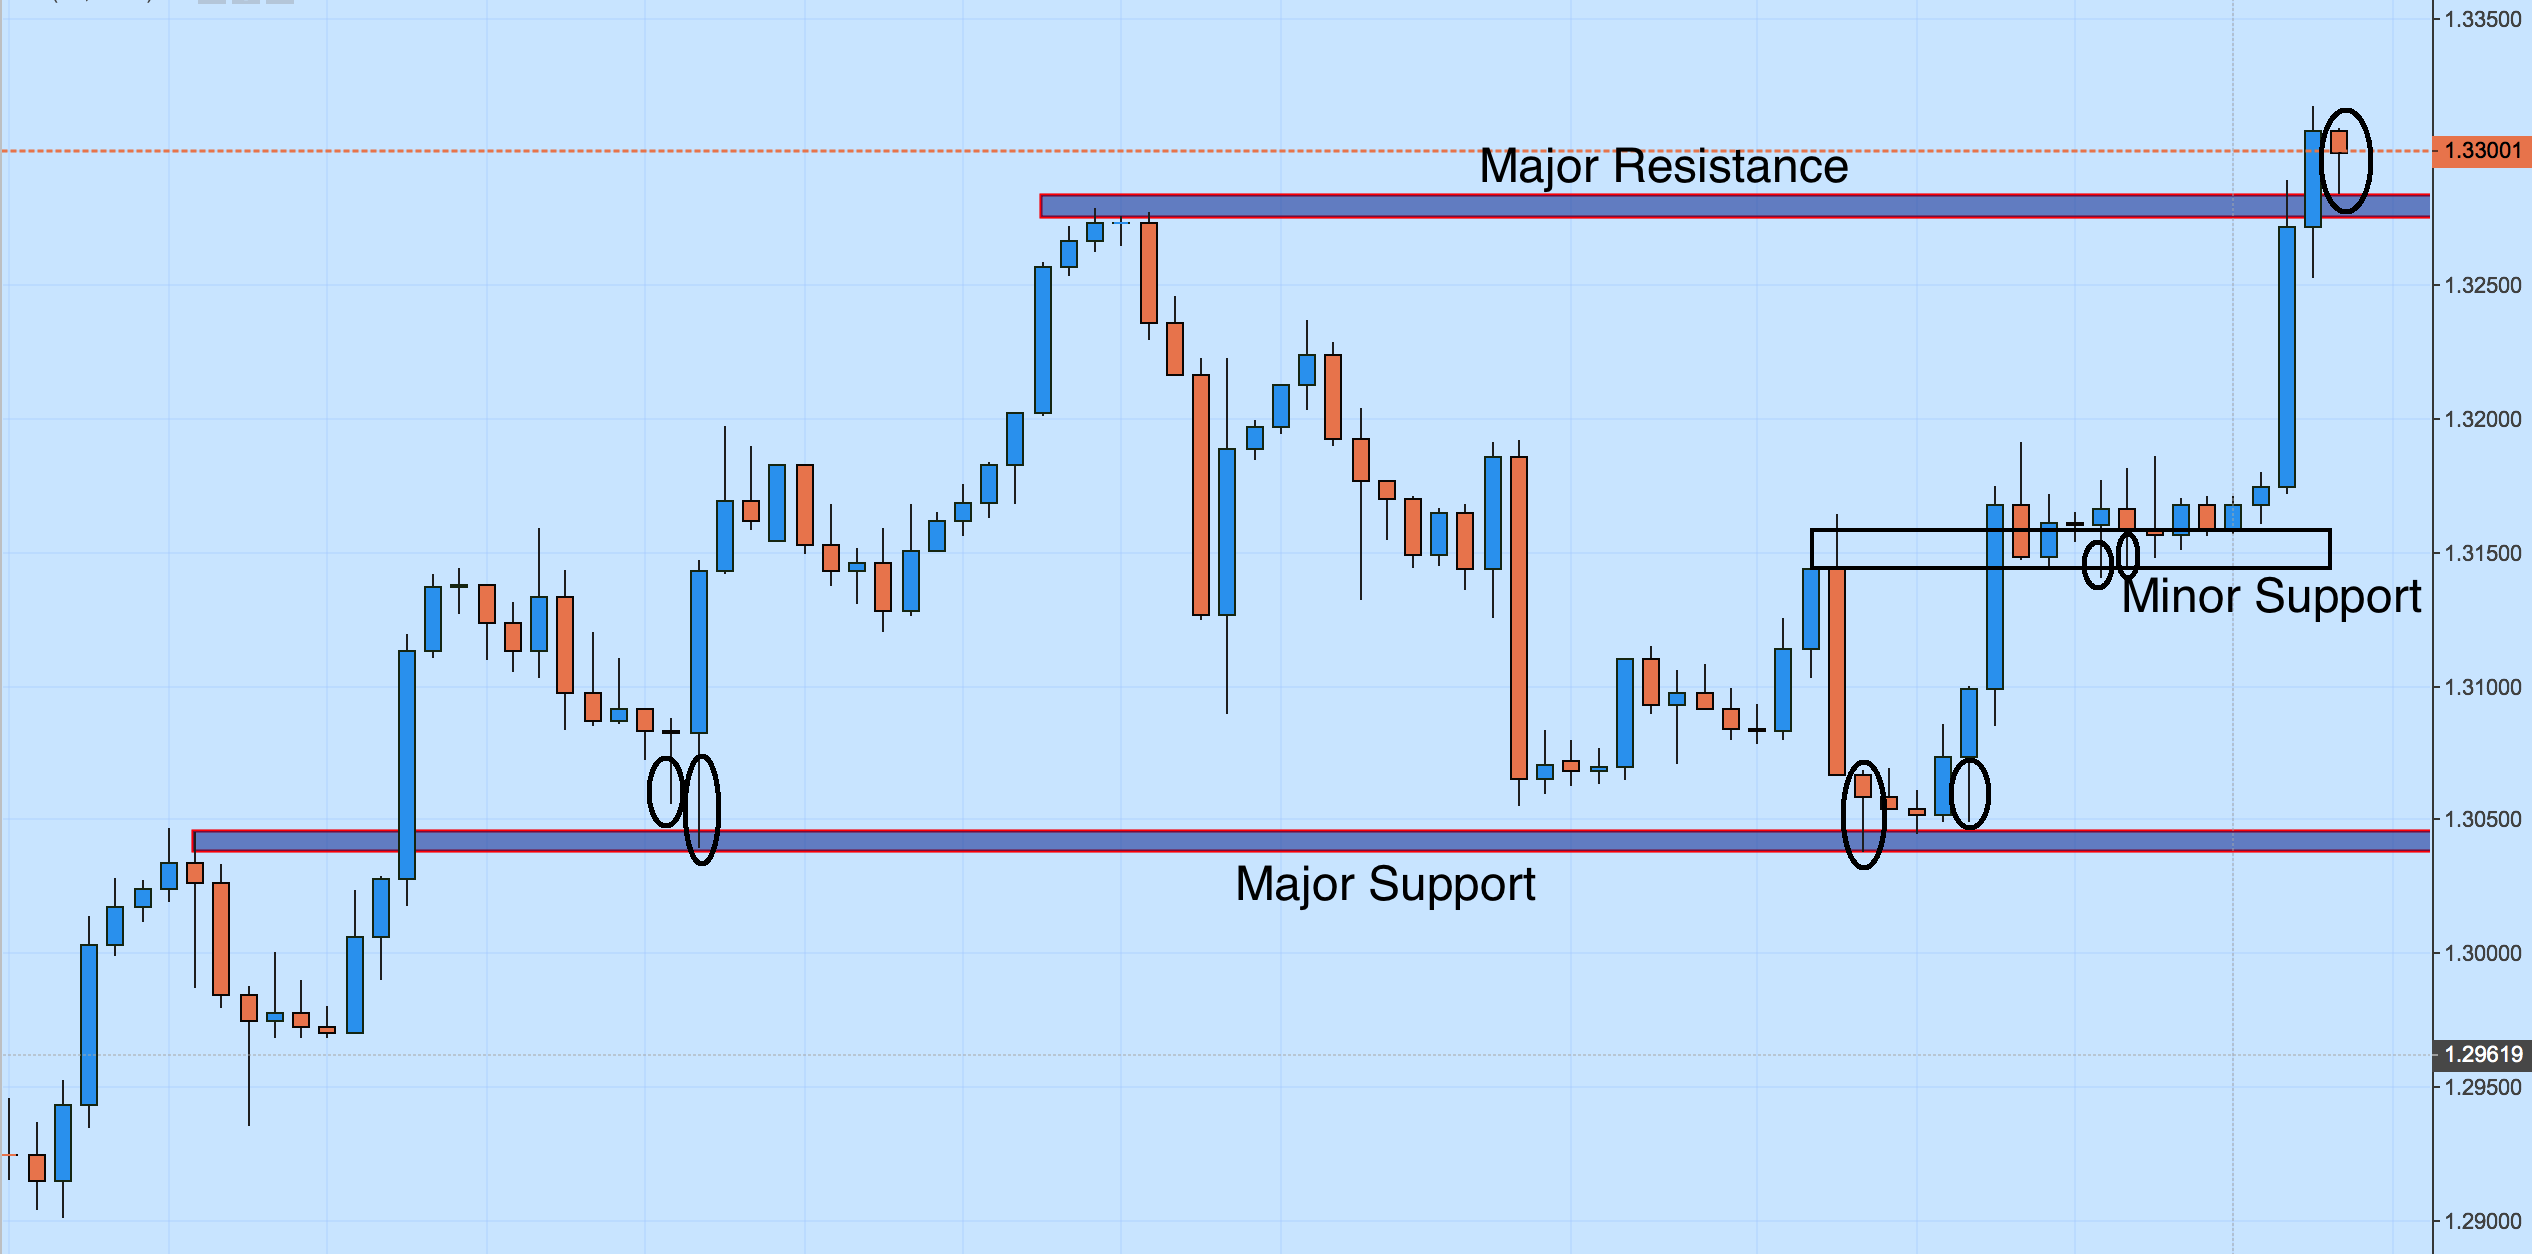
Happy Trading,
Colibri Trader