


The Complete Golden Cross Trading Strategy Guide
The Complete Golden Cross Trading Strategy Guide
A purely technical indicator, the golden cross is a bullish signal. Originating from stock market trading, it signals a long trade when two moving averages cross.
More precisely, trading golden cross patterns means buying when the short-term moving average moves above the long-term one.
As markets evolved, so did the concept.
Get the Free Moving Averages PDF Guide
When traders documented for the first time the cross trading strategy, only the stock market was available for speculation.
With online trading and the emergence of so many brokerage houses, the concept quickly expanded to other markets. In fact, all technical analysis indicators, trading theories, and tools are available for trading today’s markets.
Contents in this article
- Diversity of Markets
- Robots & EAs
- The Original Golden Cross Trading Strategy
- The Daily Timeframe – Key to the Golden Cross Strategy
- Applying the Moving Averages
- A Bit of History on Golden Cross Trading
- The Complete Golden Cross Trading Strategy Revealed
- Buying Dips After a Golden Cross Formation
- Setting the Money Management Elements
- Using the Rules of a Trend to Set the Money Management Elements
- Interpreting the MA(50)
Diversity of Markets
The diversity of markets made for traders to adapt a bit the concept. The original golden cross trading strategy still exists, though.
However, in the search for quicker profits, traders adapted the concept to today’s fast-moving markets.
As such, it isn’t unusual to see the golden cross strategy applied to different timeframes than the original concept. It also became popular in other markets than the stock market. Furthermore, it is used in combination with other technical indicators as a trading confirmation.
Robots & EAs
The explanation for all these is that, as markets change, traders change too. Nowadays, over eighty percent of trading is automated.
Robots, or trading algorithms, automatically buy and sell according to instructions. Do you think you don’t do that? Think twice!
By placing a stop-loss order on your MT4 or MT5 platform, you “tell” your broker to close your trade automatically. The same is valid for the take-profit, pending buy-stop and buy-limit, sell-stop and sell-limit, as well as another type of pending orders (e.g., O-C-O – One-Cancels-Other).
In this article, I intend to address everything there is to know about the golden cross. The aim, naturally, is to build a complete golden cross trading strategy guide.

The Original Golden Cross Trading Strategy
Before anything, the golden cross is a bullish signal. With that in mind, the idea is to distinguish bullish markets and deploy strategies to go long from a support level.
In other words, buying dips is the way market participants are playing it. It means that a golden cross strategy is not the signal per se.
What it signals is not a place to go long.
It is not showing you where to buy.
Instead, it signals that the market (i.e., a currency pair) has entered into a bullish territory. And, from that moment on, traders should start looking for setups to go long.
As mentioned earlier, the golden cross has its roots deep in stock market trading. The technical setup to spot a golden cross needs the following:
- Daily timeframe
- MA(200)
- MA(50)
Only these three things are enough for setting up the technical chart. As for the moving averages, the original concept used SMAs (Simple Moving Averages).
Nowadays, with so many types of moving averages available (e.g., EMA – Exponential Moving Average, DMA – Displaced Moving Average, WMA – Weighted Moving Average), traders have other options. However, the original concept used SMAs and, for the sake of respecting that, we’ll use SMAs too throughout this article.
The Daily Timeframe – Key to the Golden Cross Strategy
The emergence of personal computers made it easier to use technical analysis. Back in the day, though, it wasn’t the same.
For this reason, traders preferred the daily closing before plotting a moving average. Today, the concept of trading a golden cross expanded to other timeframes too.
Unsurprisingly, scalpers use the five-minute and even the one-minute chart to trade the golden cross strategy. Swing traders, on the other hand, use the hourly and up to the four-hour timeframes for it.
Even investors use the concept to track changes in macro-trends. Therefore, it isn’t unusual to hear on the FinTwit community, for instance, that a golden cross formed on the hourly chart.
According to the original concept, that would not be possible as there’s only one timeframe that matters. The daily one.
Below is the daily timeframe on one of the most popular currency pairs: the EURJPY pair. Because the USD is not present, it means this is a cross and not a major pair.
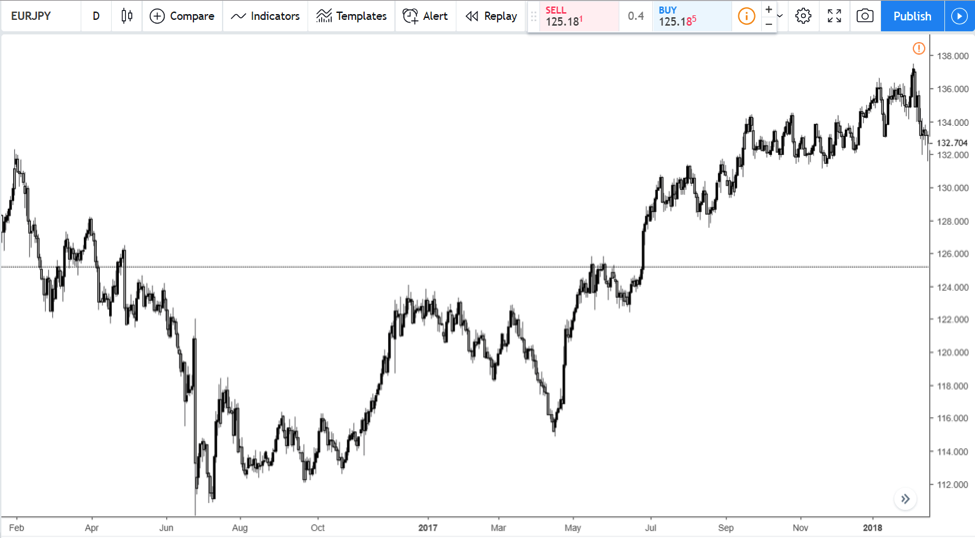
Since middle 2016 and into 2018, the pair moved in a bullish trend. More precisely, the bullish market started from below 112 and all the way to the 138. Quite a ride!
Let’s see the rules of the golden cross trading strategy applied on a bullish trend. I will use the EURJPY example to set up a complete golden cross trading strategy step by step.
Applying the Moving Averages
The MA(200), also known as “the mother of all moving averages,” is the most important one. Have you ever wondered why traders don’t use averages higher than 200?
When the moving average considers longer periods, it becomes flatter. In the end, it becomes just a horizontal line on the chart. Hence, it loses its significance.
The other moving average, the MA(50), is more “nimble”. More precisely, four times faster, which means two things.
- First, it is closer to the price action.
- Second, it turns quicker than the MA(200).
Plotting them together on the chart we see how the original golden cross setup looked like when traders only speculated on the stock market. The only difference is that this is the EURJPY on the 21st-century currency market.
The blue line shows the slower moving average (200), while the red one is the MA(50).
The golden cross’s definition says that when the faster moving averages crosses above, the slower one, the market enters the bullish territory. However, pay attention to the wording!
It is not a signal to go long. At best, it signals the bullish market may have started. Therefore, traders prepare to go long, depending on the strategies they follow.
What’s interesting here is that the moving averages are used in a different way than traditional. Their traditional role is to provide support and resistance.
But in this case, the golden cross strategy uses their cross to draw the attention of market switching from bearish to bullish. Only next, traders use the support characteristic of the two MAs to buy dips.
A Bit of History on Golden Cross Trading
From the start, it is a controversial signal. Used alone, many traders believe it has little or no value.
That is if you take the word of today’s anxious Forex trader. But if you look at how it worked in the past on the stock market, the numbers look impressive.
For instance, let’s take the S&P500. As one of the most popular stock market indices in the United States, it often serves as a benchmark for the stock market worldwide.
Since the 1970s, when the interbank (i.e., foreign exchange market) market appeared, the S&P500 provided no less than twenty-three golden cross setups. Naturally, not all of them played out.
But a closer look at individual crosses reveals positive numbers. The last cross, for instance, provided a return bigger than seventy percent. Moreover, over a one-year horizon, the average gain after a golden cross sits around 11%. Do I have your attention now?
Not bad for a trading strategy considered obsolete by many traders! Again, it provides a “green light” to go long on a market. However, not right away, but applying different trading methods on top of the original golden cross setup.
The Complete Golden Cross Trading Strategy Revealed
Now that you know a bit more on golden cross trading let’s have a look at some ways to trade it. Or, to trade the market after a gold cross formed.
Using the same EURJPY daily chart, here’s the golden cross illustrated by the MA(50) crossing above MA(200).
As always when working with moving averages, they lag. It means that the faster-moving average turns way slower than the actual price action does.
In other words, by the time the golden cross formed, the market already moved higher. A lot.
In the EURJPY case, it moved to over 120 from below 112. Considering the previous bearish trend, though, it isn’t that much of a bounce.
Buying Dips After a Golden Cross Formation
The natural tendency is to buy dips after a bullish setup. Because there are two moving averages part of the technical picture, the slower one acts as support.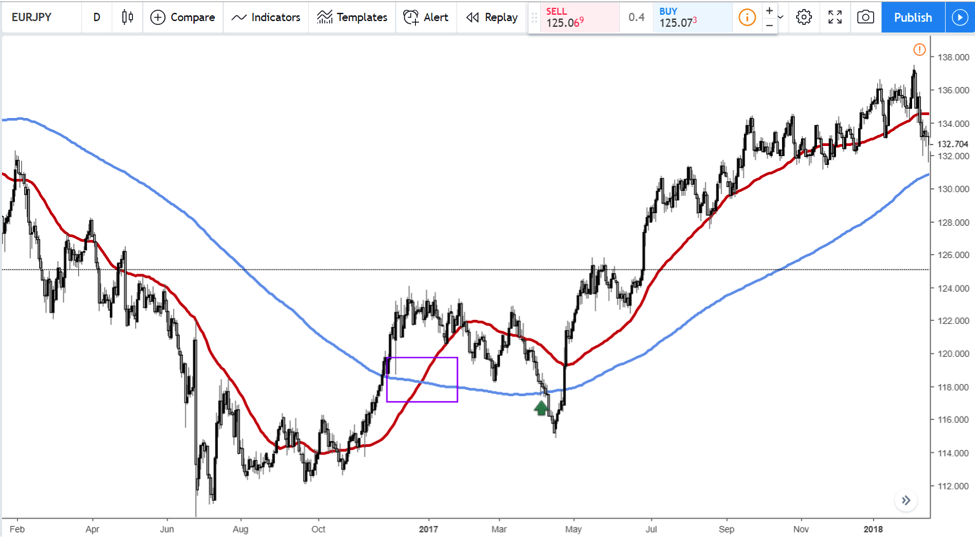
The green arrow on the chart above shows the entry place for a long trade. But trading without a money management plan leads to losses only.
For this reason, traders must always place a stop-loss and a take-profit level. Any given trade must have the two. Furthermore, trades should follow a money management strategy that favours high risk-reward ratios.
A risk-reward ratio defines the reward in comparison to the risk for each trade. The higher, the better for the trading account.
Setting the Money Management Elements
Only the entry is not enough for a proper setup. As the chart shows, the market pierced through the MA(200) quite a lot.
Moreover, because this is the daily timeframe, the dip lower took some time too. Enough to scare even the most hawkish EURJPY trader.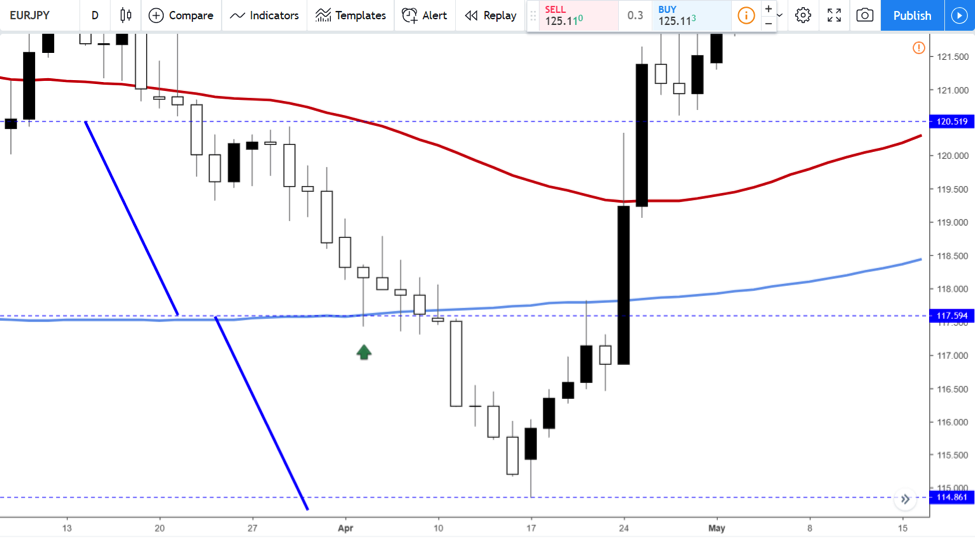
A quick zoom-in helps us understand the trading setup better. Focus on the green arrow on the chart above!
That’s the entry level on the long side as the EURJPY price hit the MA(200) for the first time after the golden cross formation. But we need to set up a stop-loss and a take-profit for the trade. Moreover, they must be part of a proper risk-reward ratio for the currency market.
One way is to place the stop-loss order considering the slower MA. First, mark the distance between the MA(200) and MA(50) on the entry level. In the chart above, the two blue horizontal lines on the upper part of it show that distance.
Second, use a distinctive line and measure that distance. Finally, project that distance from the MA(200) level to find out the stop-loss level. Or, the level beyond the trade is invalidated.
The long trade survived by a thread. Yet, it survived.
How about the take-profit level? Now that we know the risk, we can easily calculate the reward.
On this website, there are many posts describing what a proper risk-reward ratio for the currency market looks like. Just browse the posts, and you’ll find out that 1:2 or 1:3 rr ratios fulfill the condition.
It means that for the risk taken, the trader sets the take-profit level double or triple the distance. Hence, just measure the distance between the entry and the stop-loss level. Next, project it two or three times to the upside. Finally, set the take-profit level.
Using the Rules of a Trend to Set the Money Management Elements
The rules of a trend also help in golden cross trading. A bullish trend is nothing but a series of higher lows and higher highs.
Effectively, it means that the market keeps advancing, making new highs. But the dips fail to break the previous higher low.
With that in mind, let’s have a look again at the EURJPY chart. We know the entry: when the price hits the MA(200).
But following the rules of a trend, the absolute invalidation would be the previous higher low. That’s the stop-loss.
Armed with that info, setting up the risk-reward ratio follows the same steps as the ones mentioned above.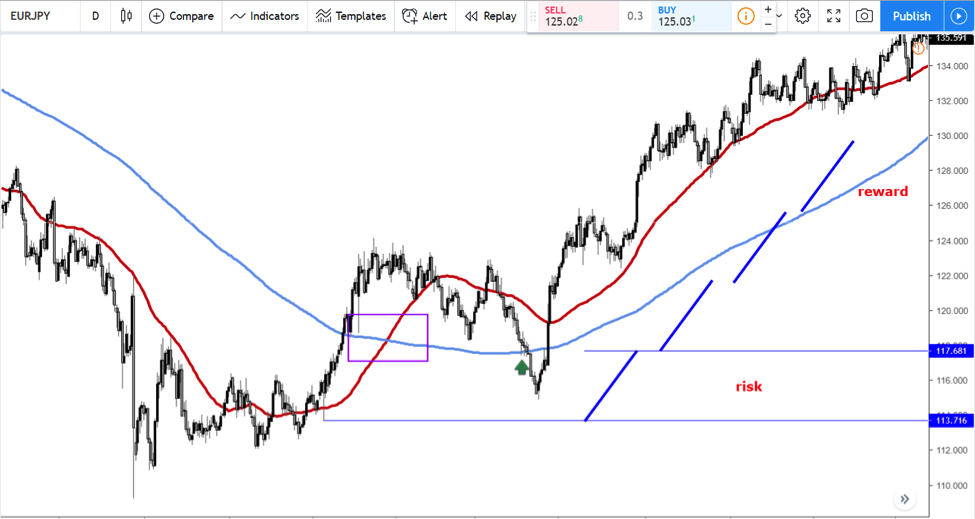
Interpreting the MA(50)
One important aspect relates to the price action. Is there a way for traders to know when the trend fades?
Or, is there a price action pattern that tells us the bullish trend might fade a bit? The answer is positive, and the solution lies with the MA(50).
So far, we’ve treated the golden cross strategy only in relation to the money management elements. Namely, the entry, stop-loss, take-profit, and the proper risk-reward ratio.
But trading the currency market is subject to high volatility. The markets change direction fast, on nothing at all.
Luckily, the daily timeframe is big enough to filter the day to day noise. However, cautious traders always look at early signals that the bullish setup might fade. For this, the MA(50) helps.
Steps to Follow the Price Action
The chart below shows the steps to follow to monitor the price action. Focus on the magenta squares. There are four of them.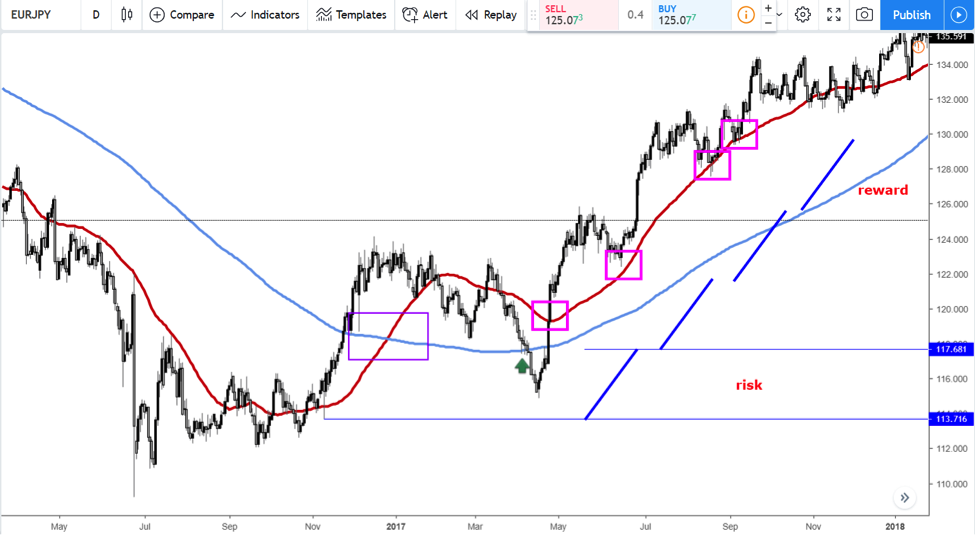
From left to right, the first one is critical. It represents what all bulls want to see: the price crossing above the slower MA, while the stop-loss in place.
A moving average serves another purpose. Besides helping distinguish a bullish from a bearish market, and showing support, it also reveals the relevant price action.
The ability of price to keep coming to the moving average is not a good sign. It shows a weakening trend. A trend that’s close to exhaustion.
For this reason, savvy traders allow the price to test the slow MA only twice. The third time it does that, that’s the earliest sign that the trend is about to end.
The following magenta squares show just that. At the first approach to the MA(50), the price bounces nicely.
It makes a new higher high. It even reached the 1:3 rr ratio.
But the inability to advance more tells us that the bullish trend is about to fade. The price comes back to the moving average, for the third time, showing signs of weakness.
What do you think followed? Here’s the continuation chart: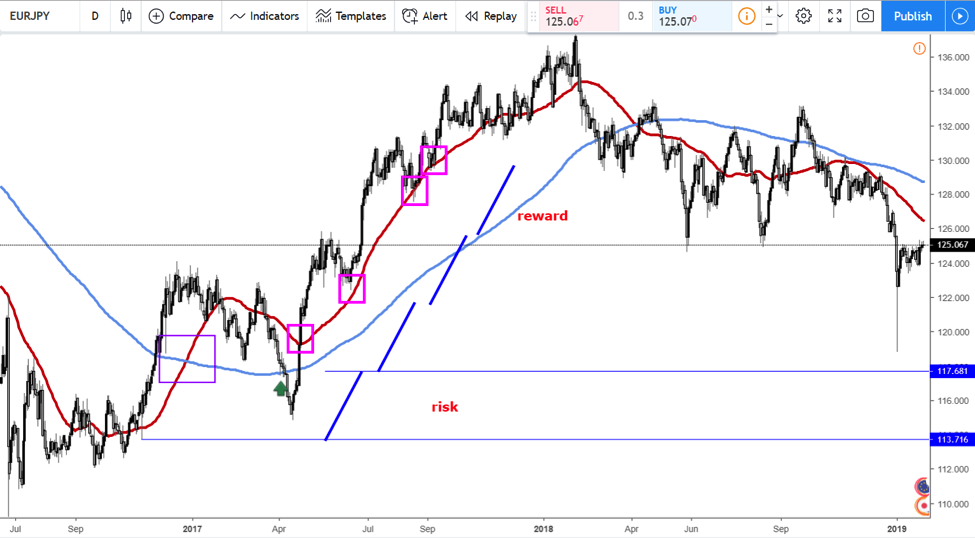
It kept advancing for a while, only to reverse sharply. And, in doing that, it formed a bearish signal, known by the name of death cross.
In fact, it is the opposite of a golden cross. Instead of showing a bullish market, it tells traders that conditions changed. A bearish market comes.
But the rules of trading a bearish market differ from the ones used when trading a bullish one. The explanation comes from the human nature, and how traders/investors perceive risk.
Studies showed that the market declines faster than advances. And, the spikes during bearish markets are more aggressive than the dips during bullish ones.
Hence, trading a death cross differs from trading a golden cross setup. Perhaps we’ll treat that concept in one of the future articles part of this blog.
Conclusion
A golden cross is a technical trading setup. The two moving averages show the market state, the transition from bearish to a bullish market.
However, the golden cross appearance on a chart doesn’t mean that traders should go long that very moment. Instead, they focus on buying a dip that respects the rules of a trend (higher lows and higher highs).
More importantly, the long trade that results after a golden cross needs to be fully integrated with a proper money management system. As not all trades are profitable, the golden cross setup functions as an indication of what the most likely course of action will be.
The golden cross trading strategy revealed in this article is unique in every way. It has a proper risk-reward ratio, as well as clear steps to follow for setting the entry and exit levels.
Moreover, it anticipates the trend’s exhaustion, alerting traders to book the profits and exit the trade as quickly as possible.
In the end, like all trading strategies, money management matters more than the actual technical setup. Therefore, without integrating it into every strategy, traders will continue to struggle.