


Level Up Your Trading with the Best Stock Screener- TrendSpider
TrendSpider is a professional-grade trading platform and possibly the best stock screener out there.
In addition to the usual charts and indicators, the platform features cutting-edge automation, scanning, backtesting, alerting.
It also features capabilities that can help you find hidden opportunities in the market.
One of the most powerful features is the Market Scanner, which improves upon conventional stock screeners in many ways.
Let’s take a look at what makes TrendSpider’s Market Scanner the best stock screener on the market for traders.
Contents in this article
Download TrendSpider’s Tips and Tricks Spreadsheet Now
Getting Started
Getting Started
TrendSpider has an easy-to-use interface that should be familiar to anyone that has used TradingView or other web-based platforms.
You’ll find the typical drawing tools and technical indicators along with cutting-edge features like:
- automatic trend line analysis
- candlestick pattern recognition
- backtesting capabilities
And of course—the best stock screener on the market.
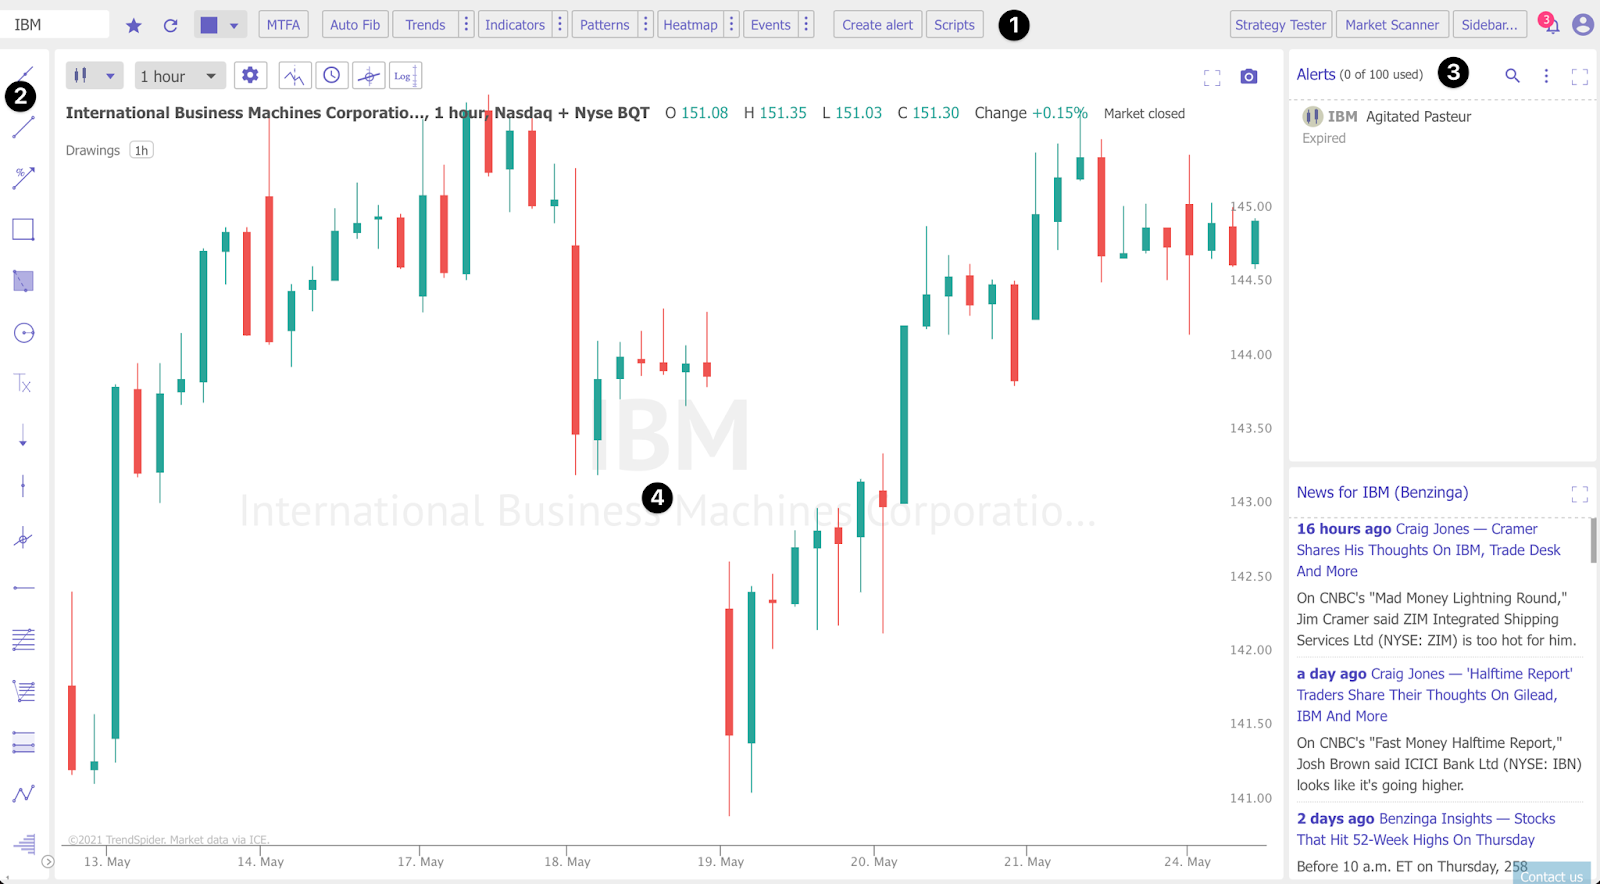
The User Interface
The user interface is divided into four sections:
- The top menu bar lets you toggle different features, including the Market Scanner (the best stock screener out there), Multi-Timeframe Analysis, the Strategy Tester and other cutting-edge tools.
- The left side bar contains drawing tools that you can use to markup charts, ranging from basic trendlines and Fibonacci tools to Polylines and Volume by Price. You can even create your own custom annotations!
- The right side bar contains customizable widgets, such as dynamic watchlists and tools to analyze insider trading, analyst estimates and seasonality trends. By adding these fundamental factors, you can dramatically improve your trading.
- The main charting window contains the price chart and technical overlays, as well as the ability to toggle different time frames, chart types and other settings. Notably, you can include two time frames in a single view!
While we will focus on the Market Scanner in this article, you can check out my other article on TrendSpider and how to use it.
The article introduces you to technical charts and covers how to use the TrendSpider platform
It dives into advanced topics through various examples.
Along with signing up for a free trial, it’s the best way to get started with the platform without getting overwhelmed.
If you’re a customer or free trial user, you can sign up for a free one-on-one training session.
There you will receive a more customised introduction where you can see everything in action.
Build a Strategy
Most traders have a choice when building strategies:
- They can create a series of rules in their head and flip through charts all day
- Or they can automate the process.
Unfortunately, the process of automating strategies typically involves programming.
This makes it off-limits for non-technical traders that don’t want to spend a lot of time learning Python or a platform-specific programming language.
TrendSpider’s Strategy Builder makes it easy to define your trading strategy in an easy-to-use visual interface rather than a code editor.
By combining prices, candlestick patterns or indicators with logical operators in a guided wizard, you can quickly create highly customisable trading strategies.
You can start without the need for a steep learning curve of TradeStation, MetaTrader or other professional-grade platforms.
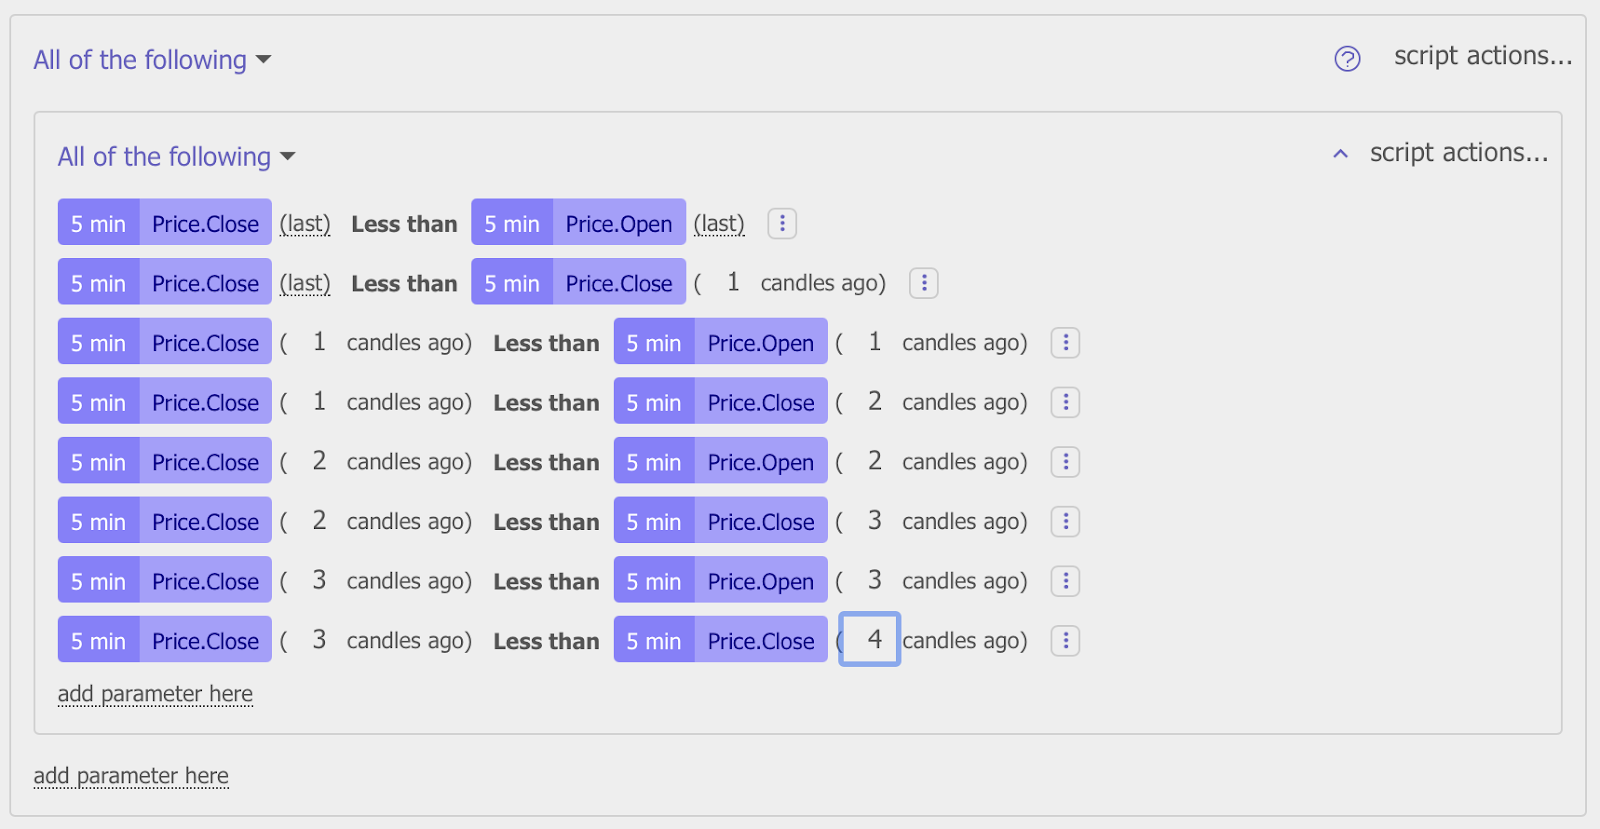
And Here Are The Steps…
For instance, you can create a strategy that fires when the 50-day moving average crosses above the 200-day moving average.
You can combine this with the RSI while it is below 50—but only during the first half of the day.
Or you can use one of the many pre-built strategies, ranging from simple moving average crossovers to advanced strategies.
The sky’s the limit!
The Strategy Builder is used to create strategies for everything from alerts to watchlists without having to recreate them each time.
One thing that makes the Market Scanner the best stock screener is that you can build complex screens.
And you don’t even need to learn how to code or string together screens.
You will not need to run one screen with the results of another screen to narrow down opportunities.
Introducing the Market Scanner
Most traders are familiar with conventional stock screeners where they can filter down opportunities based on a handful of pre-defined criteria.
While there are typically a handful of technical indicators available, the vast majority of stock screeners lack:
- The customisation required to implement a viable trading strategy
- This leaves traders to spend hours manually analysing different charts.
The Market Scanner makes it easy to find opportunities using the strategies that you’ve built with the Strategy Builder.
You don’t have to waste time flipping through charts trying to find opportunities.
This alone will save you valuable time and help you avoid missed trades.
After a few minutes of using the scanners, you’ll quickly see why it’s the best stock screener available to both beginners and advanced traders.

How To Use The Market Scanner
Click Market Scanner in the top menu bar.
In the window that appears below, you can search for existing scanners or build new ones using the Strategy Builder (discussed above).
With hundreds of technical indicators, candlestick patterns and other metrics available at your fingertips, you can filter down watchlists to very specific opportunities.
You can do this while targeting specific markets with specific strategies.
Traders can run the Market Scanner on charts that range from 1-minute to 1-month.
You can even combine up to five different time frames into a single scan, opening the door to endless possibilities.
Traders can also select different indexes, candle types, and toggle between whether to include extended hours.
This provides a lot more flexibility than competitors and making it the best stock screener out there.
Note: If current candle is checked, the scan incorporates the current candlestick in its current form—even if it’s not finished.
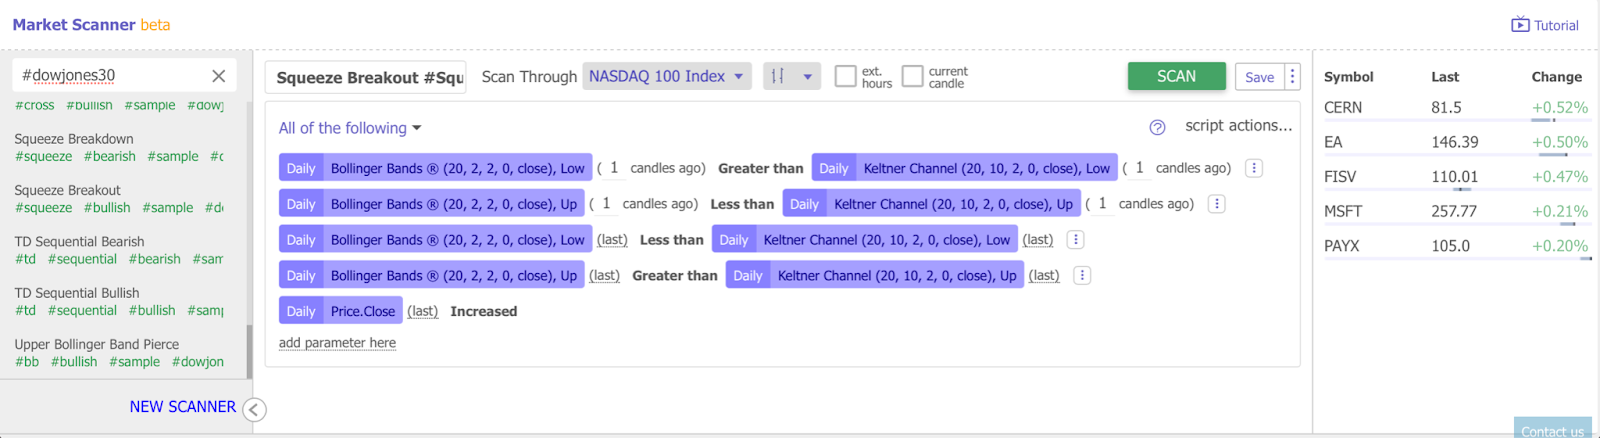
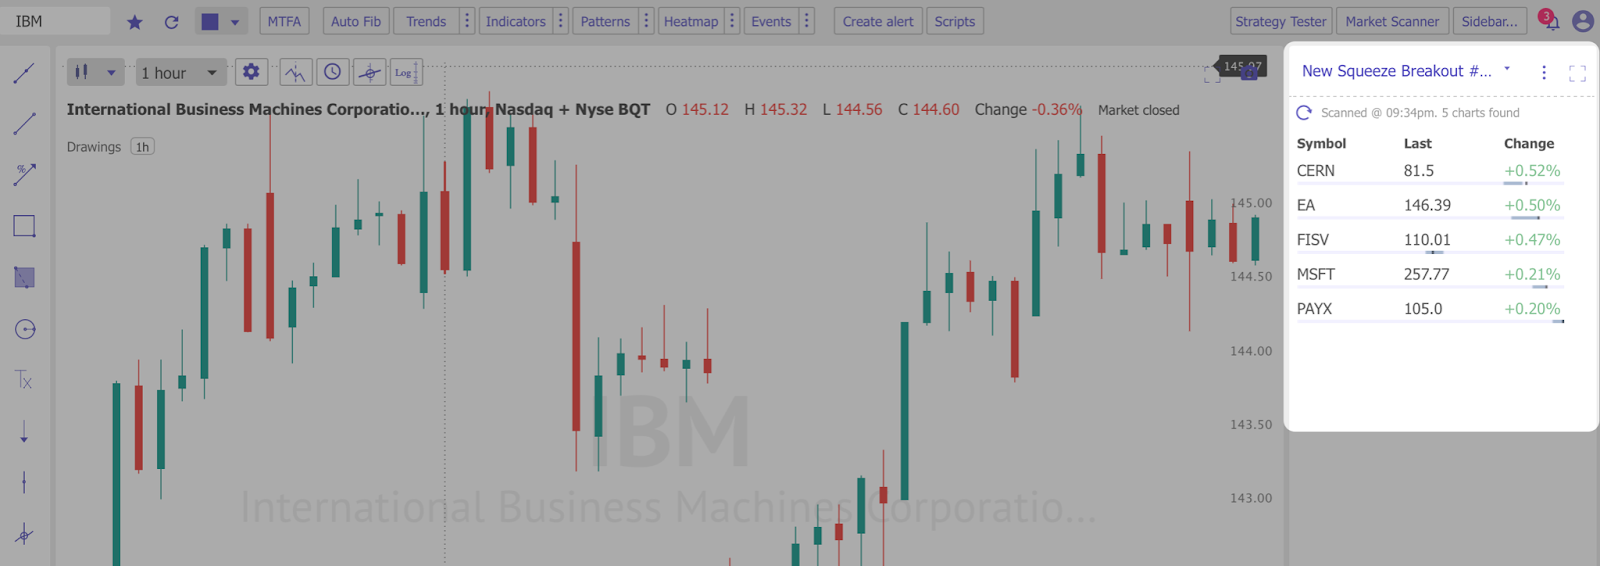
Once you’ve built or selected a scan, you can run it against common indexes and industries (including crypto).
Alternatively, you can run it against your own watchlists to find opportunities.
After clicking the Scan button, the matches will appear to the right of the Strategy Builder along with the percentage change for the day.
This gives you an idea of 52 week performance, helping you quickly narrow down the best opportunities.
Creating Dynamic Watchlists
Most traders associate watchlists with indexes or manually-created groups of stocks.
While it’s helpful to keep a list of interesting stocks on-hand, it would be even more helpful to automatically update a watchlist.
This watchlist could be based on real-time opportunities that meet the criteria that you’ve defined in a trading strategy.
Fortunately, TrendSpider makes it easy to create these kinds of dynamic watchlists.
The Market Scanner is an excellent way to identify trading opportunities.
But running the scanner each time you want to find opportunities can be time-consuming.
Dynamic Watchlists
Another feature that makes it the best stock screener online is the ability to convert a scan into a Dynamic Watchlist.
That’s available as a widget on the sidebar, providing convenient access to opportunities throughout the day.
Dynamic Watchlists enable you to quickly view the results of your scans without going into the scanner each time.
You can click the refresh button right on the homepage to get the latest scan results at any time.
In fact, it’s the easiest way to track what matters and focus on trading rather than toggling between different tools.
Even better, you don’t have to create and maintain watchlists by hand!
Using Dynamic Watchlists
You can create Dynamic Watchlists in a few easy steps:
- Use the Market Scanner to create a scan and click the Save button to save it.
- Click the Sidebar button in the top menu, select the Watchlist or Scanner widget and then click Done.
- In the right panel, click on an existing watchlist name to open the selection dialog and find your scan.
- Click the Refresh button to show the latest opportunities.
In addition to scanners, Dynamic Watchlists can be configured to show different indexes, sectors, industries or crypto lists.
You can also share your scans with other TrendSpider customers by clicking on the three dots next to the save button.
These shared scans will appear under Subscriptions in the Dynamic Watchlists and represent a great way to share strategies with others.
Improve with Backtesting
Backtesting is an advanced feature that has typically been reserved for algorithmic traders that have the expertise to code their own trading strategies.
In addition to providing the best stock screener on the market, TrendSpider lowers the barriers for backtesting.
TrendSpider also evens the playing field with its point-and-click Strategy Tester.
It’s easier than ever to vet strategies before deploying them with real money.
The Strategy Tester provides a wide range of statistics, including net profit, max drawdown and the number of positions.
Strategy Tester
Charts make it easy to compare the strategy’s performance versus a buy-and-hold strategy.
It is also very easy to see how the strategy performed compared to randomised trades (e.g., the strategy’s alpha).
These capabilities go above and beyond many other backtesting solutions.
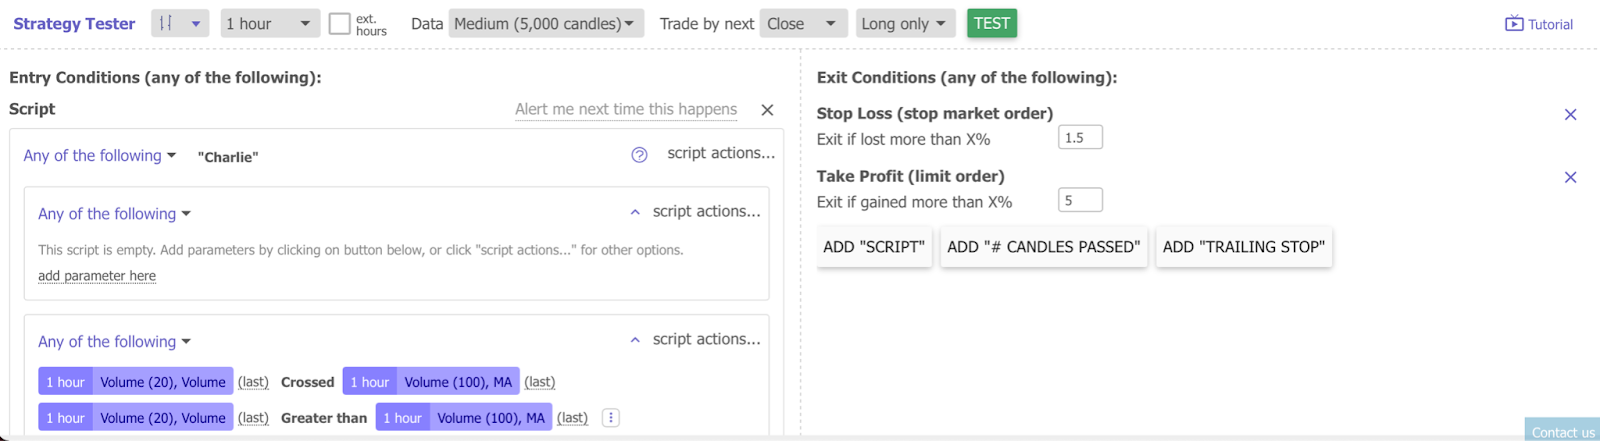
Click on the Strategy Tester button on the right-side of the top menu bar to get started.
You can define entry and exit conditions using the Strategy Builder.
If you already have a Scanner built, you can select the scan and backtest it against historical data to see how it would have performed.
You can backtest new strategies before converting them into scans to ensure that they actually perform well!
After clicking on the Test button, you can see a wide range of valuable statistics and visualizations (mentioned above).
You can even click on the See on Chart button to see trades on the main chart window.
There you can see how the latest trade is expected to perform based on the strategy’s historical performance!
Backtesting isn’t a guarantee of future performance, but it can be extremely helpful as an initial validation point.
From there you can get an idea of trade volume and other metrics.
The ability to get these levels of insight from a simple screen makes the Market Scanner the best stock screener out there.
Beyond Scanner
TrendSpider is one of the most powerful technical analysis and charting platforms out there—and it’s accessible to traders of all levels!
In addition to the best stock screener on the market, the platform provides a wide range of other cutting-edge features.
These, you won’t find anywhere else!
Some of the other key features include:
- Raindrop Charts: Raindrop charts are a TrendSpider invention that provides an extra dimension to your analysis by incorporating volume into each price bar. Using rendered histograms and VWAPs, you can visualize where the price moved, how long it took to get there and how volume flows.
- Premium Indicators: TrendSpider goes above and beyond the basic technical indicators that you’ll find anywhere to include premium indicators. For example, heatmaps let you see where volume has concentrated in the past and anchored indicators let you incorporate major trend changes into your analysis.
- Sharing & Branding Tools: If you run your own trading business or blog, TrendSpider’s sharing and branding tools can add your logo and name to the upper left corner of each chart you share. You can also join the company’s affiliate program to earn revenue from referred users, opening up a potentially lucrative revenue stream for bloggers.
Constant Innovation
In addition to all of these unique benefits, TrendSpider customers also benefit from constant innovation.
You only have to take a quick glance at the TrendSpider blog to see how frequently updates are made.
The team does go to great lengths in order to help educate customers and help them become better traders.
As you can see, TrendSpider provides much more than just the best stock screener.
There are many different tools, strategies and capabilities that you simply won’t find on any other platform out there.
The best way to learn more about the platform is to schedule a free one-on-one training session where you can see it in action.
You can also check out TrendSpider University to access videos explaining each feature.
Alternatively, you can read through the documentation to explore the specific ins and outs that the platform has to offer.
If you have any questions, feel free to reach out to admin@colibritrader.com
Alternatively, you can sign up for a free trial to access the best stock screener and other cutting-edge tools.
Last but not least, check out the screener that I have created myself and let me know what you think about it :).
Thanks for sharing with everyone.
Please, I’m in need of some trade strategies. I would like you help me. Thanks
Can you be more precise? If you wish send me an email to admin@colibritrader.com