


The Best 8 Price Action Patterns

Price action patterns are a leading part of every modern trader’s trading arsenal.
In this article I will walk you through 8 price action patterns that have really made a difference in my trading.
I will walk you though the “BOSS” and “BEAR” patterns and many more price action patterns.
Let’s begin…
Contents in this article
Bullish On Strong Support (BOSS)- Price Action Pattern #1
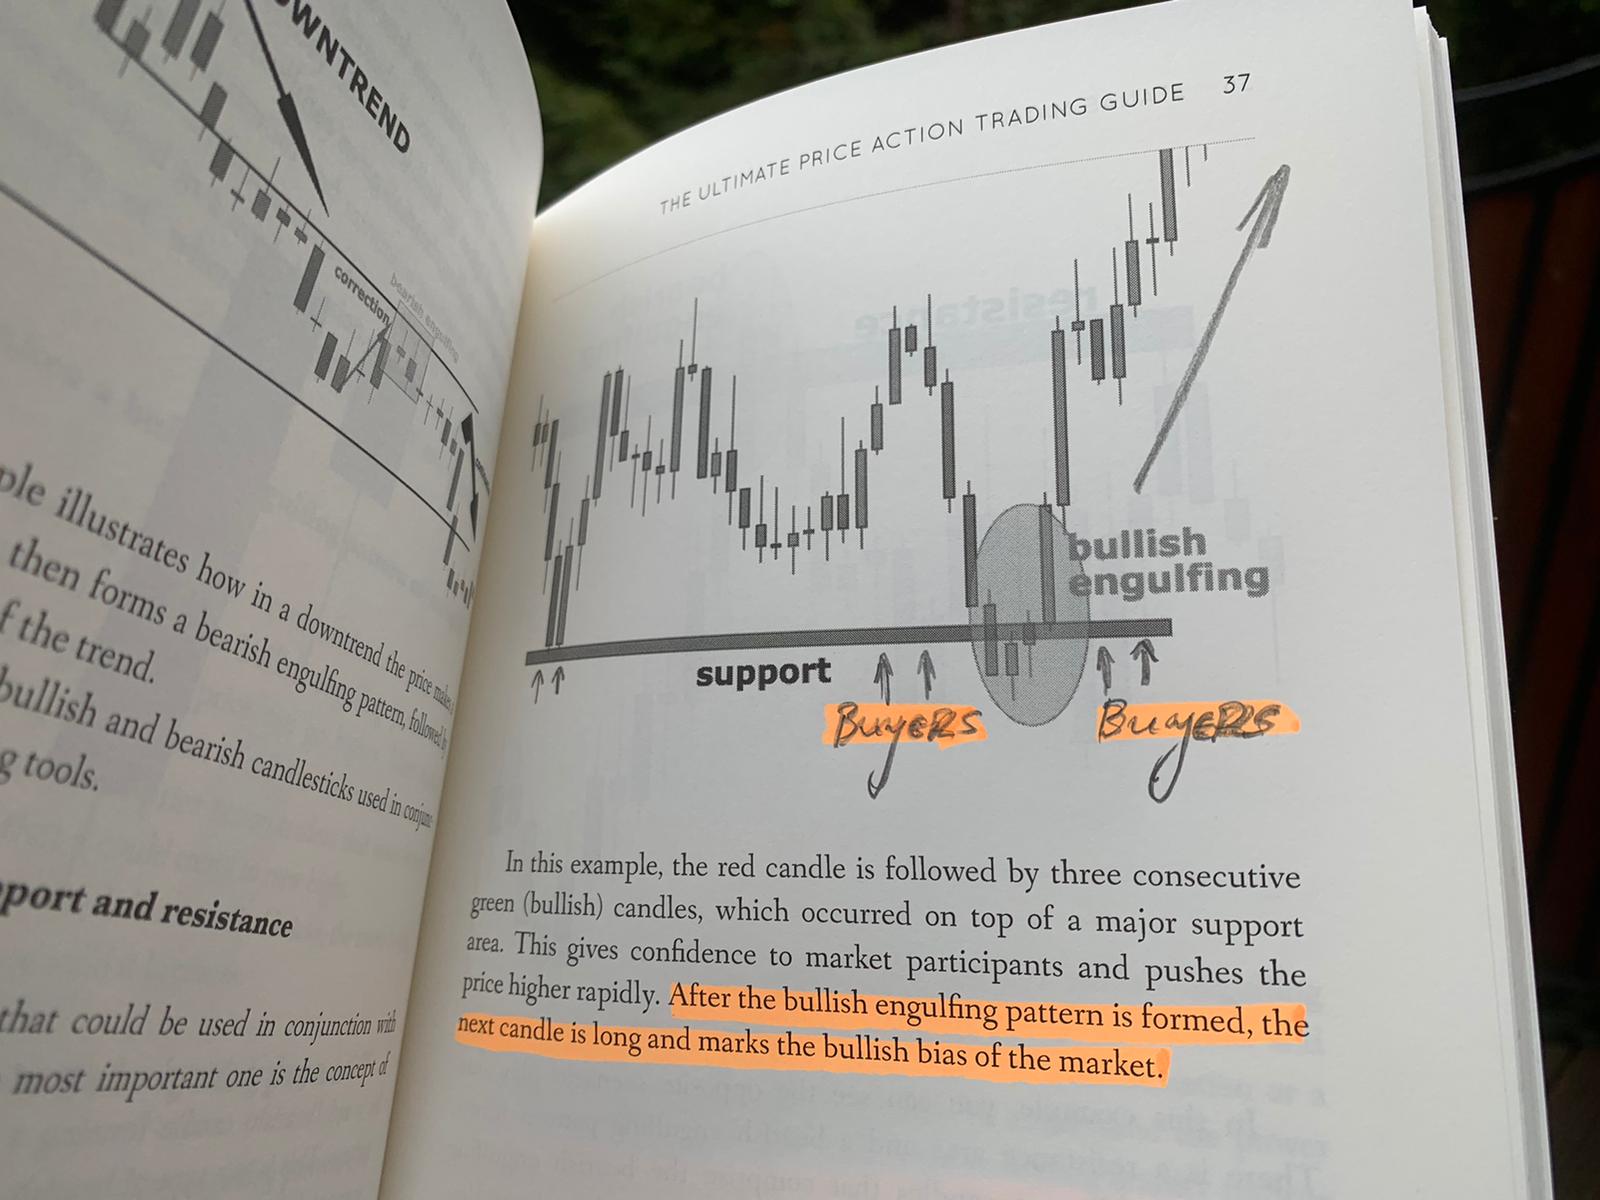
The first price action trading pattern is the bullish engulfing candlestick pattern that appears on a strong support level.
What matters here most is not the exact candlestick pattern, but the place it appears.
Ideally this should be precisely on the support level or slightly below it.
This pattern as the name implies (BOSS) is one of the best price action patterns in the history of patterns.
The image above is taken by my price action book and is one of the best to describe this pattern.
As you can see from the pattern above, after the BOSS price action pattern is formed price is skyrocketing.
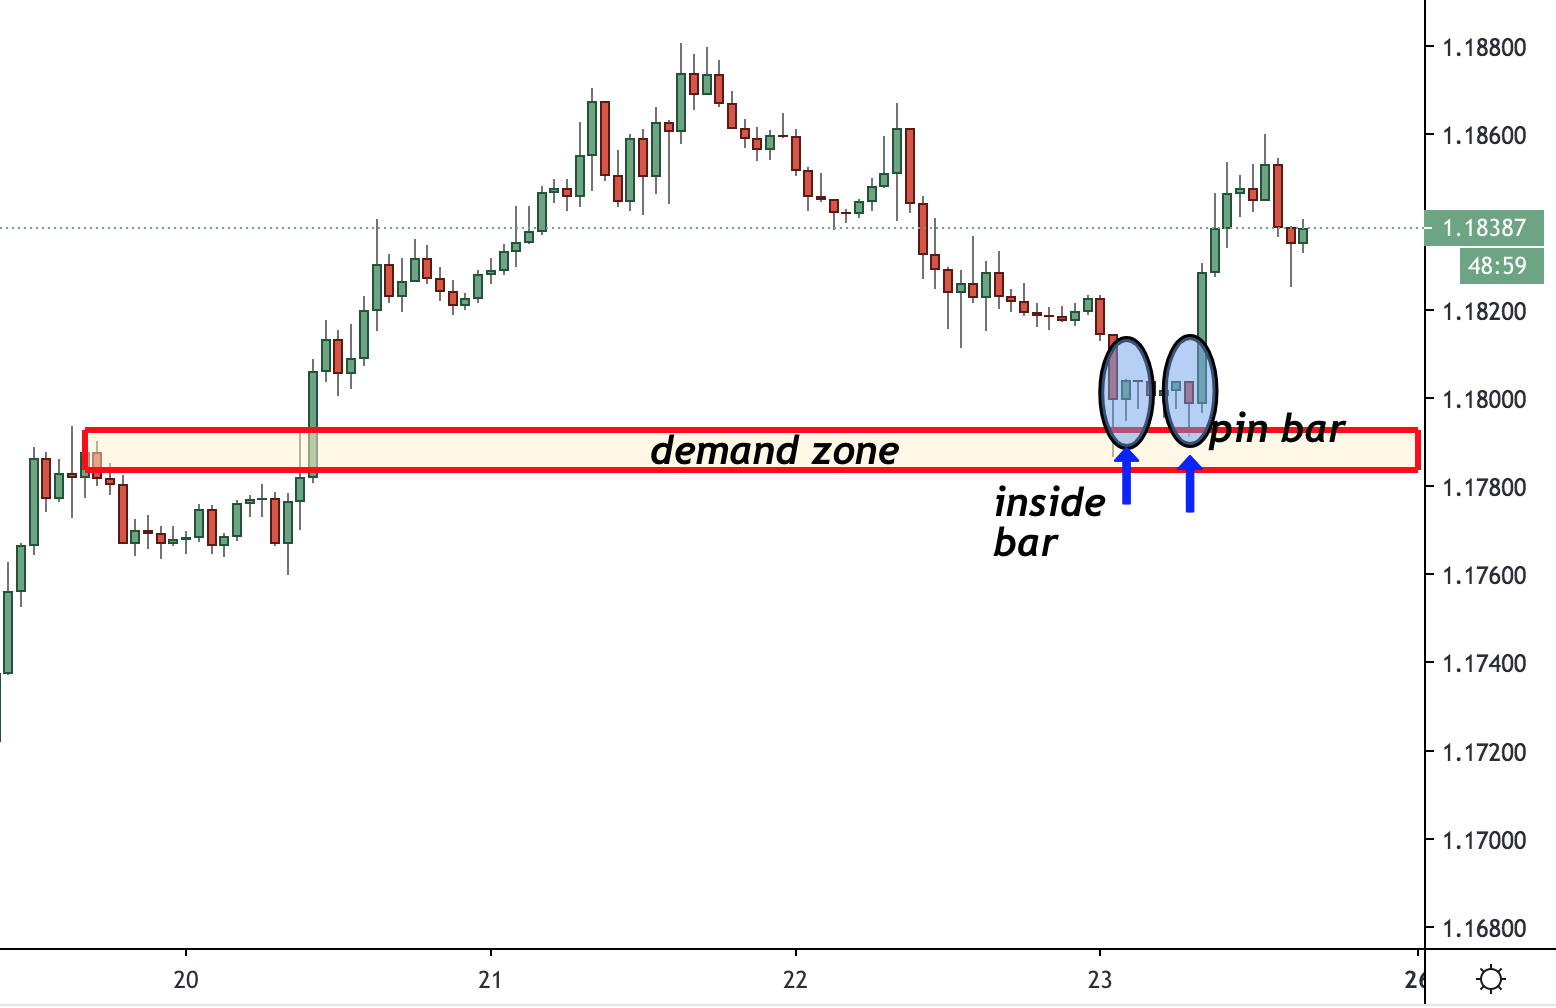
There are numerous other examples as such and a more recent one (time of writing this article is 25 of October, 2020) is the EURUSD BOSS price action pattern:
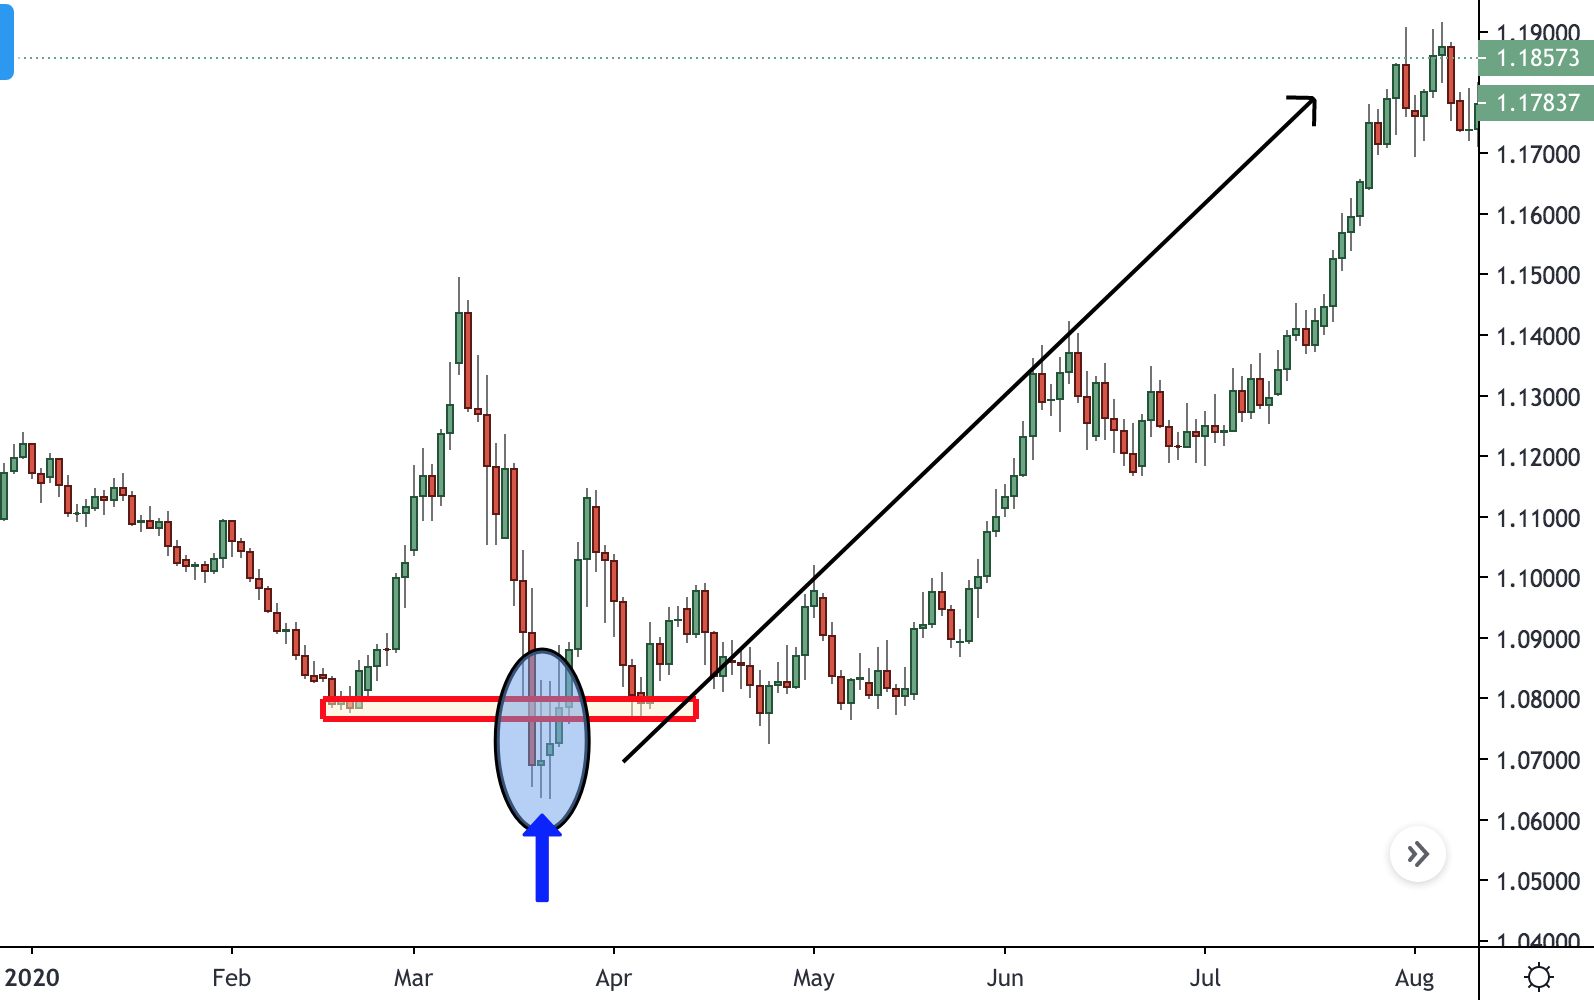
There is a major demand zone/support and when price tests it, there is an inside bar that forms and attracts a lot of market participants.
One of the reasons I did not want to call this pattern Bullish Engulfing on Strong Support is because any candlestick pattern could be the trigger.
Hence, the price action pattern is called Bullish On Strong Support (BOSS).
Bearish Engulfing on Aged Resistance (BEAR)- Price Action Pattern #2
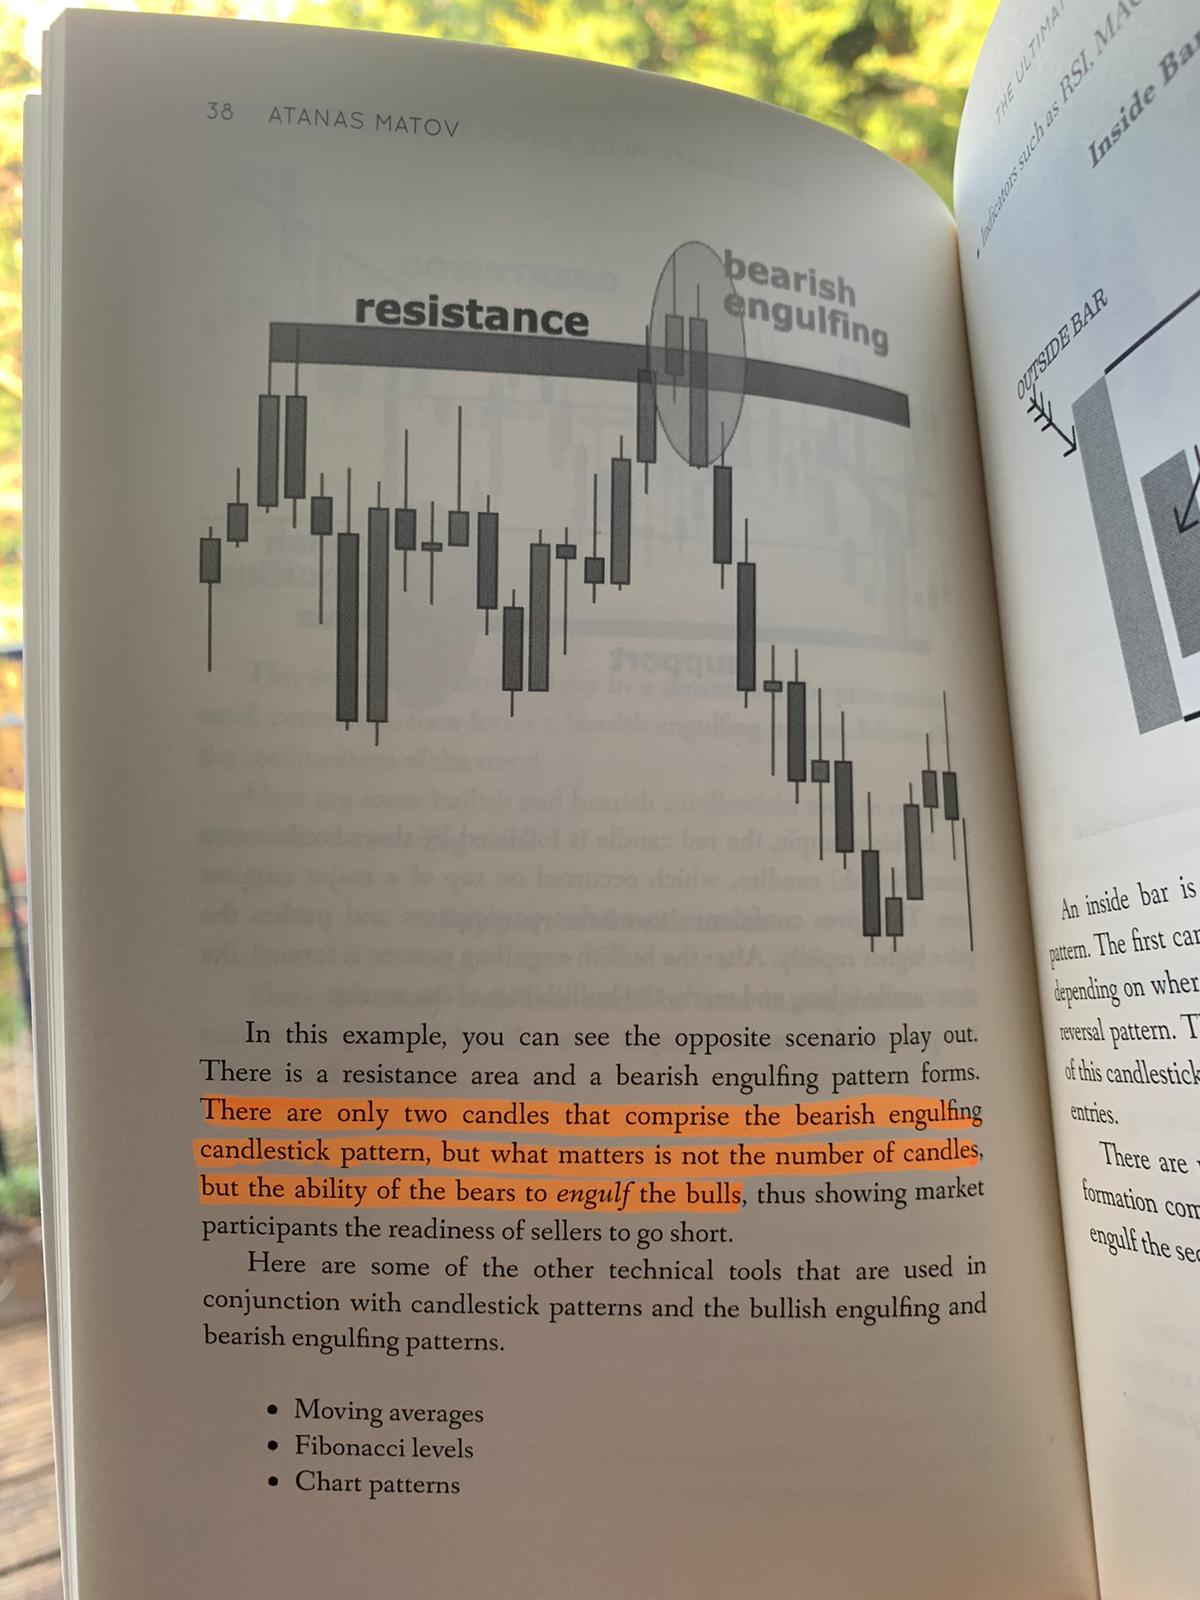
The next price action pattern is called BEAR or Bearish Engulfing on Aged Resistance.
What that means is that there is a strong resistance level or a supply zone that needs to be tested.
I have found that with this price action pattern a bearish engulfing is probably the best candlestick pattern formation.
The above example is also taken from my price action trading book.
But such patterns appear constantly in the long-term.
Here is another example taken from 2 years ago- GBPUSD daily chart:
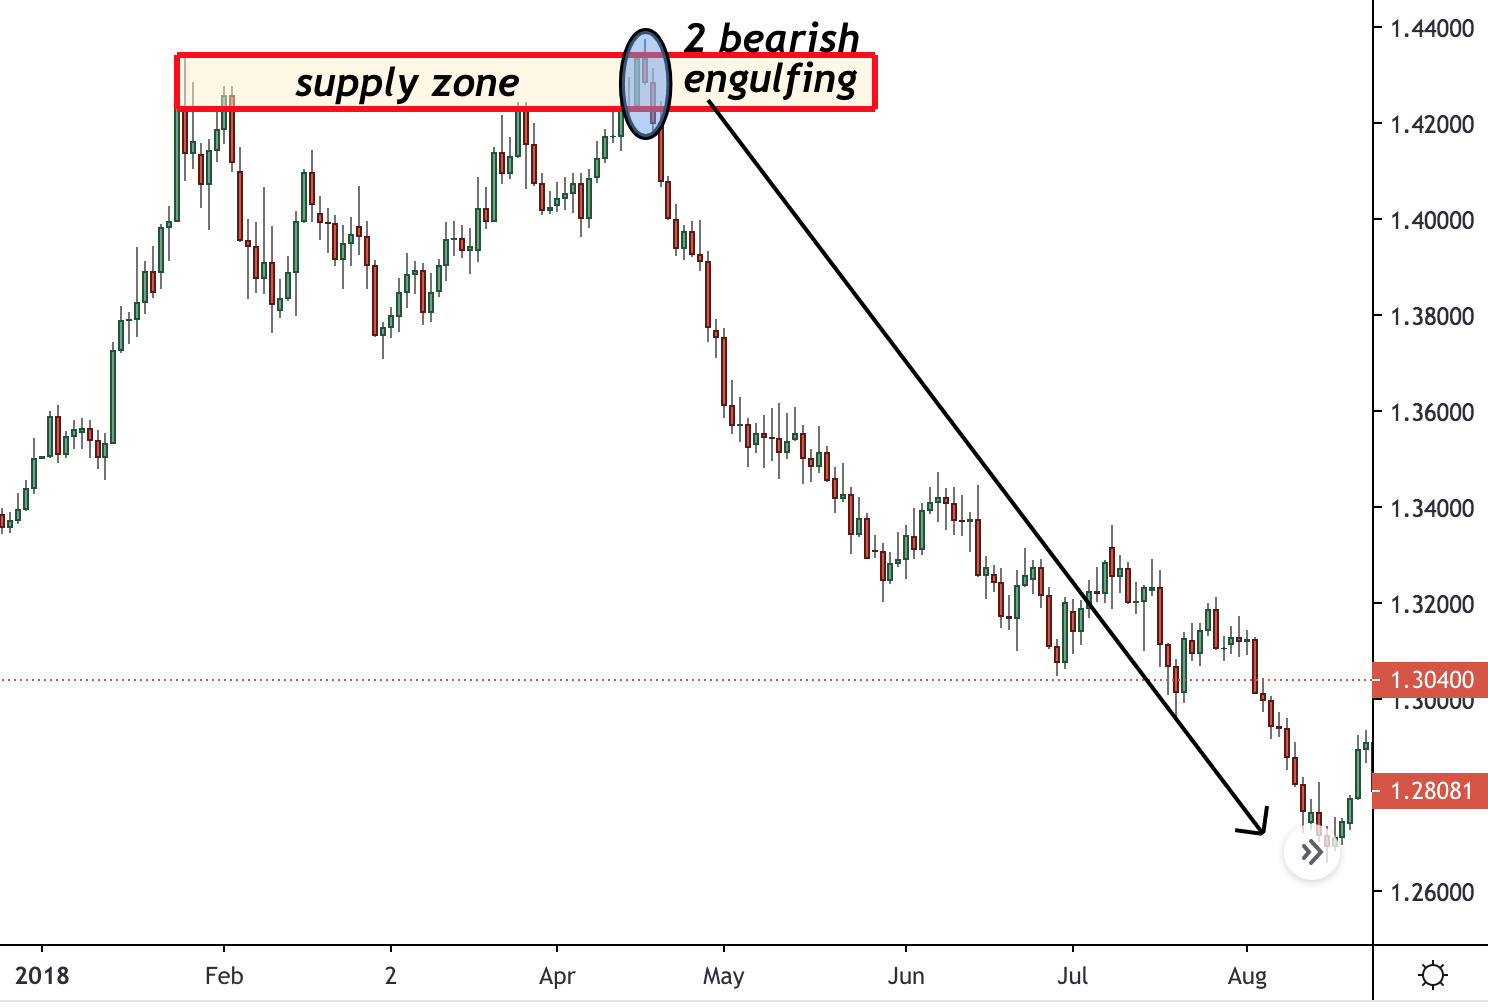
You can see that this 2-bodied bearish engulfing pattern has a very strong trend change effect.
The engulfing pattern can be composed of multiple bodies.
What matters is that the red candle(s) completely encapsulate the previous candle’s green body.
This shows readiness of the bears to help push the price in the other direction in the longer-term.
BEAR is one of the best bearish price action patterns that I have experienced in my trading career.
Inside Bar Within a Trend (IBWT)- Price Action Pattern #3
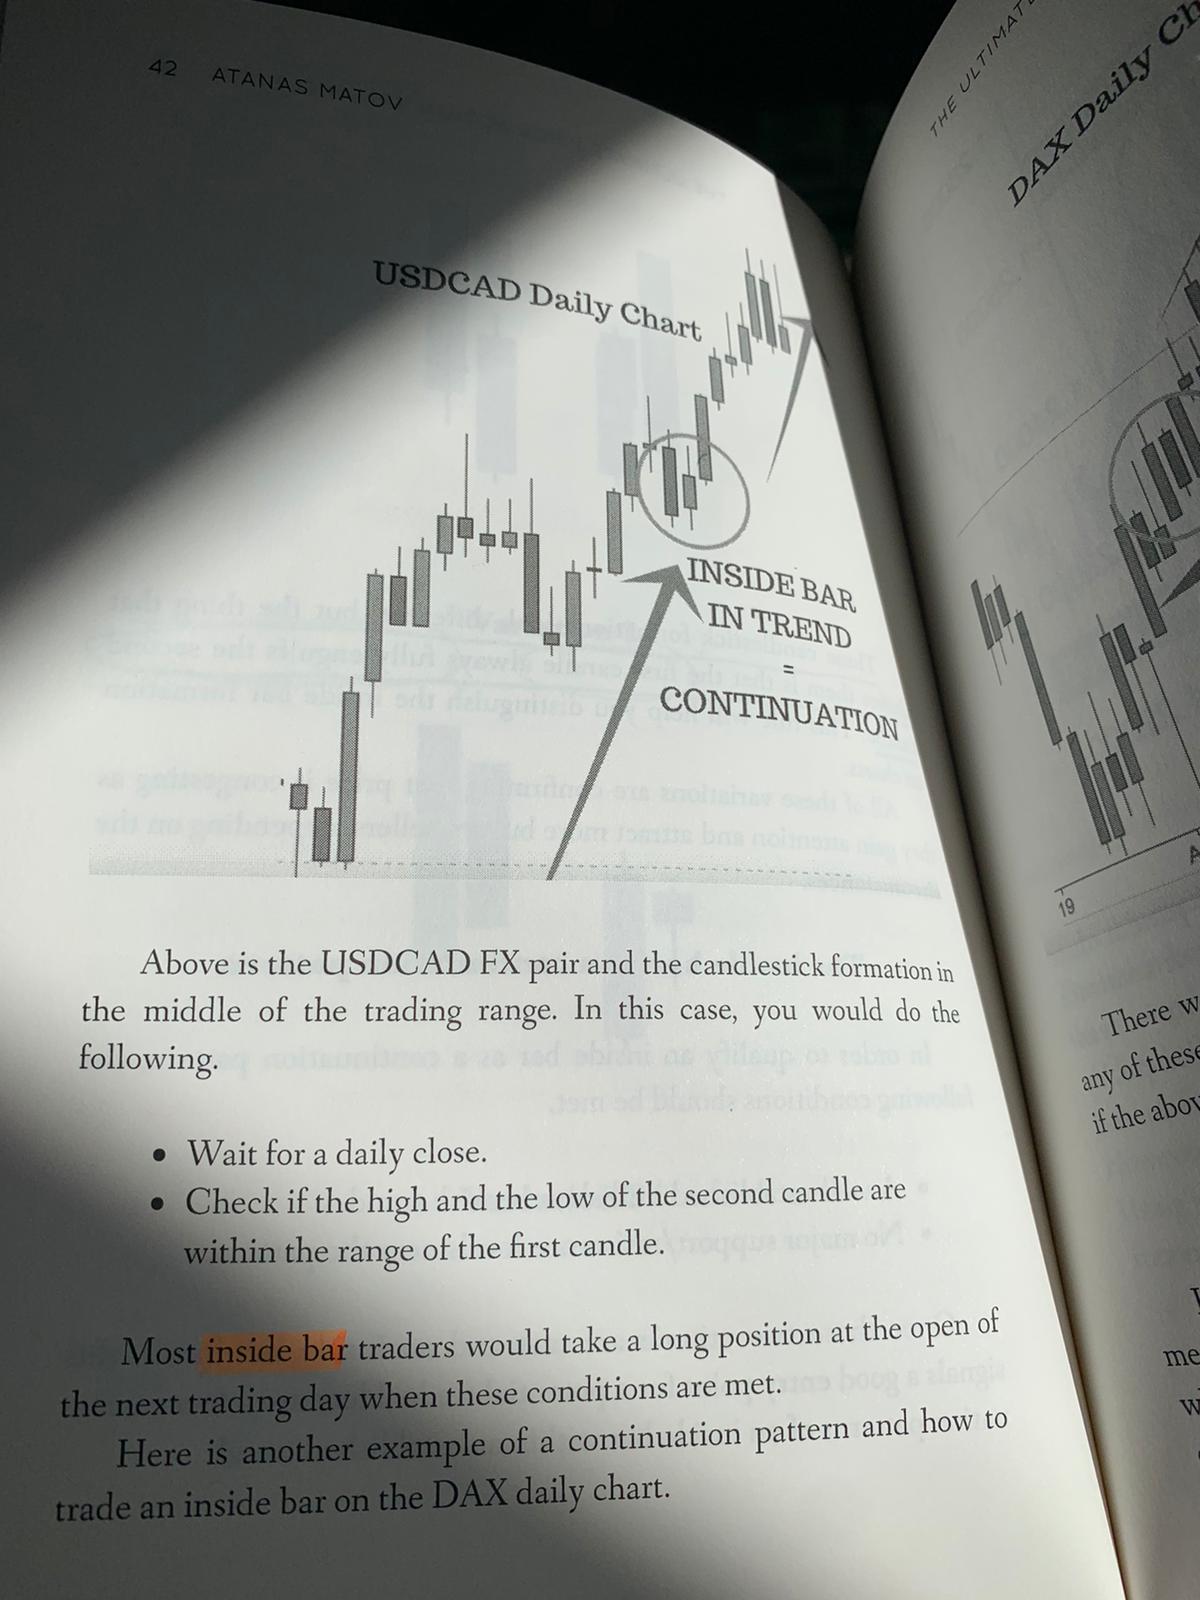
The next pattern is called IBWT or Inside Bar Within a Trend.
It is one of my favourite continuation candlestick patterns for 2 major reasons:
- Its reliability
- The great risk:reward ratio it offers
This is probably the best price action pattern when it comes to returns.
Let’s just pause for a second and see why is that with an illustration.
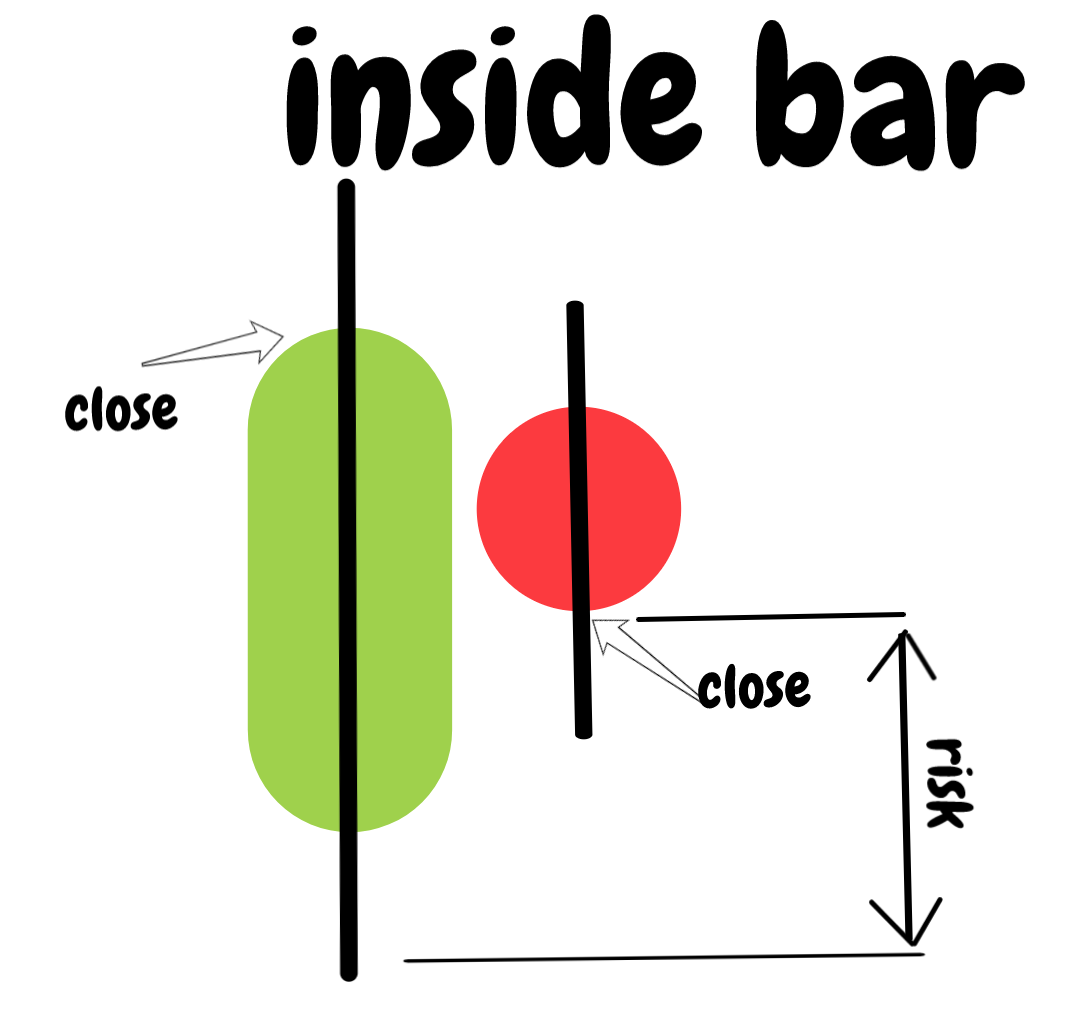
The reason why this candlestick pattern is having such a great risk:reward ratio is because the close of the small bodied red candle is very close to the low of the green candle.
This allows for a tighter stop loss and therefore a higher risk:reward ratio.
In layman’s terms this means that you can risk less money to gain more profits.
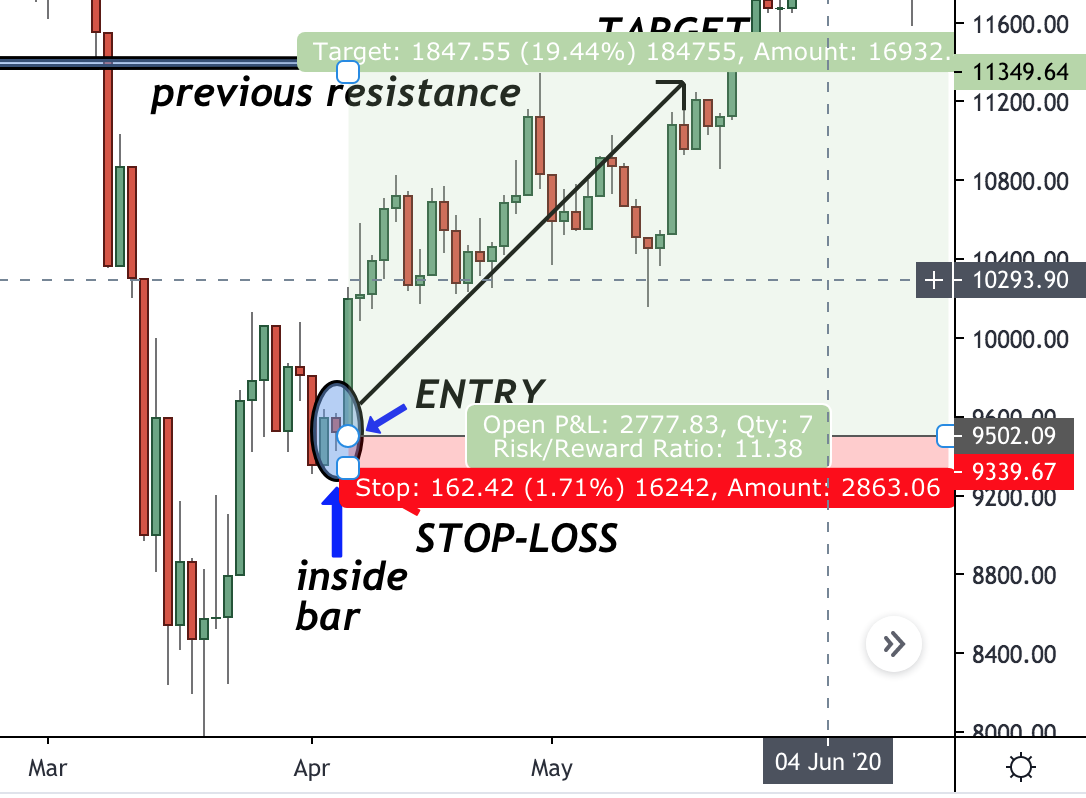
Here is another example of an inside bar from the Daily DAX chart:
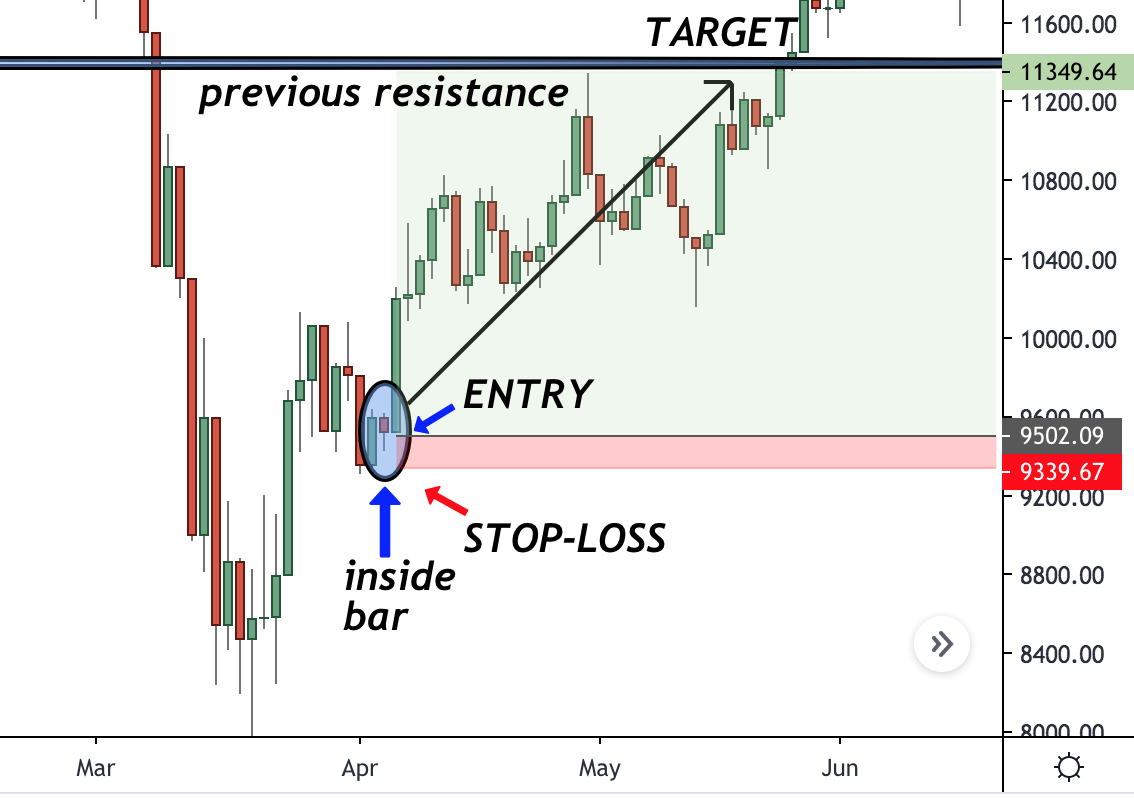
You can see from the screenshot above that the inside bar allows you to use only a small stop loss and aim for a larger return.
In this particular screenshot the risk:reward ratio is almost 1:12!
If your entry is at 9502 and your stop loss is at 9339, this means you are risking 163 points.
On the other side, your target is at 11349, which means the potential return on this trade is 1847 points!
This is really a stellar performance!
Risk:reward ratio is a whopping 11.38
Supply Zone Pinbar (SUP)- Price Action Pattern #4
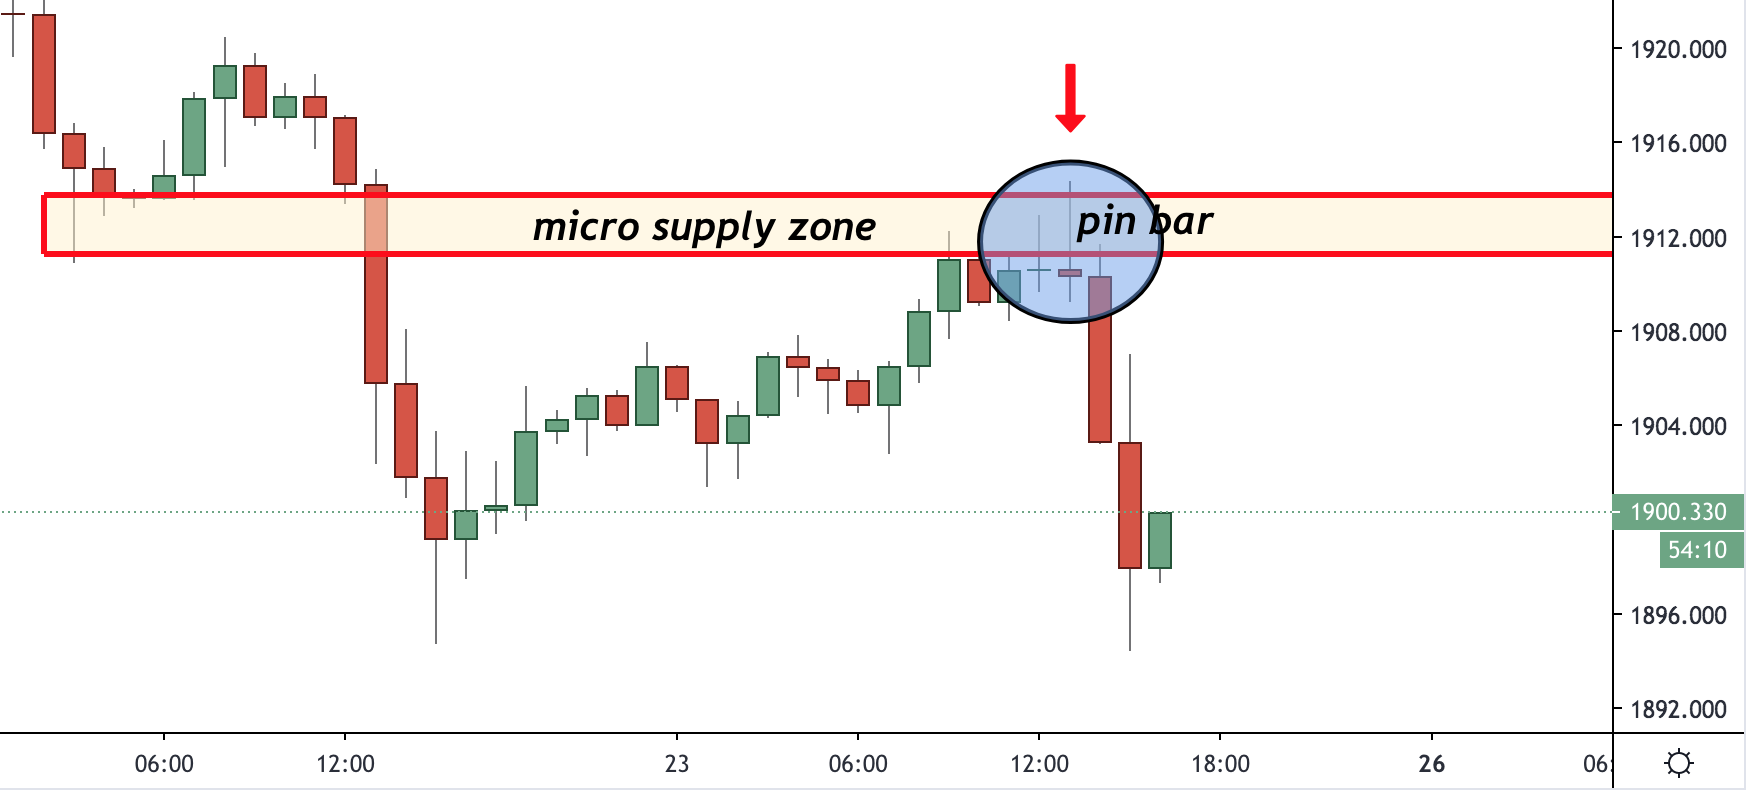
The above screenshot is taken from the Gold 1H chart from last week (23rd of October, 2020).
It is one of the most effective bearish continuation patterns.
In order to qualify for such, we need to have two things in place:
- Major/minor supply zone/resistance level
- Price action pattern rejecting the level
In the screenshot above there is a pin bar rejecting the important level of 1912.
In case you haven’t guessed it right, this is the hourly chart of Gold.
Once price goes up to the pivot level, it forms a rejection and then all of a sudden price drops.
You need to be fast to be able to get those trades.
As you can see the next candle is quite a large bearish candle.
Random Resistance Rejection (RRR)- Price Action Pattern #5
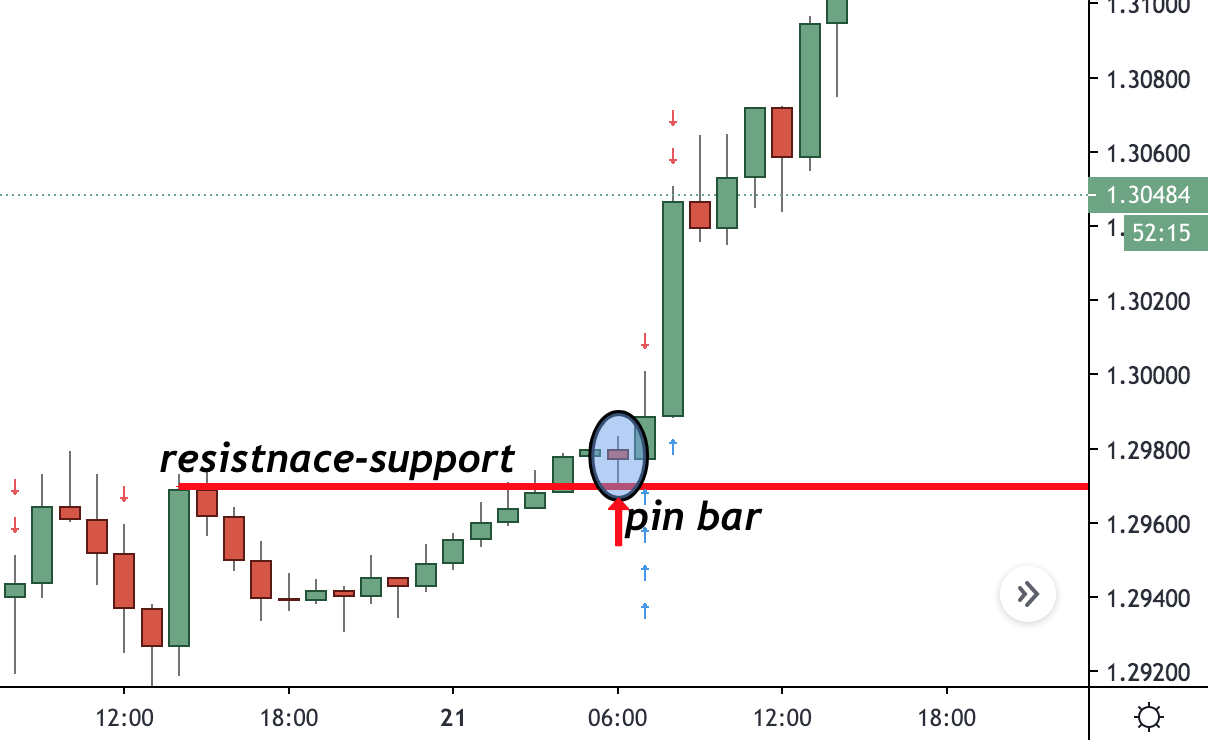
The above chart is the GBPUSD 1 hour chart.
It exhibits a price action pattern called Random Resistance Rejection of RRR.
The reason why it is “random” is because it could happen at any point in time and what matters is only the confluence of factors.
As with the previous price action pattern, the RRR appears in different timeframes.
Rule of a thumb says that the higher the timeframe, the more accurate the signal.
In this instance, we are observing a resistance-turned-into-support level and a pin bar rejection of that level.
Coincidentally, the daily candlestick is an inside bar.
I wrote about this trade on my blog HERE and I also traded it with my trading group.
This is a great example of a high probability trade.
Please do not confuse this pattern with breakouts.
Demand Zone Candlestick (DZC)-Price Action Pattern #6
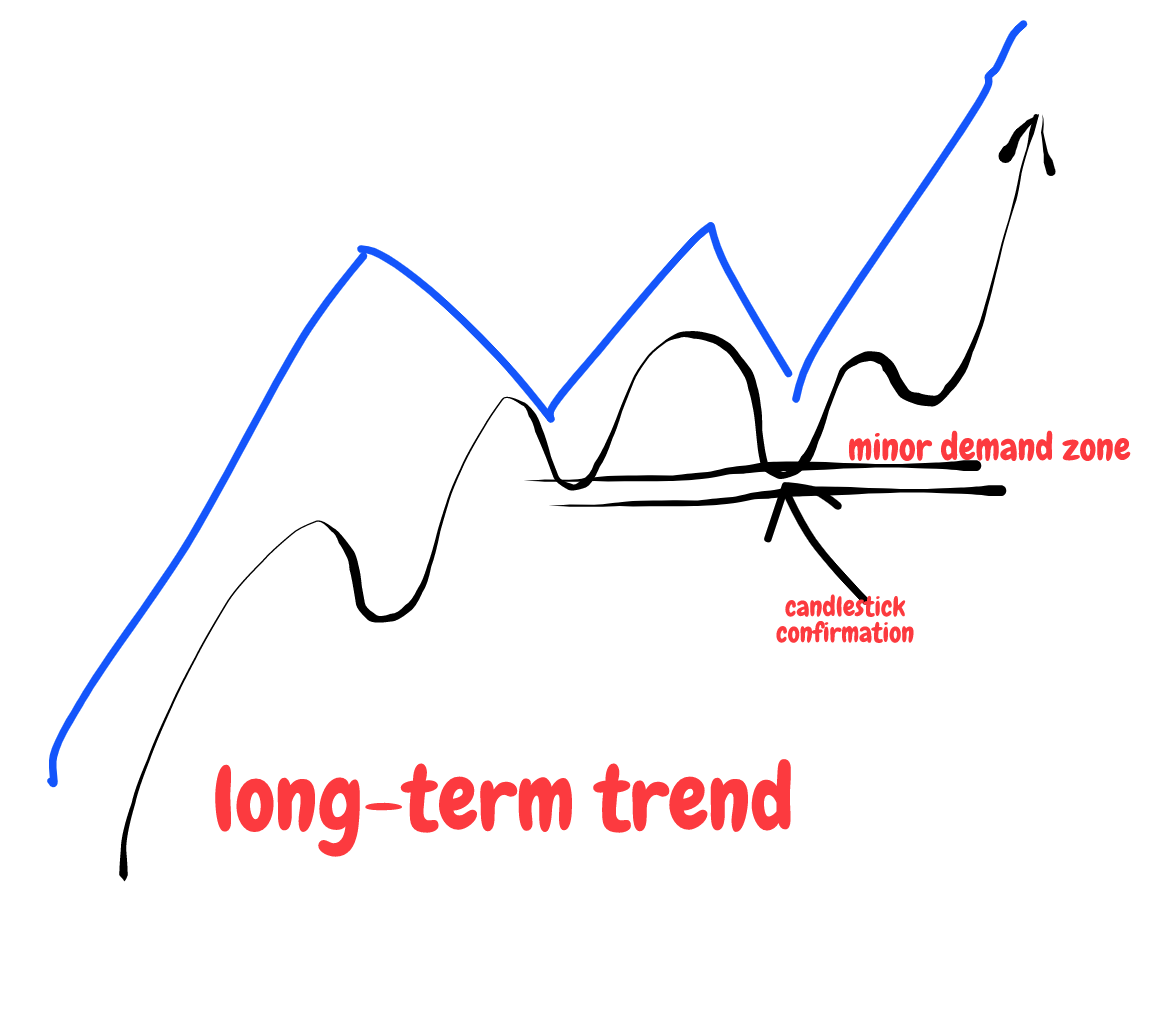
The next price action pattern taken from the hourly EURUSD chart is the Demand Zone Candlestick or also known as DZC.
In order to validate this price action pattern, two important rules are in place:
- Minor demand zone
- Candlestick confirmation
This pattern is very similar to the BOSS pattern.
The only major difference here is that it usually appears on minor and not major demand zones.
These are places on the chart where price is taking a break.
Imagine the following scenario:
As my followers know very well, I try to stay away from diagonal trendlines or channels.
I am only using horizontal lines on my charts and this is a prime example of what I am looking for.
Once I spot a minor demand zone, I am marking this on my chart and am lurking for the price to come closer.
When the price is “trapped” in the demand zone, I am just looking for a price action confirmation and then the rest is in my P/L.
This is probably one of the most powerful continuation techniques, which also allows you to have a very tight stop-loss.
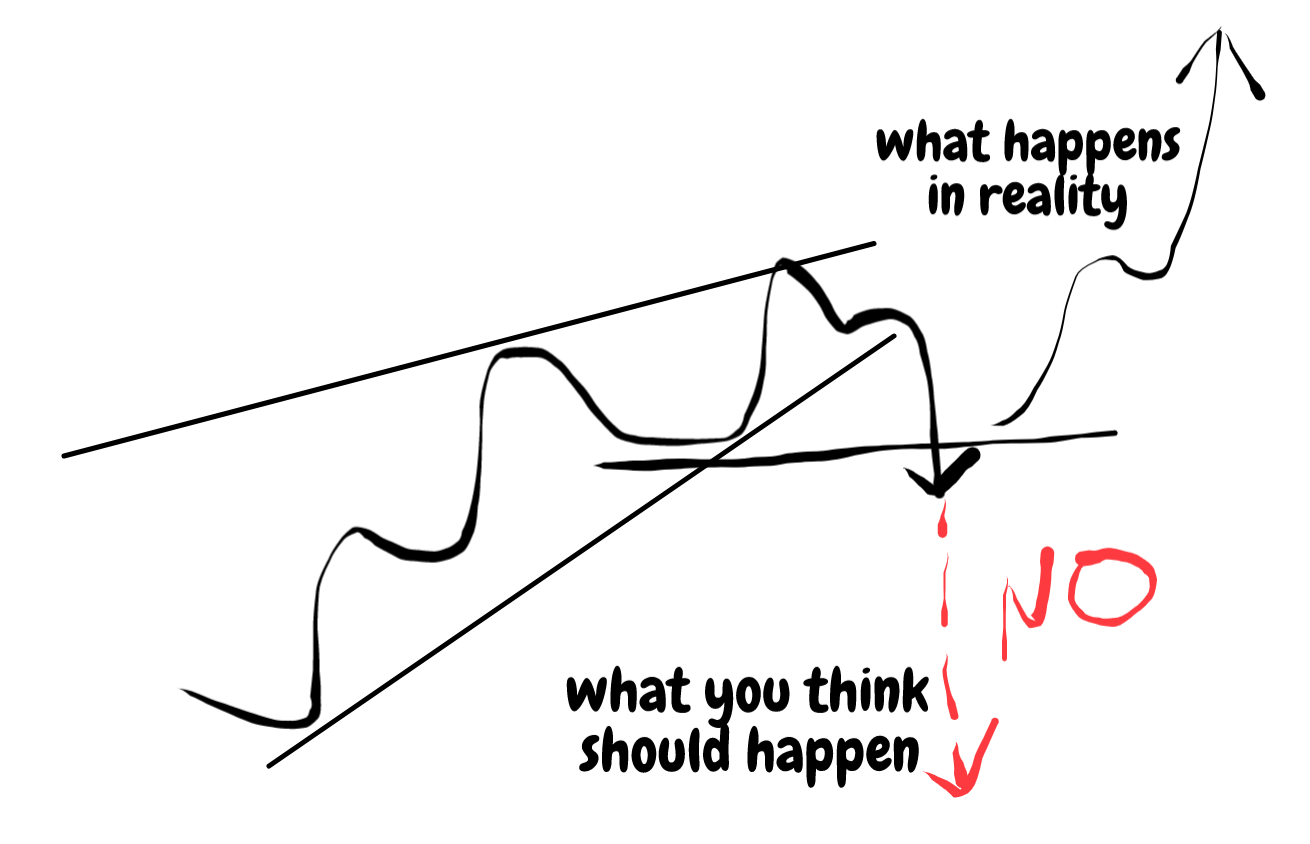
Theory Versus Reality (TVR)- Price Action Pattern #7
Patterns that do not work as expected or Theory Versus Reality (TVR).
A lot of traders blindly follow contracting triangles, but they are not as accurate as one wants them to be.
One of the beauties of the contracting triangle is that it is so easy to spot.
The problem with this type of setup is that because it is so easy to spot, a lot of traders will be trying to profit from them.
Since trading is a zero sum game, it does not allow that type of behaviour.
One of the problems of the TVR price action pattern is the following:
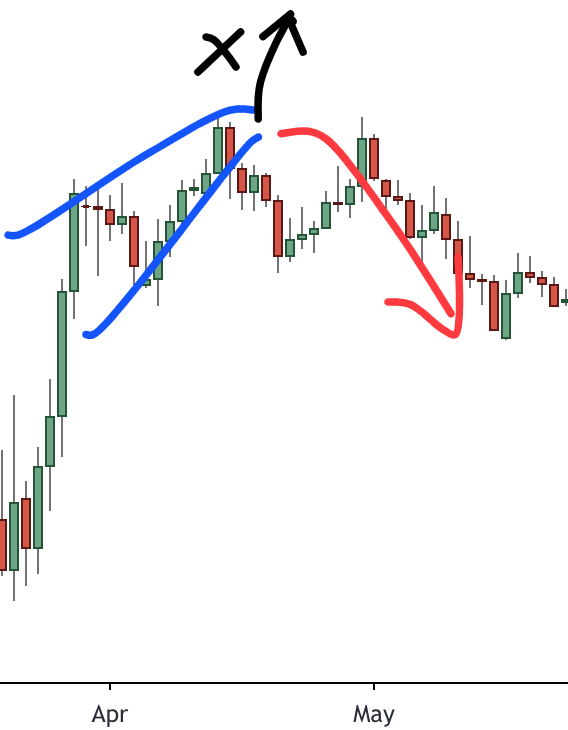
Whenever you spot this triangle, most traders would expect a breakout to the upside.
Alas, price takes the opposite direction.
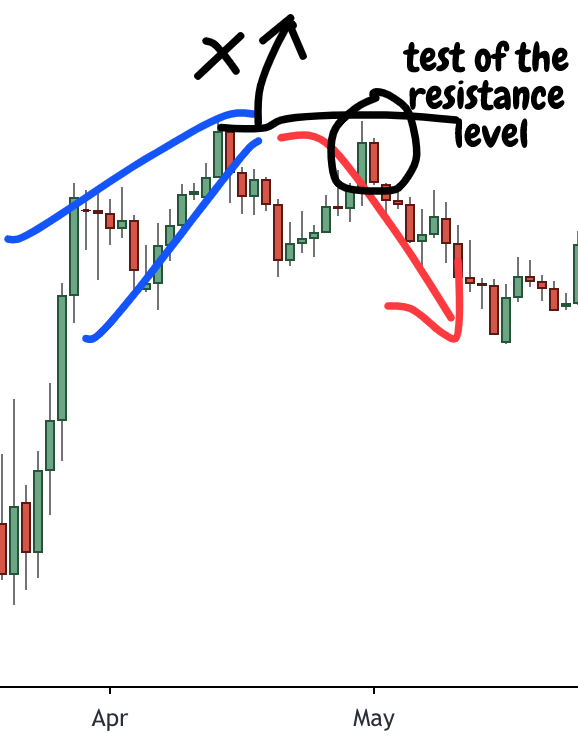
The reason why we are not seeing a breakout to the upside is because price is not strong enough to hold the test of the resistance level and starts a decline.
Before the decline starts, an inside bar is also noticed.
FYI, this is the daily GBPUSD chart.
Theory Versus Reality 2 (TVR2)- Price Action Pattern #8
We have finally reached the last of the price action patterns.
This does not mean that we have depleted the whole range of price action patterns.
That list of 8 price action patterns is just an indicative selection of some of the patterns I am using in my daily trading activities.
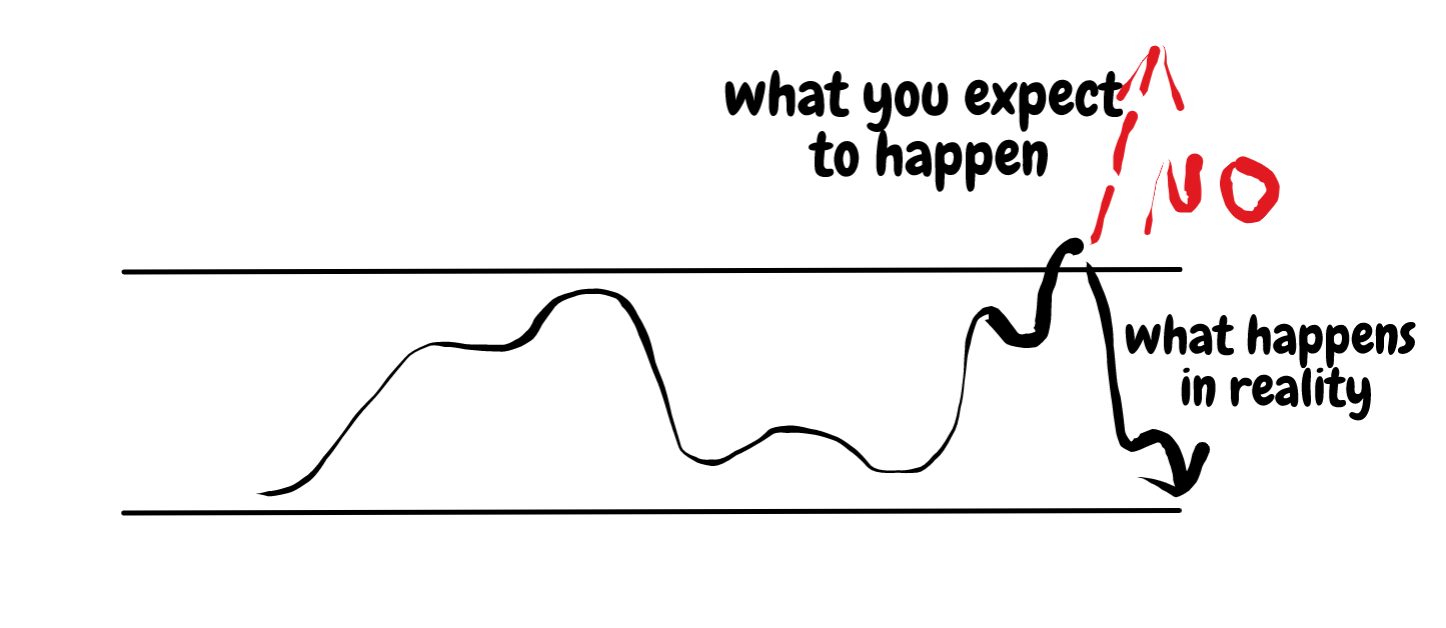
So, what can we expect from this price action pattern?
We have a tight range and are expecting to see a breakout.
Traders fall into this trap very easily.
They start buying more eagerly the closer the price gets to the resistance level.
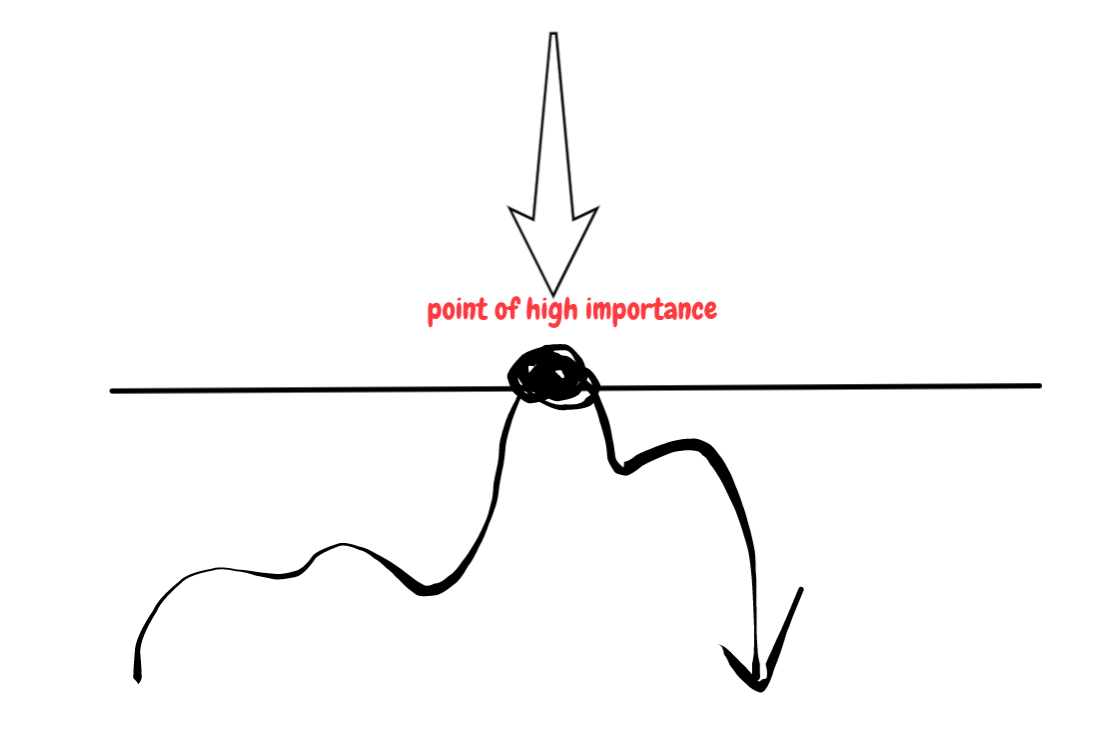
Let’s show this with a sketch:
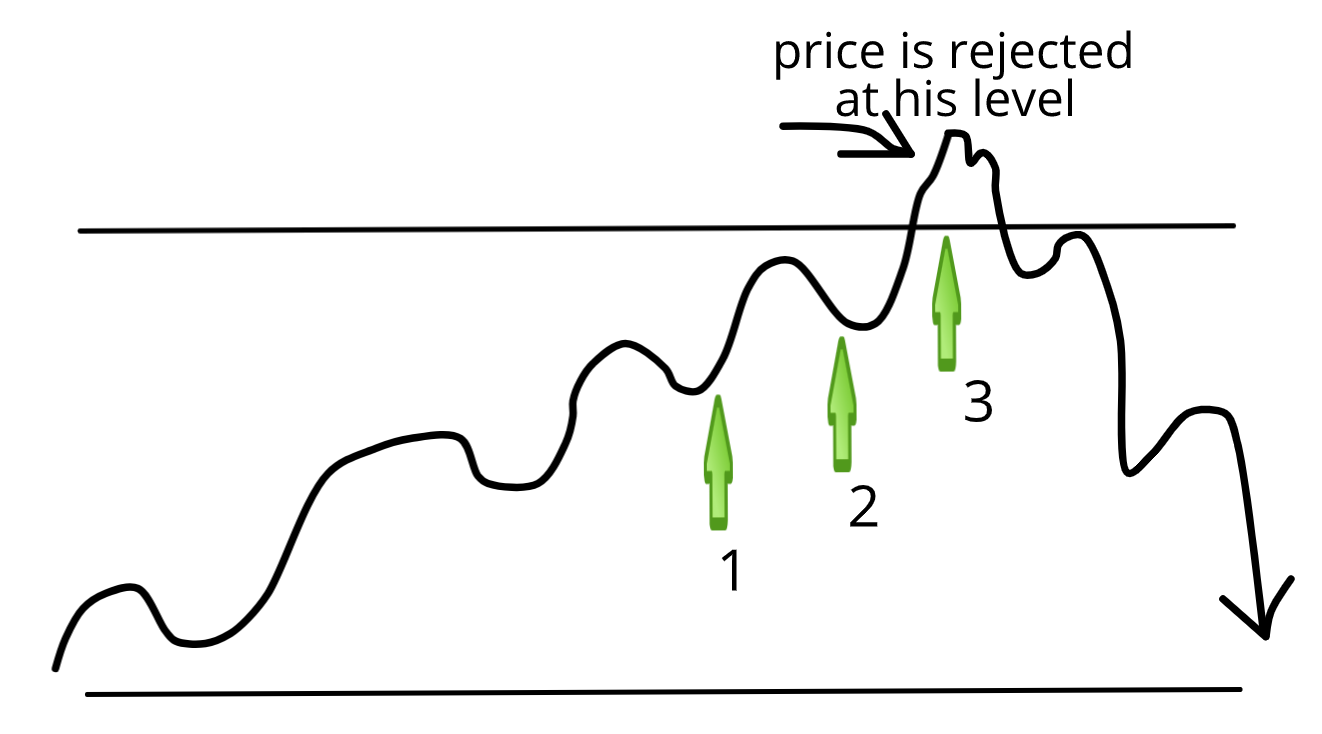
Here are 3 levels at which newbie traders will be looking to go LONG.
- Price is just above the middle of the range, I should go long before it is too late
- It is just below the resistance level and I am scared that I will be too late if price shoots too fast
- Finally price has just moved past the resistance level, I do not want to miss this trade
This is the typical way a retail trader trades.
It is a trap, which you should try to avoid.
The closer you get to the resistance level, the higher your stop-loss needs to be and paradoxically, the higher the chances of getting burnt are.
If only you could see this trade reversely.
Think of it this way- the closer you get to the resistance level or supply zone, the readier you should be to short.
Let’s take a real example from USDCAD 4H chart:
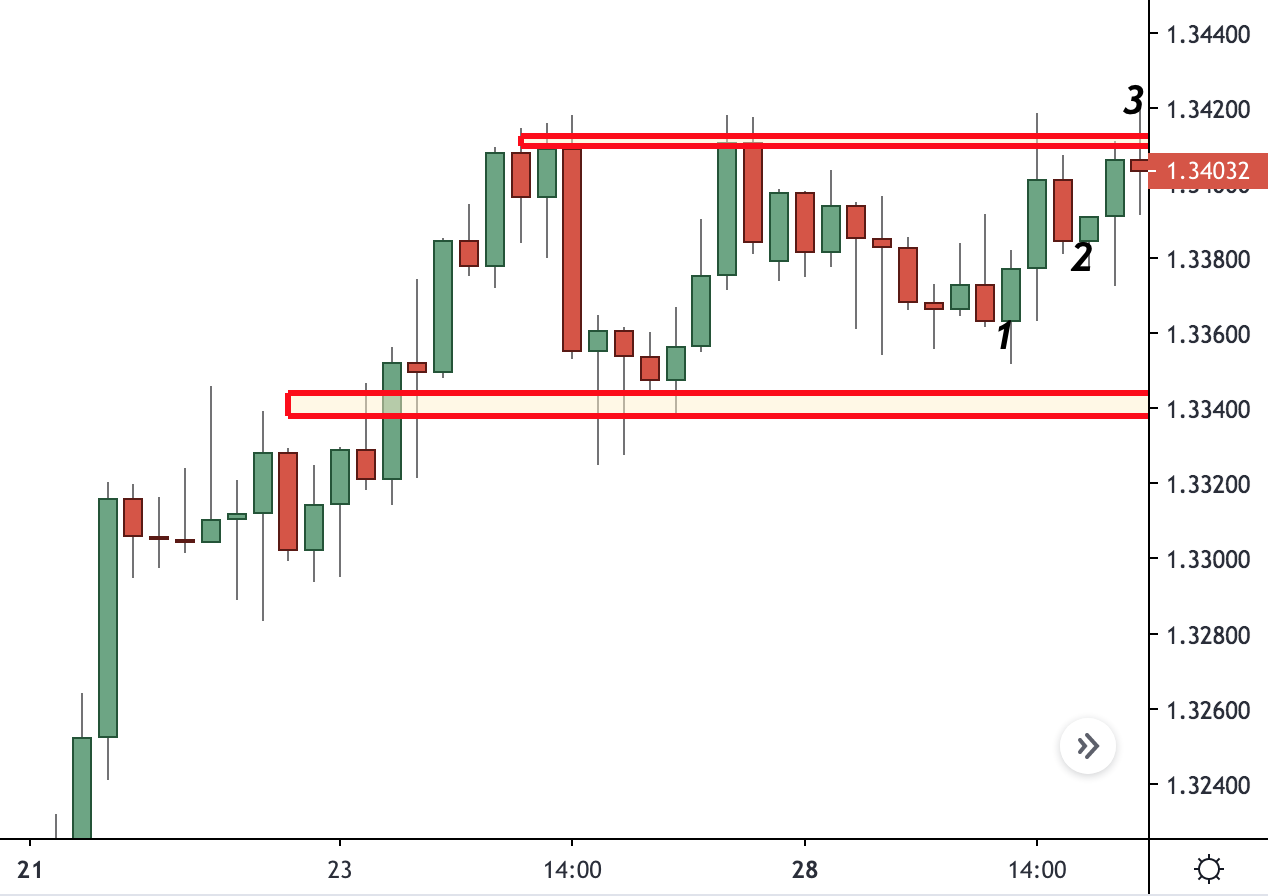
And here is what follows:
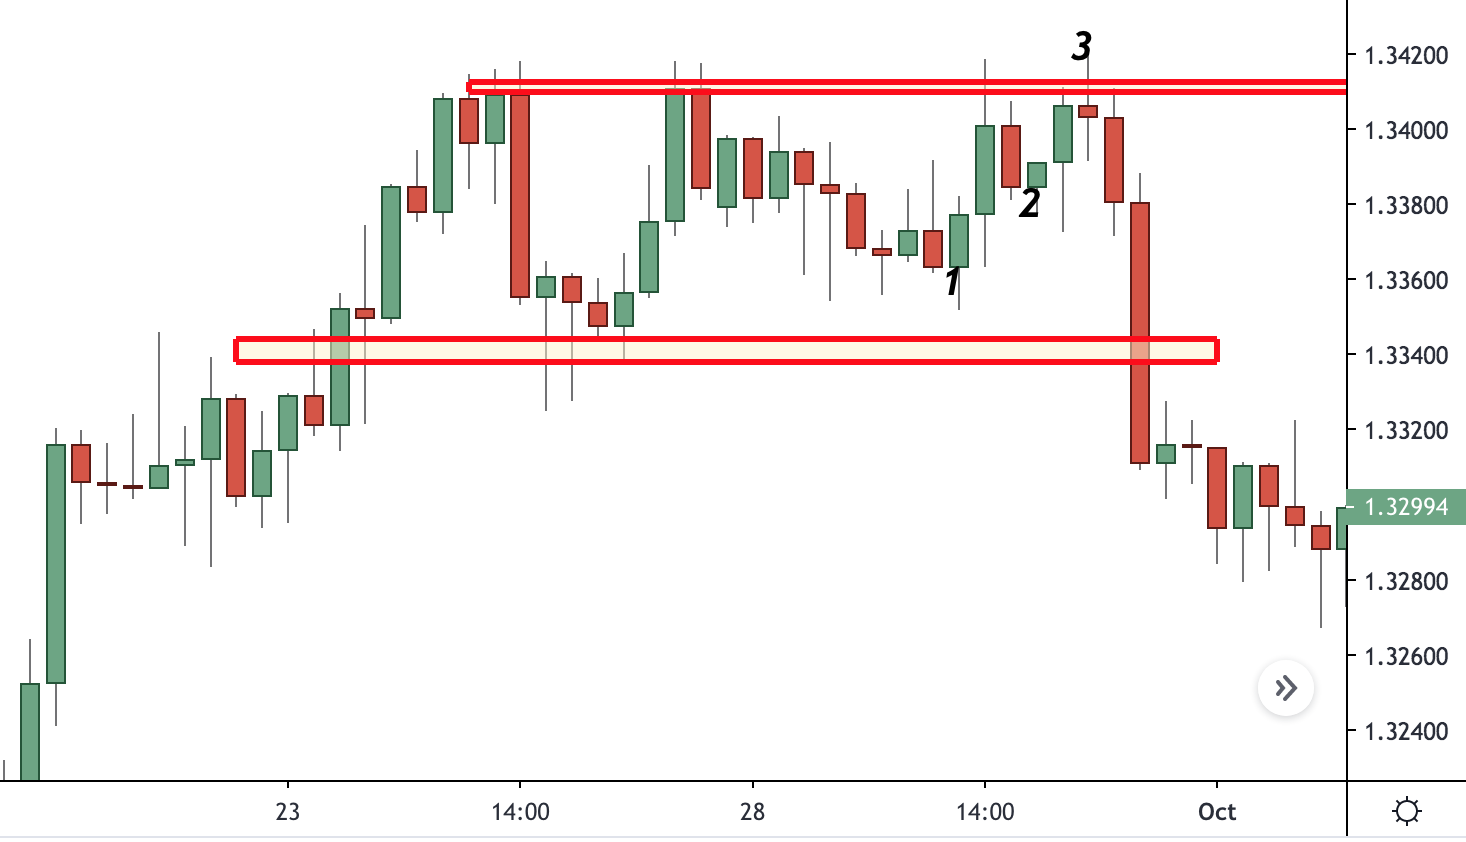
Too bad you were not shorting instead of buying…
Conclusion
In this article I have laid out 8 price action patterns.
They all have their pros and cons.
What one must really consider though is the risk involved with each of those price action patterns and the potential return.
These trading patterns do show us that it is very easy to fall prey into the trap of the volatile markets, so therefore we must strictly follow our rules.
Trading is probably the best discipline to test your discipline!
Bear this in mind and do not rush into this field with overly hyped expectations.
If you want to be a consistent trader, it will take a lot of time, discipline and dedication.
Happy Trading,
Colibri Trader
Awesome information
Thank you Robson!