


Textbook Example of a Trade- DAX (Germany 30)
Textbook Example of a Trade- DAX (Germany 30)
by: Colibri Trader
Dear traders,
Today I will walk you through a textbook example of a trade. It is the last trade I took on DAX. You can see more about the history of this trade HERE and HERE. As requested by one of my keen followers, I am creating a separate article to walk you through my last trade(s) in more details. I just want to warn you that for those that have not taken my professional trading course, some of the steps might not be really clear. I will try to be as descriptive as possible, but cannot really explain over 180 pages of trading manual and 24 videos in just a single article. Let’s see what I can do to better explain…
The Beginning
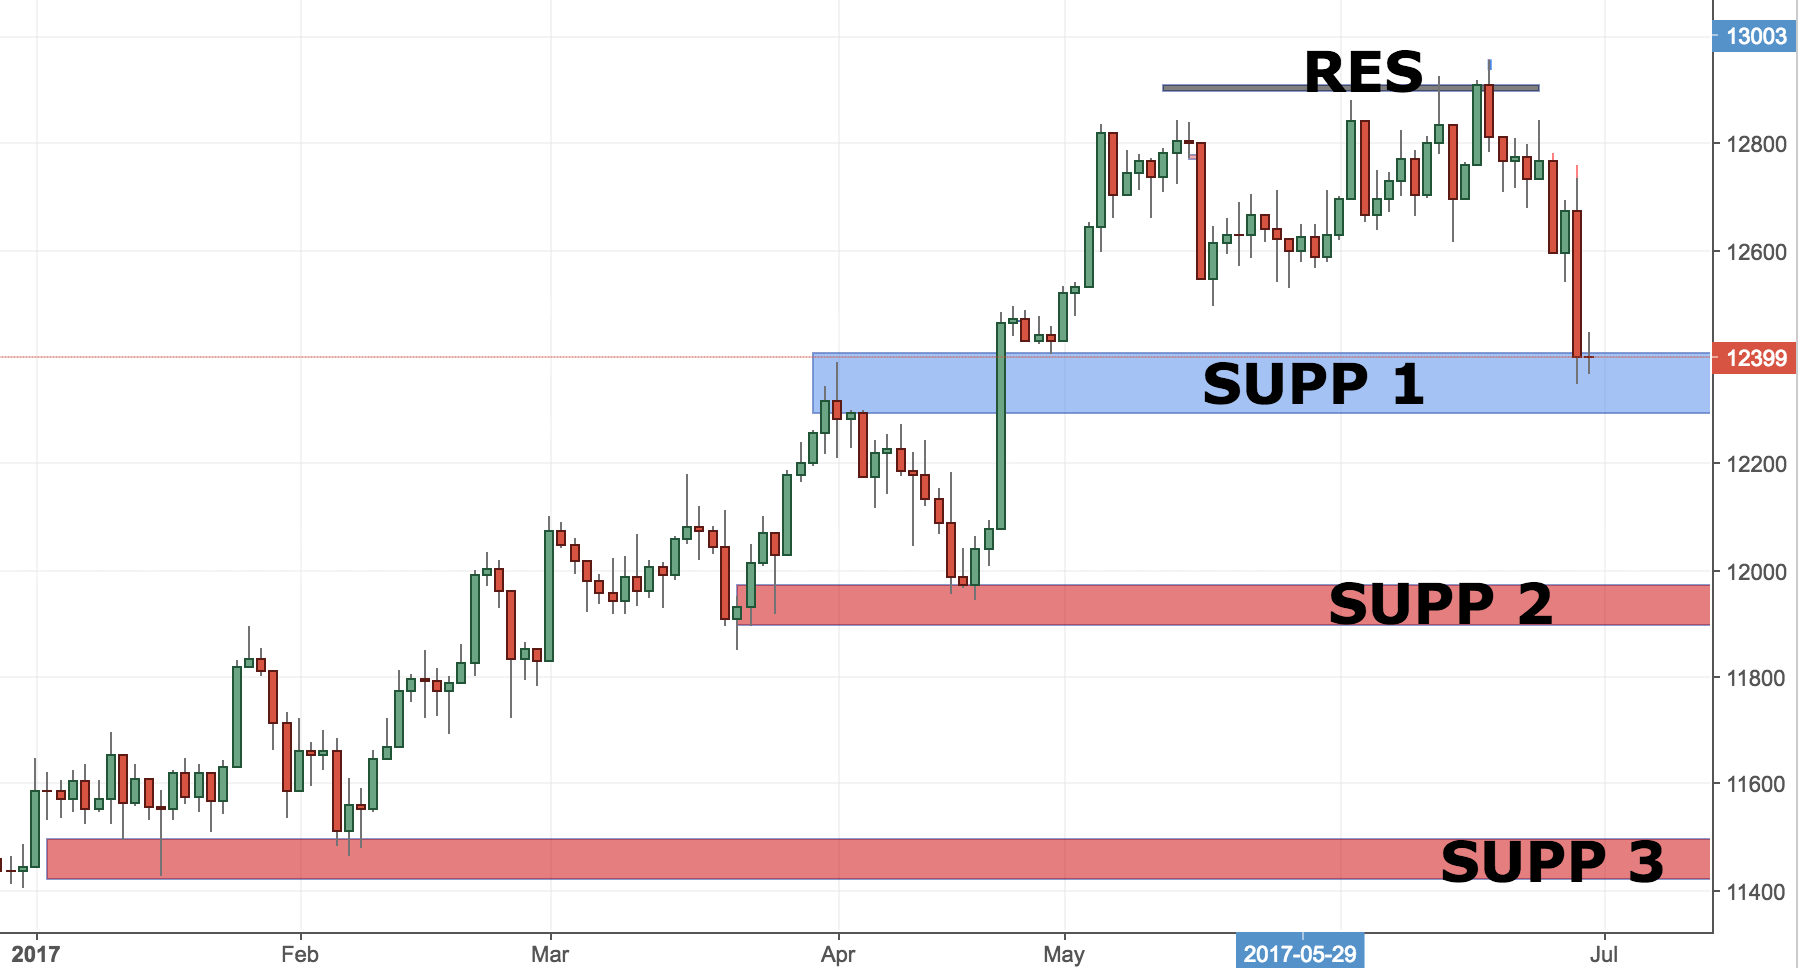
I started looking to enter in the DAX trade around the level of 12,900 (major resistance area). As you can see from my first setup HERE there was a pin bar that formed on the daily timeframe. That was the moment that I started closely inspecting the 4H chart as I have outlined in my trading strategy. 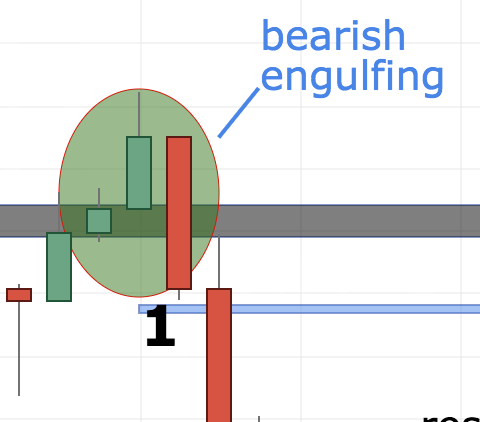
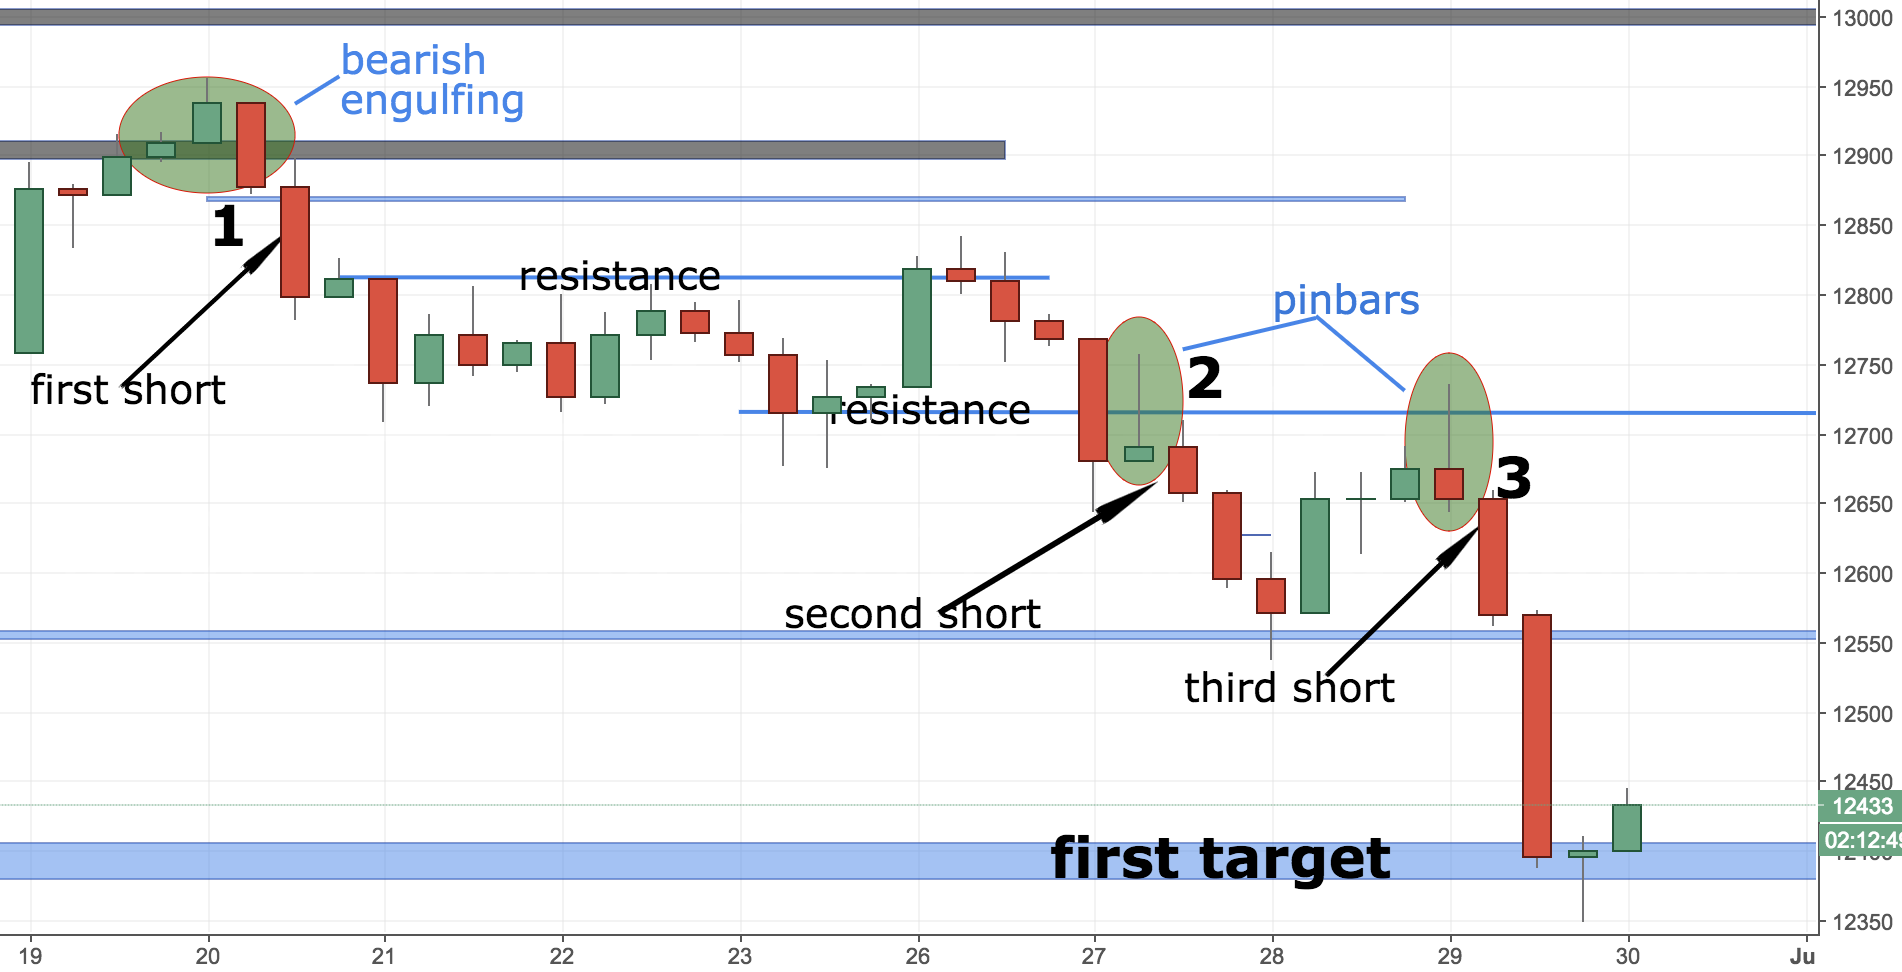
This happened at the moment that I have marked with “1” (20th of June). There was a bearish engulfing pattern that formed just above the resistance area- a wonderful sign of reversal. I entered in my first trade at 12,869. My stop-loss was placed just above the nearest swing high. Then I closed the charts and went for a walk…
Second Trade
The second trade (27th of June) took place after the formation of the pinbar market as “2”. There was a minor support/resistance area at 12,720. The bullish rejection that the pinbar showed meant more buyers were quitting the game and sellers were joining. 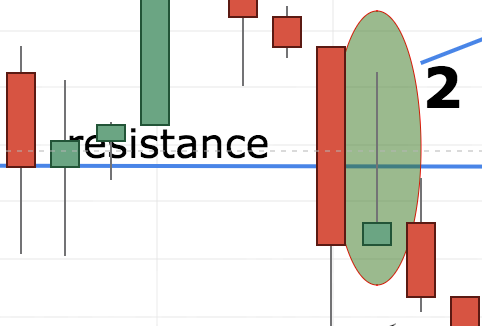
I started looking at the level of 12,550, which was the closest support area. Fortunately, the major support level was around 12,340. That is why I continued holding those trades- mostly because there was not a major reason to close them. From this moment, I started looking for a retracement and another opportunity to scale-in (or add another position). This opportunity came on the 29th of June.
Last Trade
The last trade came when the price retraced back to the nearest minor resistance area at 12,720. That happened on the 29th of June. There was another pinbar that formed just below the resistance area. Price action showed again to be on the side of the sellers. 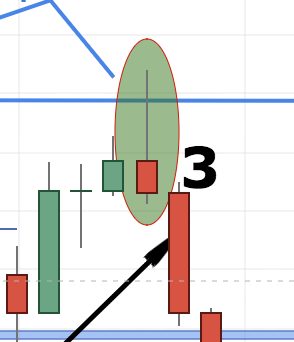
As marked with “3”, this trade was triggered in the upper half of the long red candle.
Note: Bear in mind that all of these screenshots are taken from the 4 Hour timeframe
Take Profit
Currently the price is trading at 12,280. My initial target was around 12,400. I would ideally like to see the daily timeframe showing a price action indication that we will see a pull-back or a continuation of the up-trend. Price is on a major crossroad at the moment and it could make a great difference taking profits here or letting the position run. If price manages to break below the 12,400, this might turn into a major reversal. It is still early to say and it all depends on how price will behave around this level. A possible scenario I see at the moment is the price retracing back to 12,550 and then showing another rejection that will lead to further sell-off. For the time being, I would like to wait for a daily close to make a better decision.
Note: Bear in mind that keeping DAX positions open over the weekend might lead to a huge gap due to the high volatility in DAX.
Conclusion
Instead of a conclusion, I would like to post the daily chart of DAX. I will keep this in front of my eyes and checking regularly to see if we are getting a bearish rejection.
p.s.
If you are interested to know about the strategy I have been using to enter in these trade, check HERE
or check out this article to know more on how I use Support and Resistance
Hi colibritrader,
Thank you for producing this article.
It is as you say textbook and simple in it’s approach all according to the way you teach in your course
The trend kept on trending so you stayed in and added because you were aware of where the S & R levels were and watched p/a for a signal.
It is just like your course illustrates,
I sincerely appreciate your time helping us see a trade through your eyes.
Regards
hi dan and colibritrader,
there is this “no greed ~ no fear” thing
by taking more position as taught, i simply hesitate as it may shake my “no greed ~ no fear” thing.
i may still need time to make this technique to my “no fear ~ no greed” zone…
harry
Hi Harry,
In my opinion it is all about the practice. Maybe you need more time, which is perfectly fine. Just don’t rush it and try to stay away from costly mistakes. There will always be tomorrow, right?
-Colibri
Thanks colibri, I’ll use the demo for practicing this advance technique, you’ve shown it works, I need to get used to it – so i have the gut, so far no gut yet 🙂
Yes- that is a great idea. Every time you are slightly hesitant about your trading, you should always go to the Demo and practice there. Don’t risk real money if you are not certain what you are doing or confident about your skills. Money is your only asset in this profession
Hello colibritrader,
I have some questions about thie p/a outcome for the Dax. As per your very 1st alert June 15th you kindly put together an alert article showing a bear engulf on the 4 hr. The resultant p/a was a move down “but” then a rally higher into June 20th. This is where the real top was put in. My question is what happened psycholgically for the price to move down 1st but then be bought then one more rally into June 29th.
EG: was it retail traders buying one more time getting caught in the dax bullishness euphoria ? or was it genuine funds buying but getting caught in a market catalyst. This may be a silly question but I will ask anyway.
Another thought, I’ve heard of traders that only trade and wait for retests in the June 20th case a failed restest. Not only looking back but in real time there would have been a neg div on that top. Bingo another point that links your course to successful trading outcome.
Boy that nadeemyah whatever is such an imbecile, he doesn’t know what he’s missing !
Such a powerful and consice startegy staring him right in the face, little does he know it could be his ticket out of the slums of India, poor arrogant bastard rat. I would never give him his $ back. As proof of success all you would have to do is show him this article the course works.
I have to admit, I am kicking myself for not following the course this time to a “T” : WWWWW
Well I have learned something once again !
Thank you for everything, your a selfless person trying to help us and YOU are.
Something that relates to the fear and greed paradyme and I’ll quote some thing Warren Buffett said.
It’s not exact but similar.
“If your always trying to bat a thousand your not likely to make it, but if your willing to strike out every once in a while you probably will”.
How true, and this is what our colibri does, it realy is so commendable.
Regards
Hi Dan,
Regarding your first question- such moves often happen around major support/resistance areas. It is not that easy to confirm such a major level, especially in this case this was an all-time high. Also, the retest after the first drop of the support level at 12650 was another reason. In the first test it bounced back- taking off some of the shorts and then on the second test it broke it. I am expecting to probably see a retest of the 12550 level. If we see a break above this level, the next level is 12900 again.
Regarding the RSI- yes , that completely right, too.
Regarding my course- yes. It works pretty well when the right market conditions are present.
Last but not least- thank you for the great words- they really do mean a lot to me. I am happy to see that serious traders like you are appreciating it. Let’s see when the market will give us another opportunity 🙂
Hello colibritrader,
Todays intraday is quite bearish, heres hoping you stayed in short during the small drive up to 12500 area.
Your short trade has worked out exceptionally well.
Daily candles are still printing between indecision to bearish well done great work !
Regards
Hi Dan,
I am not going to lie- this one really worked extremely well. Seems like price action is finding a bit of support around 12,320. It is a tough area, which might lead to a re-bounce. Let’s see 🙂 Other than that, markets look quiet in preparation for the NFP today
Hi colibritrader,
Todays intraday seems mixed , hoping the nfp is a low figure, Dax if it breaks this S level could fly lower once again. 12283 area
chat soon’Dan
Hi Dan,
I usually do not trade before NFP or even during the whole day. Mornings are very quiet, afternoons are crazy. I prefer to “fish” in lukewarm waters 🙂
-Colibri
Hi
Yes true I agree am just thinking if you were still short what the intraday is looking like.
The 4 hour looks like it could jump off a cliff to 12200 to 12000 but the NFP could change that .
Hello colibritrader,
This comment is probably the most powerful action a trader could have done and you did !
“Then I closed the charts and went for a walk…”
Jesse would have done the same thing, I’m sure.
There is always a great lesson tucked away among the lines of each article, sometimes picked up well after the first read.
It is astonishing how much you want us to succeed.
Thank You
Thanks Dan! I am happy I am contributing to your progress as a trader. I wish the others were as proactive as you! Glad to have you on-board!
Hi colibri,
Looking back at the textbook Dax trade, most of the premise for making a trade is when a level is tested rej etc.
In this case the entry was near all time highs, even more difficult.
Looking back the bear candle on daily then dojis was a good setup. It seems when price is broadcasting a clear story its time to enter. The exp trader knows how to read the story book, this can only be done using an unbiased and unemotional approach.
Any fear or greed and his ability is impared or he might hesitate.
In your course you describe scaling in, is this what you did in this case ? Or did you enter with a full size position.
Do you alter this if the probability looks higher or lower.
This could be an open ended question but I might learn something either way by asking
Thank you
Hi Dan, This was a high risk trade, because it was against the trend as I discussed earlier. And yes- you should be as unbiased as possible. That is why you need to have rules written down and not panic with every tick the price takes. Fear and greed will be always with you- you just need to learn how to control them. As explained in my course and explained in the textbook example- that’s what I did. The only difference was that my initial position was larger than the following ones.
Hi colibritrader,
Todays session at start
You have to wonder what the heck is going on to spike then retrace the whole lot.
Rigged / market makers ??
You remember when I mentioned about the 12500-12600 area? That’s what I was thinking about…
Yes I do and this seems it could be an imminent move taking place with that momentum.
The open would have rattled even the most experienced.
We have Theresa may speech coming. I don;t know if that is the catalyst but thats a real rejection if i ever seen one and fast too
That was definitely a wild swing! Usually is a good idea not to speculate before a major speech 🙂
Sure also 12415 candle looks like line in the sand for any longs as is a supportive move upward from there
Hi colibri,
The 12415 area served as support, a sign as I mentioned earlier
Two oppossing pins on 4 hr, with a doji in the middle how confusing for traders !
S&P still looks weak, gold has popped pins on daily, +div on 4 hr might just be a low risk area to enter long
Hi Dan,
Once it is not clear, it is better to stay away. There is always another Monday as the saying goes. If you are in doubt, this is already a good sign that you should take a break. On the other side, Gold has already printed higher, but now it is up to the 1215 to prove a good support. Then, I will be looking at 1230. SPX has printed a bearish rejection pin, which is a bullish sign, but am not so convinced with S&P, so staying away myself:)
Again- if it does not look convincing, stay away. No point to trade just for the sake of trading. It is better to have 1 trade a week that you can afford slightly larger stop and feel comfortable with the size than 10 trades with tight SL that leads you to nowhere. Look at the longer term, Dan. Hope that helps!
At first I thought a large short had closed but then a complete retrace ??
Now we have a strong pin on 4 hour.
Signal or not ?
Have to wait for the close
For me, price will be looking to go lower towards the 12300 area. How long will it take is another question 🙂
thank you sir
thank you