


Swing Trading Indicators- 5 Best Indicators
Who is using swing trading indicators and what type of traders can benefit from them?
Let’s take a step back and find who classifies as a swing trader.
If your positions last from several days to a few weeks, you’re a swing trader.
In today’s article…
We’ll discuss some of the best tools you can employ to be more efficient in your craft.
Right swing trading indicators enable you to find the entries and targets that make sense, manage risk and expectations.
Keep in mind that no indicator works all the time and is entirely self-sufficient.
Makes sense?
For the best results and objective analysis, you should combine different ways of looking at the market.
For example, if one indicator tells you it’s an uptrend, seek further evidence analyzing other market properties.
It won’t help much if you just use a bunch of other tools that are to measure the same attribute – trend direction.
Instead, you’d want to know the momentum strength, move potential, volatility, and overall market context.
The swing trading indicators we’ll look at provide different categories of data, giving you a comprehensive view of the market.
Let’s dig in…
Contents in this article
Swing Trading Indicator #1: Exponential Moving Average (EMA)
EMA tells you the overall market direction, giving clues of when to enter or exit the market.
First, let’s see how it’s calculated and how EMA is different from its classic relative – Simple Moving Average (SMA).
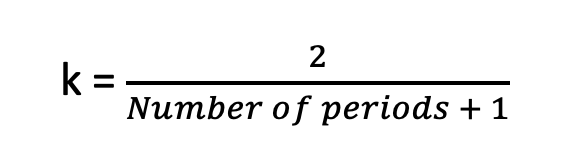
Formula
EMA is the version of SMA, focusing more on the recent prices, with the relevance of proceeding prices decreasing exponentially.
The SMA forms the next data point by calculating an average of closing prices over a specific number of periods.
Let’s look at the formula below.
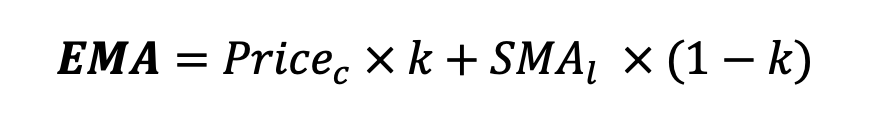
Where:
C = current
SMA = Simple Moving Average of closing prices for a number of periods.
l = last
Although, if we use the same period setting for SMA and EMA, the latter will be more sensitive.
Application
In swing trading, we use EMA to confirm the current trend direction or a reversal.
We can also use the indicator to find entry signals.
When prices stay above the indicator, we consider the market in an uptrend and look for long setups.
If the market confidently moves below EMA, reversal is likely to happen.
An example…
The chart below shows how EMA (the red line) gave us the signal of the trend reversal.
Traders could short AUDUSD when the four-hour candle closed below EMA (see the circled candle).
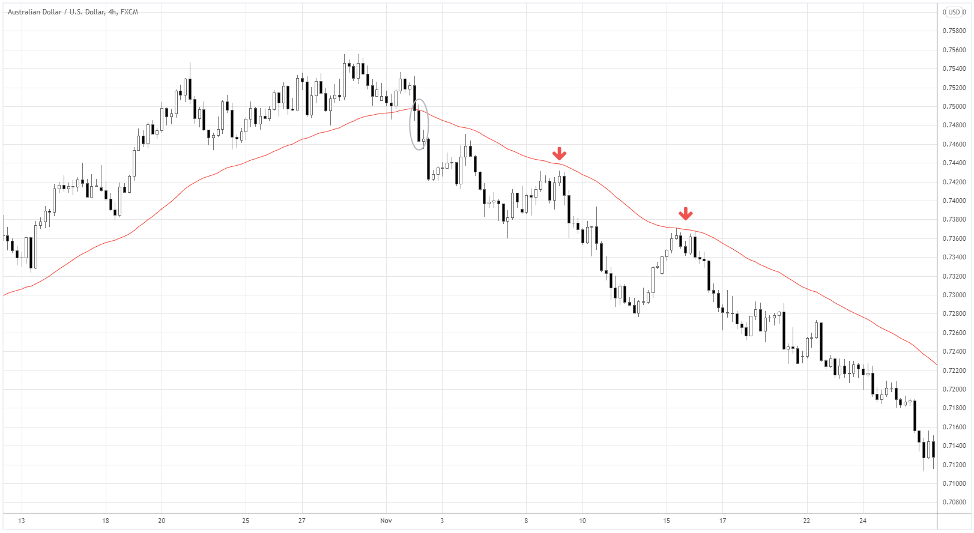
After the prices have remained under the red line, our bias should be down, focusing on other short setups.
The red arrows show potential areas to sell the pair when the market pulls back to the Exponential Moving Average.
How the Exponential may beat the Simple
Let’s look at some practical features of EMA that make it stand out against the SMA.
Below is the four-hour AUDUSD chart, where we plotted EMA (red) and SMA (blue) for the same period.
The first thing that catches the eye is the red line reacting faster to the fluctuations of the pair.
Let’s compare.
In the situation “A,” the market reverses to the upside.
Both indicators signal a bullish reversal.
However, while the red line’s direction curves up shortly after the price moves above EMA, the blue one still slides.
EMA triggered the reversal signal earlier as the prices crossed the EMA before SMA.
At the same time, EMA provided us with the reversal confirmation faster as it started curving up almost immediately.
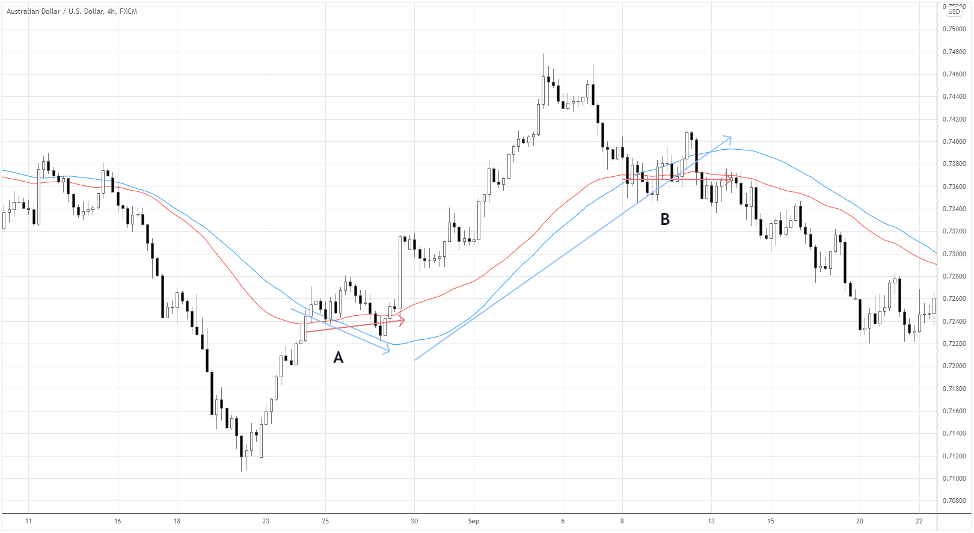
Case “B” shows that EMA signaled the market state turning sideways.
After a crossover down, the red line stayed flat, while SMA insisted on an uptrend, exposing bulls to potential whipsaws.
Swing Trading Indicator #2: Relative Strength Index (RSI)
When you know the market direction but want to gauge the magnitude of the price move, RSI comes in handy.
The change in momentum usually precedes the change in direction; thus, we can use this information to catch the reversals.
Formula
We’ll need to go through two steps to find the RSI.
Step 1
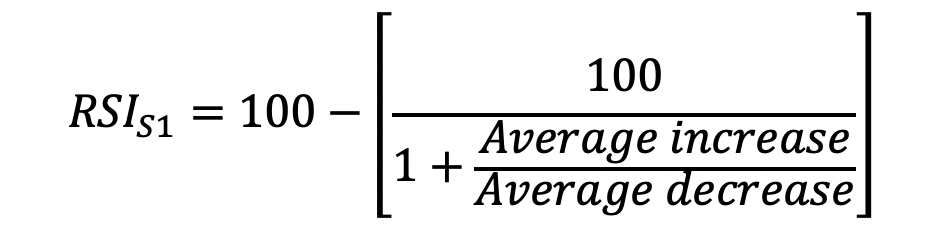
The average increase or decrease is expressed in percentage over set periods.
The standard periods setting is 14.
Step 2
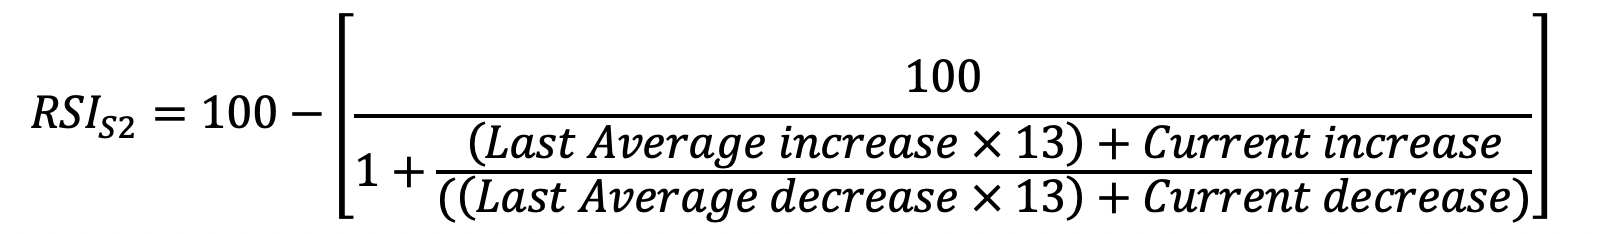
In this part, we smooth the readings with the formula above.
Application
The indicator looks like a line, oscillating within a 0-100 range in the separate window in the chart.
In general, when RSI shows extreme readings, we get a reversal signal.
When the indicator gets to 70, the market is considered overbought, and we should expect a decline.
Conversely, RSI becomes oversold when it dips to 30, signaling a likely surge.
Range rebounds
The classic use of the indicator works well in the range market.
The four-hour EURUSD chart below shows how we can use RSI for swing trading.
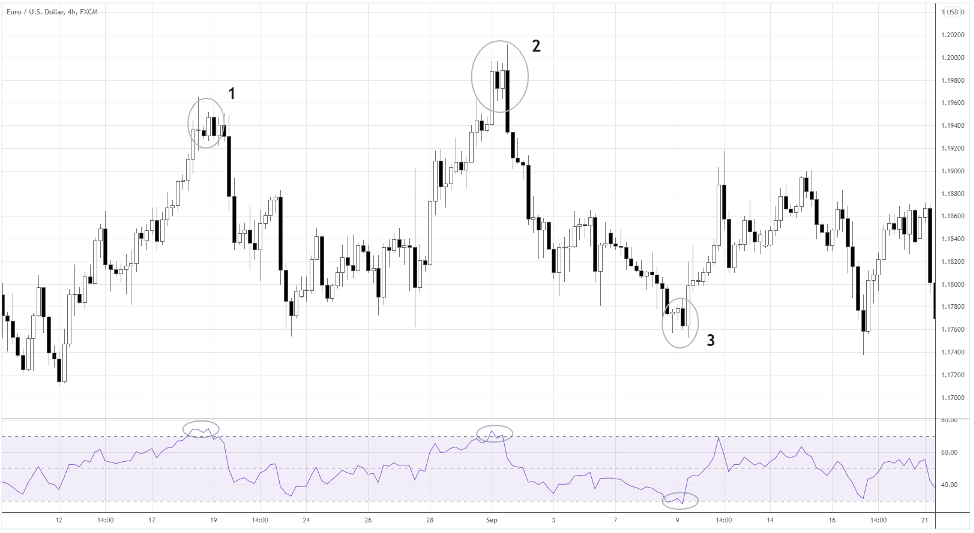
We can go short in situations 1 and 2 when RSI goes above 70.
Case 3 portrays a buying opportunity, with RSI dipping to 30.
Divergencies
If the asset makes a higher high, but the indicator forms a lower high, we get a sell setup – bearish divergence.
The opposite is true for bullish divergences, producing buy signals.
The illustration below shows a short setup, where we would sell when the RSI’s lower high becomes apparent.
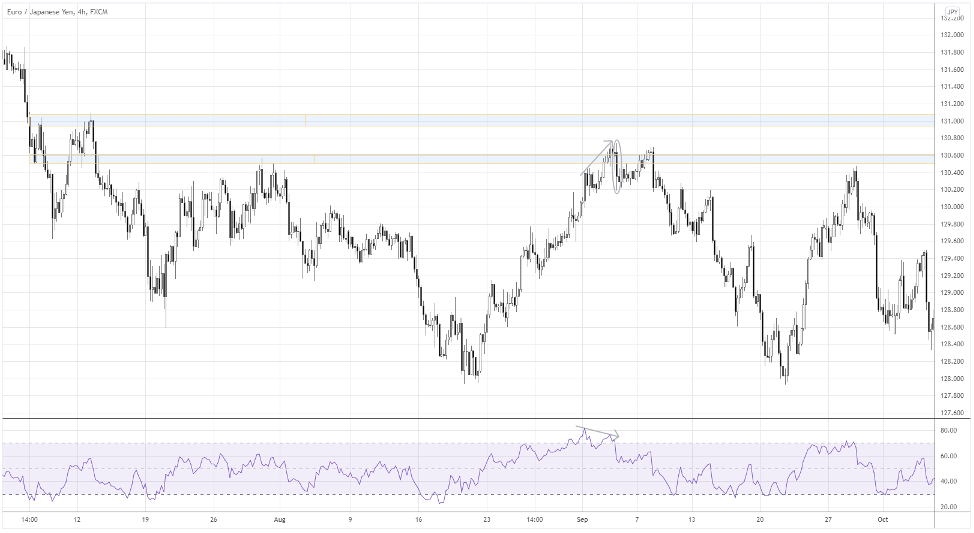
For example, a circled black candle would be a good entry trigger.
Note, combining the indicator with critical price levels (see the blue areas above) can enhance the quality of the signals.
Swing Trading Indicator #3: Fibonacci Retracement
The tool is one of the few swing trading indicators that assist in finding the key prices to base entries and exits on.
The retracement idea comes from the Fibonacci sequence, where each number equals the sum of the previous two.
But…
…if we divide any number after eight by the following number, we’ll get the 0.618 ratios.
We’ll find other critical ratios dividing the number by the ones two and three places to the right after the next one.
Swing traders use 61.8% (0.618), 38.2% (0.382) and 23.6% (0.236) as potential supports or resistances when a trend retraces.
Application
The success of the use of the tool depends on how proficient a trader is in applying it to the chart.
Let’s look at the steps of how to plot the retracement correctly in an uptrend.
- Find the trend’s high.
- Decide on the recent low that you think is the bottom of the current retracement.
- Drag the Fibo tool from the high to the bottom.
The opposite is valid for a downtrend.
Below is the example of the retracement levels plotted on the NZDUSD uptrend.
The circled area is considered to be the correction’s bottom.
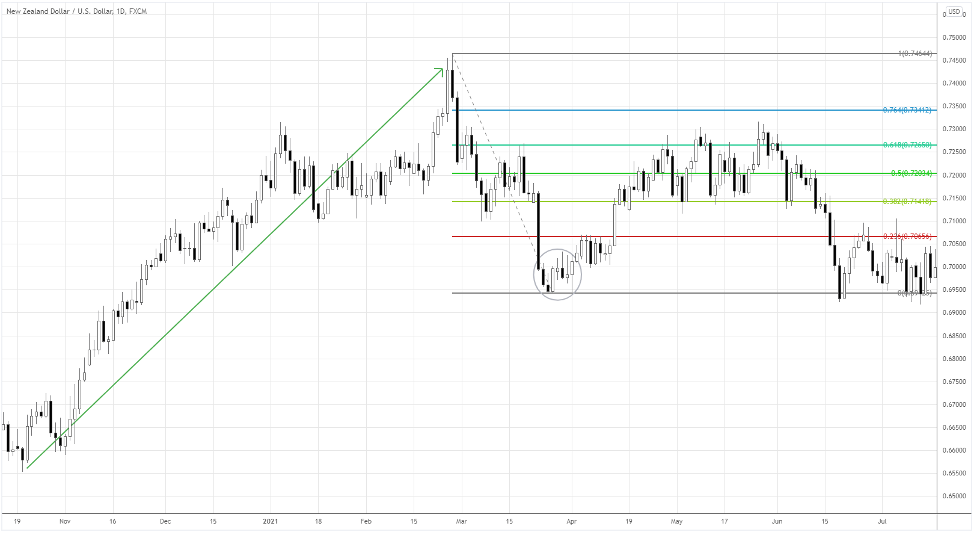
Buyers can use the levels for profit targets or breakout points, while sellers may seek to trade rebounds from those levels.
The tool works better on high timeframes, so it makes sense to apply it in swing trading.
Swing Trading Indicator #4: Average True Range (ATR)
When we want to gauge the average market volatility, ATR is the tool.
The indicator helps us to have the right expectations about the market.
When important news is absent, ATR provides objective data of how far the prices can go.
Formula
The indicator uses the concept of True Range, which is found through the formula below.

Now we can calculate ATR:
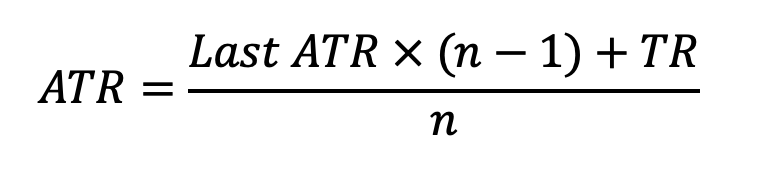
Where:
n = number of periods
Application
When we place a trade, we need to limit the risk by putting the protective stop order.
Stop-loss should be at the price that objectively invalidates the trade idea.
The image below shows that we should place a Stop loss over 43 pips away from the buy entry.
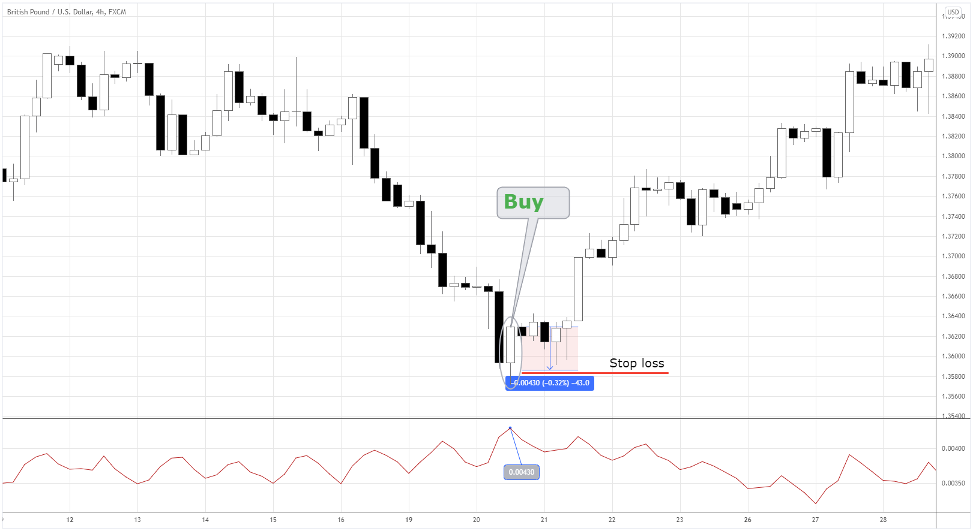
Sometimes you may be right but set a stop loss within a “normal” range of price fluctuations.
Thus, it would be completely “normal” if the market whipsaws you.
If you put the stop beyond that range, the market will have a space for volatility to let your idea play out.
Swing Trading Indicator #5: Average Directional Index (ADX)
The standard way of using ADX doesn’t offer any entry or exit signals.
However, the indicator gives us a clue whether we should trade at all.
ADX shows whether the market is in a range or trend and how strong the trend is.
Structure
The indicator includes three parts:
1. +DI(green line): the consistency of the price growth.
2. -DI(red line): the consistency of the price decline.
3. ADX: the ratio of +DI and -DI
Application
When ADX is above 20, the market is in a trend, and when ADX is below 20, the market is sideways.
The higher the reading above 20, the stronger the trend is.
The blue line in the indicator window is the ADX; the red and green lines show us the prevailing market direction.
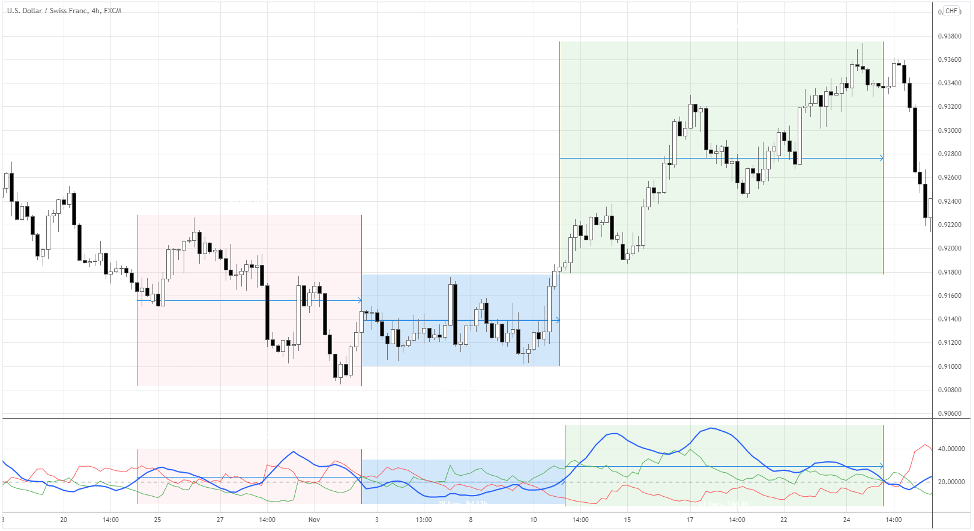
The illustration above shows how the market environment changes.
The state shifts from a downtrend (red area) into sideways (blue area) and finally start an uptrend (green space).
The tool suggests what other swing trading indicators are appropriate to use at the moment.
Summing it all up
The 5 swing trading indicators we have used to show you how to take advantage of more timely entries are probably the best known ones.
There are of course other swing trading indicators, and defining which ones are the best swing trading indicators would be difficult.
The answer is…
…That we will need to have more information at hand like what are your trading goals, finances and risk appetite.
Summing Up: we can say that the trading indicators we have introduced are amongst the best ones out there amongst swing traders.
Key Takeaways
- Exponential Moving Average (EMA) – EMA tells you the overall market direction, giving clues of when to enter or exit the market.
- Relative Strength Index (RSI) – The change in momentum usually precedes the change in direction; thus, we can use this information to catch the reversals.
- Fibonacci Retracement – Swing traders use 61.8% (0.618), 38.2% (0.382) and 23.6% (0.236) as potential supports or resistances when a trend retraces.
- Average True Range (ATR) – This is the best indicator of market volatility; when important news is absent, ATR provides objective data of how far the prices can go.
- Average Directional Index (ADX) – ADX shows whether the market is in a range or trend and how strong the trend is from where comes its value
Now, if you found this post useful, then you’ll love these 5 Swing Trading Strategies