


Parabolic SAR Strategy and How to Use it in Forex Trading- Two Powerful Trading Strategies
Parabolic SAR Strategy and How to Use it in Forex Trading- Two Powerful Trading Strategies
A trend indicator built by the now-famous J. Welles Wilder, Parabolic SAR helps traders in a variety of ways. The SAR acronym stands for “stop and reverse,” and the main Parabolic SAR strategy is to trail the stop-loss in a rising or falling trend.
However, as you’re about to find out in this article, there’s more to it than merely trailing a trade. The way the Parabolic SAR adapts to market changes gives birth to plenty of other Parabolic SAR strategies.
Like any other trend indicator, the Parabolic SAR is lagging too. It means that it works mostly on rising and falling markets, during strong trend environments. And, when the range is tight, traders have a problem using it in the standard way.
For this reason, in this article we’ll cover, among others:
- the basic concept behind Parabolic SAR
- parabolic SAR formula to fully understand how the indicator works
- the proper acceleration factor for trading the currency market
- how to build risk-reward ratios with the SAR strategy
The aim is not to change the perspective of how to use the Parabolic SAR indicator. It is mostly to open the eyes to its flexibility and how easy it is to build a profitable Parabolic SAR strategy by merely knowing the indicator’s capabilities and power.
Time is the Enemy – The Basic Concept Behind Parabolic SAR
For those familiar with the option’s theory concept of time decay, it should come as no surprise that it sits at the heart of the Parabolic SAR indicator. It means that the trader should liquidate a position if it doesn’t generate profits anymore.
The visual display of the Parabolic SAR indicator on the chart is straightforward. All the trader sees are some dots above or below the main candlesticks.
However, the dots have a meaning. When sitting above the price, the dots suggest bearish market conditions. And, when appearing below, the conditions are seen as bullish.
Here’s the NZDUSD recent price action. Showed on the four-hour timeframe, the Parabolic SAR indicator appears in the form of blue dots (you can edit the colour at any time) above or below the price.
It is easy to see the main advantage of using the Parabolic SAR when trading any market: it is extremely visible, making it impossible to miss a strong trend like the bearish one in the NZDUSD pair.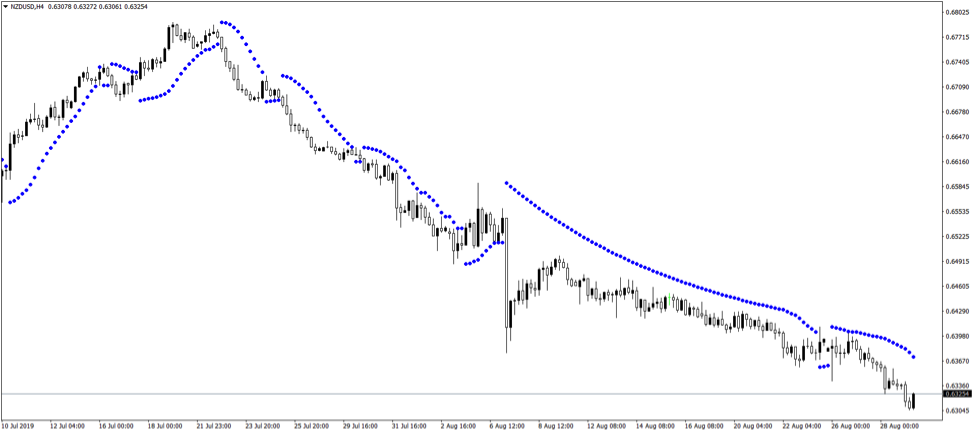
Parabolic SAR Formula
We won’t go into mathematical details about how the Parabolic SAR formula was built. Nor display the formula here.
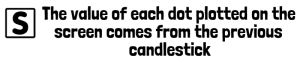
What’s important though is that the value of each dot plotted on the screen comes from the previous candlestick. In other words, the Parabolic SAR formula uses the data on the current period to calculate and project the dot one period ahead.
It means that for the upcoming candlestick, the trading platform already calculates the dot based on what the current period shows.
In a way, it acts similarly with the Ichimoku Kinko Hyo, the famous Japanese indicator showing the market’s equilibrium stance. However, the difference is that the Parabolic SAR indicator projects the dot only one period ahead, while the Ichimoku projects the Kumo or the cloud twenty-six periods ahead.
Nevertheless, the interpretation is the same.
The Acceleration Factor
When applying the Parabolic SAR indicator on a chart using the MT4 platform, the first thing that appears is a popup window. With just a few settings, it shows how to change the colour of the dots and their thickness.
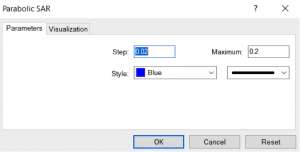
But the other two boxes are more interesting. The default settings show a step of 0.02 and a maximum of 0.2.
What does that stand for?
The Parabolic SAR formula contains a so-called EP or Extreme Point. It represents the highest or the lowest value recorded in the current upward or downward trend.
From it, the Parabolic SAR formula deducts the SAR for the current period. Finally, the formula multiplies the outcome with a so-called acceleration factor.
In this case, this is the 0.02 value that appears in the first box from the above image. It means that every time a new EP in the trend forms, the acceleration factor goes up.
Because of that, at times, it may be that the SAR converges with the price. More precisely, it touches the candlesticks.
To prevent that, a maximum value of 0.2 exists with the initial settings. For this reason, some Parabolic SAR dots get closer to the candlesticks, while others appear far from the candlesticks’ body or even shadows.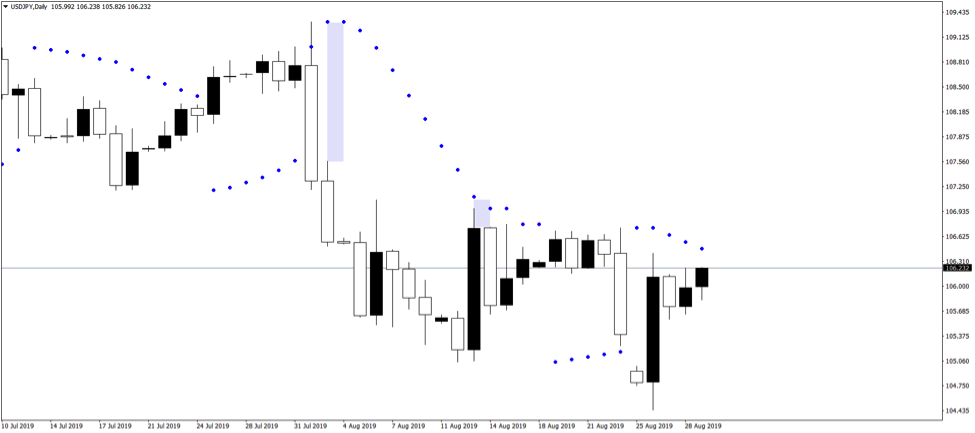
Obviously, traders may choose to change the settings in any way they want. However, these were the initial parameters used by Wilder, and it is only fair to assume that the Parabolic SAR indicator works best with the original intended values.
The Best Parabolic SAR Strategies
It is time to check which Parabolic SAR strategy works best in the currency market and how to make the most both from trending and ranging markets. Moreover, we’ll look at integrating money management rules when trading a Parabolic SAR strategy in such a way to obtain risk-reward ratios that make sense.
Trend Trading – A Parabolic SAR Strategy for Forex Trading
Before anything, remember the rules of a trend. First, for a bearish trend to exist, a series of lower lows and lower highs must form. Second, in a bullish trend, the series changes to higher highs and higher lows.
The trend trading parabolic SAR strategy uses the same principle. But, on top of the series already mentioned, the principle applies to the SAR dots too.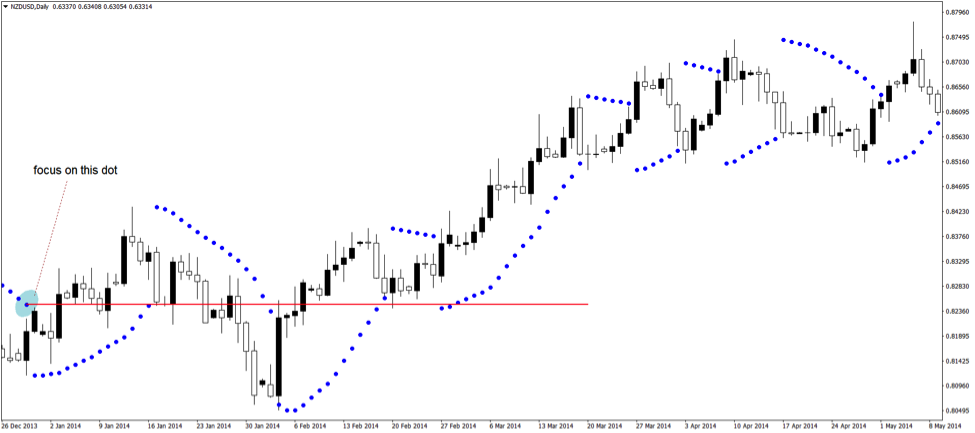
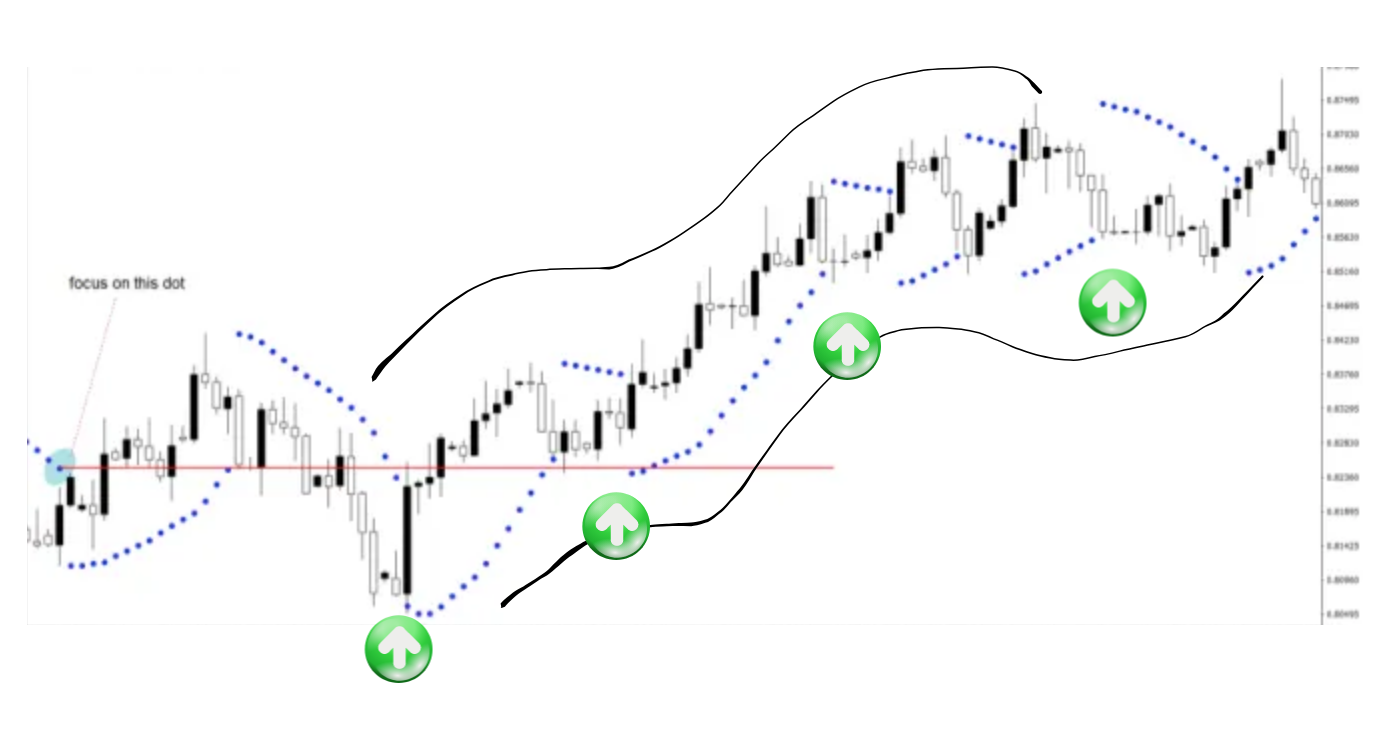
Still the NZDUSD, but this time on the daily timeframe. As written on the chart, focus on the dot on the left side of the screen.
This is the lowest bearish SAR dot to consider, providing the market makes a new lower low. And it did. As the chart below shows, the market did make a new lower low. But then, abruptly, it reversed.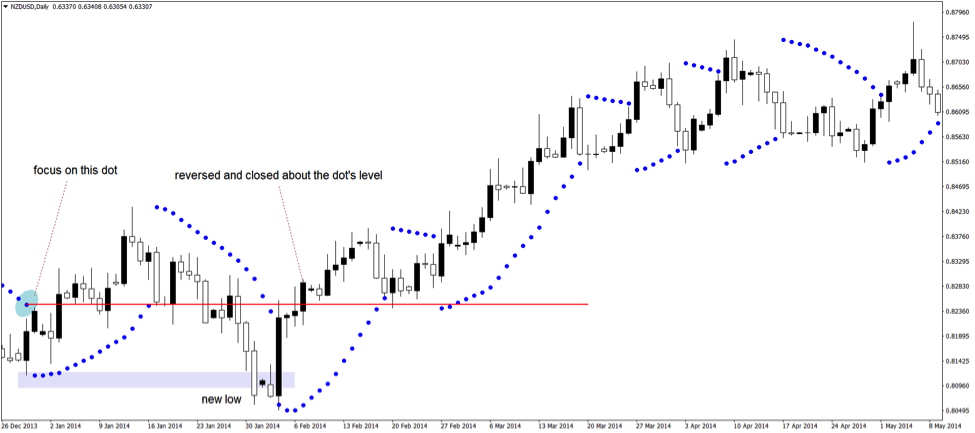
Again, the focus sits with the dot on the extreme left. The price MUST close above that dot’s level to invalidate the bearish trend. So it did, nullifying the bearish trend and opening the possibility for a new, bullish trend to start.
To ride the bullish trend, we use the same principles. Only this time, the focus sits with higher highs and the last bullish SAR dot of the previous market swing.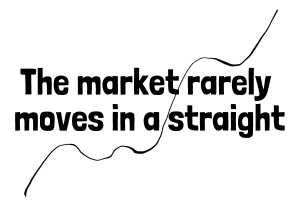
Remember that the market rarely moves in a straight, vertical line. Instead, what it does is to consolidate or correct during trends. And that’s where the trending Parabolic SAR strategy comes in handy.
Riding a Bullish Trend with a Parabolic SAR Strategy
Let’s move on with the analysis on the NZDUSD pair so to demonstrate the power of this Parabolic SAR strategy. Now that the market invalidated the bearish trend, the Parabolic SAR indicator started to plot dots above the candlesticks. Bearish dots, as marked with the rectangle below.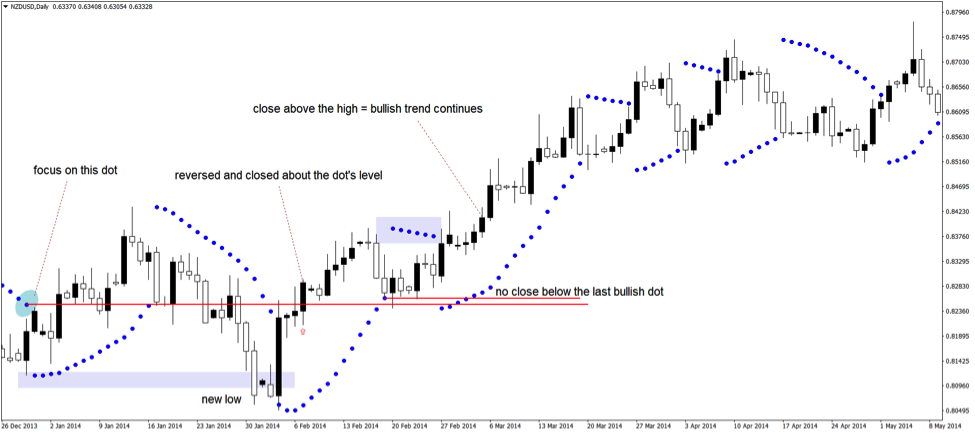
An aggressive approach (like the one considered here) is to use the last bullish SAR dot and consider a break below it to invalidate the bullish trend.
But that’s incorrect if we respect the rules of a trend. For that, we need first to wait for a pullback (the first one). Second, the low in place must hold.
Finally, when the market makes a new higher high, that’s when the last bullish SAR dot comes into the picture.
However, many traders like to keep the stop tight so to better control the drawdown in the trading account. That’s a smart approach, but sometimes using this Parabolic SAR strategy, the market can get you out of the trend quicker, only to see the trending conditions resuming.
In any case, the market failed to close below the last bullish dot. Moreover, it formed a new higher high, turning the SAR dots bullish again.
And the trend continues for more than two trading weeks when a new bearish SAR dot develops.
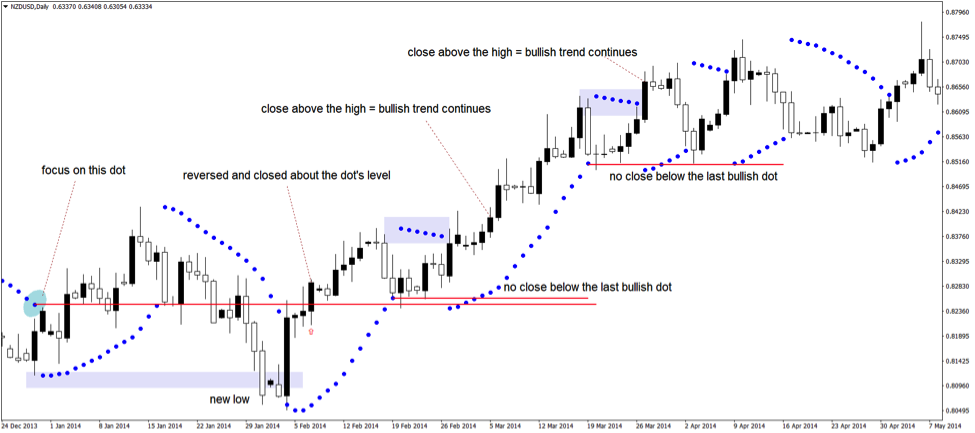
Using the same (aggressive) principle, we see that, while dipping, the price failed to close below the last bullish dot. And, it made a new higher high, turning the SAR dot bullish again.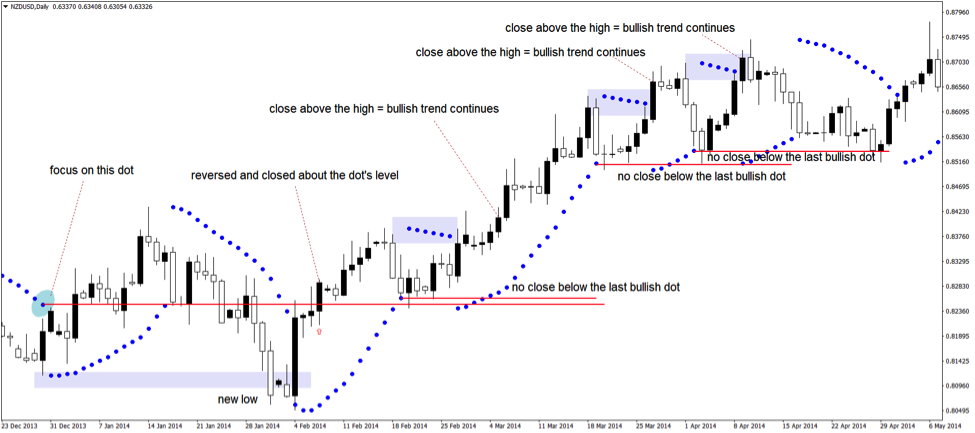
The point here is to show how to discount the pullbacks in a trend by using the last bullish (in this case) SAR dot. This way, it is more comfortable to ride trends for as long as they hold.
Support and Resistance Using Parabolic SAR
Another attractive (and profitable) Parabolic SAR strategy is to use support and resistance levels given by the SAR dots. However, some rules exist, and the first task is to determine if a trend is strong enough.
How do you do that?
The secret is to look for market swings with a pre-determined length. The Parabolic SAR indicator, while lagging, offers the advantage of keeping a bullish or bearish series running even if some candlesticks move in the opposite direction when compared with the primary trend.
Look for a minimum of ten consecutive dots to signal the start of a new trend. The more consecutive SAR dots, the higher the chances the trend is strong. And, the stronger the support or resistance level is.
Furthermore, the higher the timeframe the Parabolic SAR strategy is applied, the stronger the support and resistance. In this case, this is still the NZDUSD daily timeframe. As you’re familiar with it already, we’ll continue using it.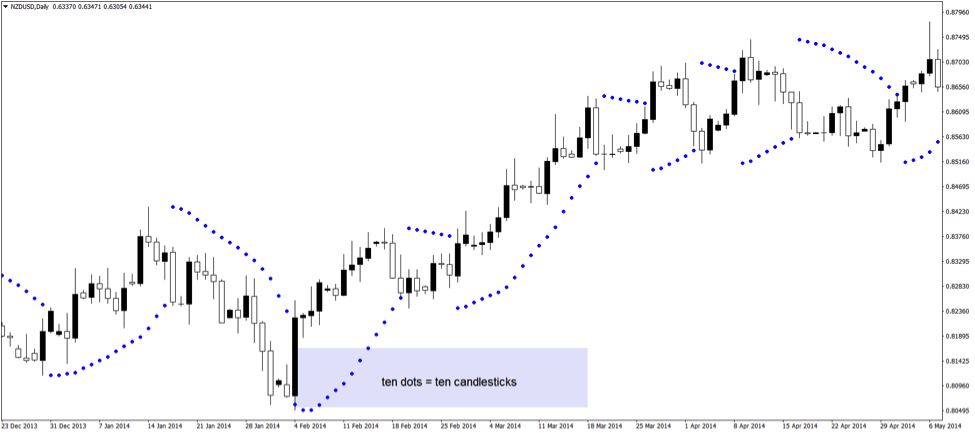
From this moment on, I need your full attention. The Parabolic SAR strategy using support and resistance requires a different kind of thinking.
More precisely, the support or resistance do NOT refer to the actual price. But, to the SAR dots! Remember, at the start of this article, it was mentioned about the accelerator factor.
And, the fact that dots are closer or further away from the candlesticks. This means that support or resistance varies too, as illustrated further.
Building Support Areas with a Dedicated Parabolic SAR Strategy
After spotting a trend reversal, as explained earlier in the article, look for more than ten consecutive dots to form in the opposite direction. Just like in the chart above, where we see a series of ten SAR bullish dots.
Next, wait for the Parabolic SAR indicator to plot a series of bearish SAR dots. Moving forward, return to the last two bullish dots from the previous series and mark the distance between them using a shape provided by the MT4 or the trading platform you use.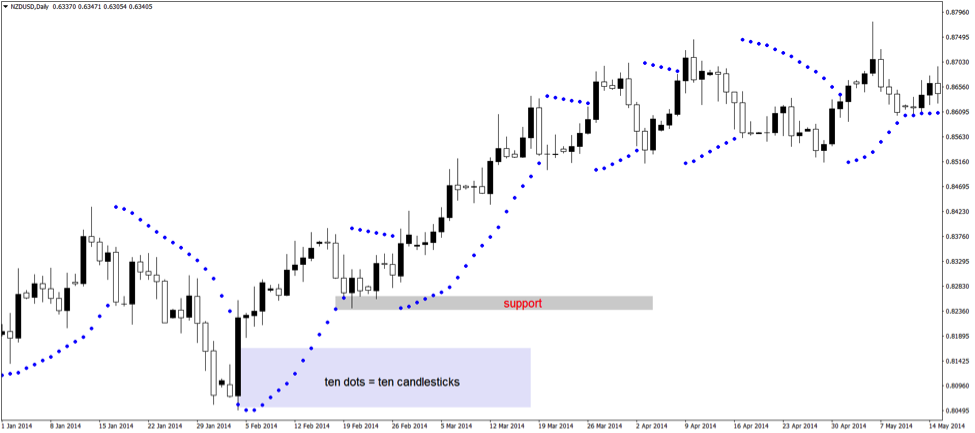
The grey area marks the support for the bullish trend. Again, this is NOT the support for the price, but for the bearish SAR dots. We see that the market doesn’t challenge support. The SAR bearish dots turn bullish again.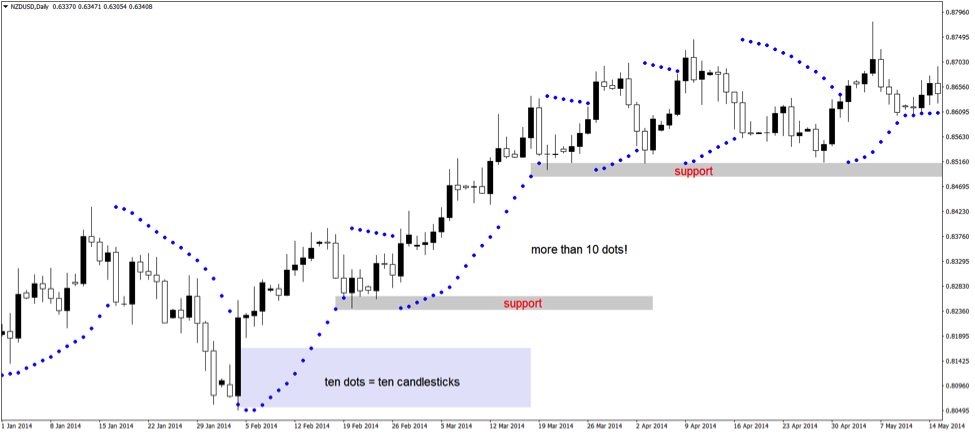
Moving forward, another series of more than ten consecutive bullish dots forms. It means support held and a new support level, equally important, forms.
Focus on the SAR Dots
Keep in mind that the support and resistance levels benefit from the interchangeability principle. Simply put, it means support turns into resistance and resistance into support when broken.
Also, it means that traders are free to drag historical levels on the right side of the chart to find out future support or resistance levels.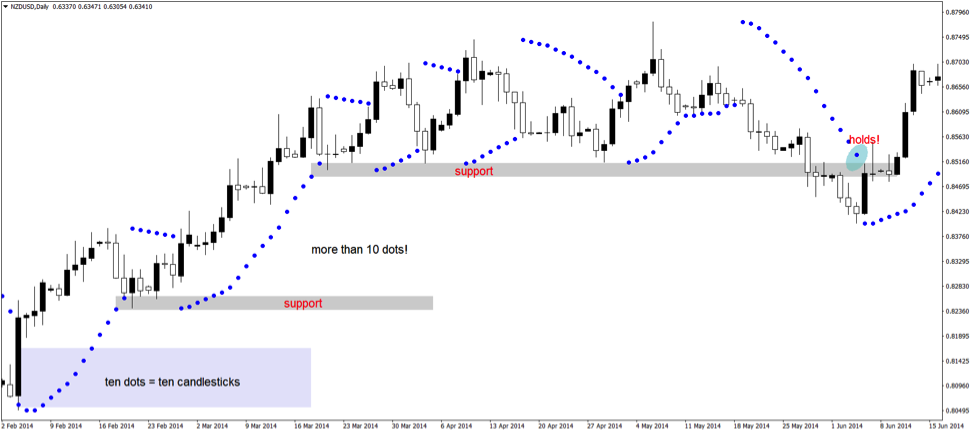
The second level of support still holds. If you focus on the price only, you’ll misinterpret the chart. The price, indeed, broke the support, but the focus, as mentioned earlier, sits with the bearish SAR dots.
As the chart above shows, no bearish SAR dot moved below support. Hence, the bullish conditions remain in place. It makes no sense to exit the long side. What happened next?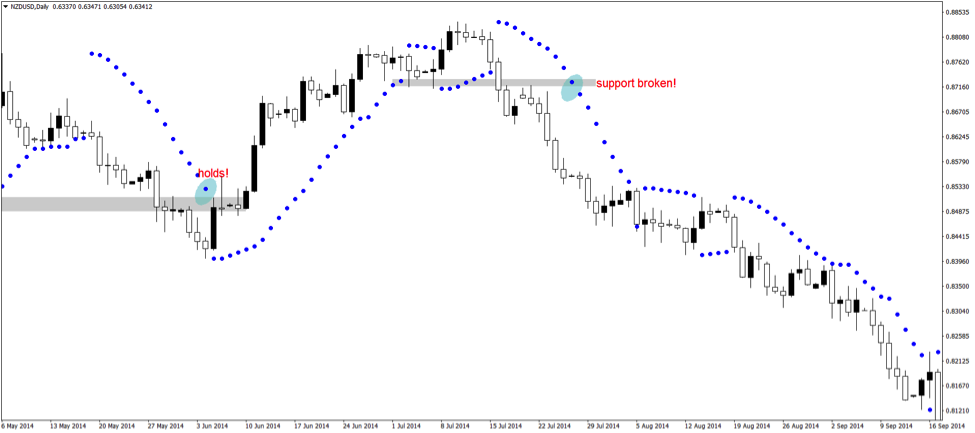
Not only that the market made a new high, but the Parabolic SAR indicator pulled another series of more than ten bullish consecutive SAR dots. Naturally, the series gives birth to a new support level, even higher this time.
Eventually, the price breaks the last support.
Important: The SAR dots move below it, as the previous chart shows. This way, we can ride a trend for as long as it holds, without the fear that we’ll miss the entire ride.
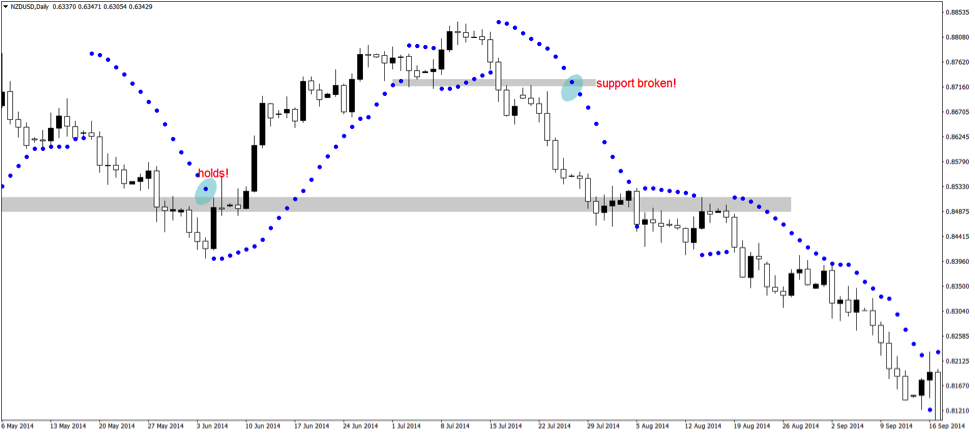
Finally, by dragging the previous support areas on the right side of the chart, traders find out potential levels where the PRICE might react.
Building Risk-Reward Ratios with the Parabolic SAR Strategy
Both Parabolic SAR strategies showed in this article benefited from excessive risk-reward ratios. To be clear, without a proper risk-reward ratio (minimum 1:2, meaning the reward must exceed the risk by a factor of 2 to 1), any trading strategy makes no sense.
Obviously, no one knows beforehand if the trade will reach the desired target. However, following all the steps mentioned in this article, the chances are that in the end, even if stopped once or twice due to choppy conditions, the Parabolic SAR strategy will reward traders.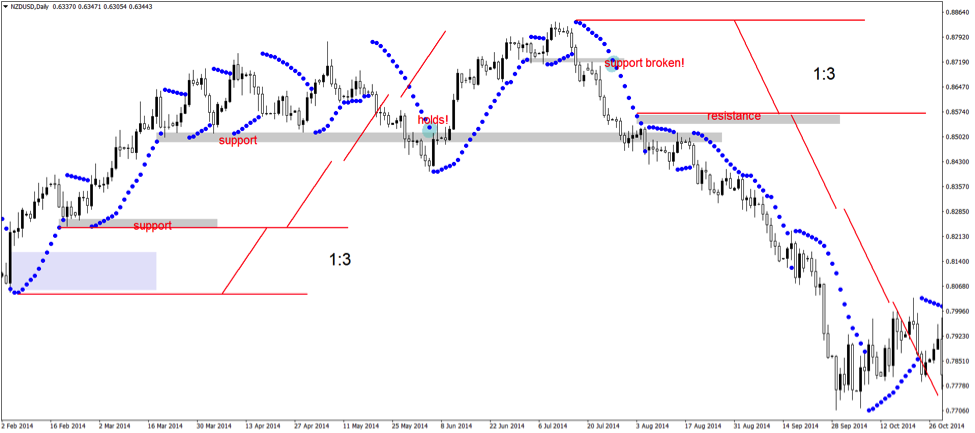
Here are the two examples used. From left to right, let’s interpret them a bit to see how to set the proper money management risk-reward ratio.
Remember: First, define the support level, as explained earlier. Next, consider the lowest SAR dot. That’s the invalidation point.
The risk, therefore, is from the lower dot in the support area to the lower SAR dot from the start of the bullish trend.
Moving forward, use a trendline, and measure the risk. Furthermore, copy and paste it two times to find the 1:2 risk-reward ratio. That’s the minimum target for the trade.
Aggressive traders trail the stop at various SAR dots in the bullish sequence, to make the most of the trade. Or, book half the profits at the 1:2 level and stay in for the extra pips that may come.
In any case, the minimum 1:2 came, with even 1:3 risk-reward ratios both for the long and the short trade that followed.
Conclusion
This article proves beyond any doubt that trend indicators act as valuable trading tools responsible for significant profits. All traders need to do is to understand how the indicator works and then look for the best way to use it.
In the case of the Parabolic SAR indicator, the lagging factor doesn’t hurt the Parabolic SAR strategies present here. If anything, it helps in to avoid false breakouts through support and resistance levels.
Moreover, the lagging factor lays down the ground for identifying potential strong trends. If the SAR dots lag, it means that the ability of the market to put more than ten consecutive dots signals incipient trending conditions.
You see, the secret is to use what the Parabolic SAR indicator has to offer in your advantage. For some traders, a lagging indicator is of no use. For some others, as we proved in this article, it doesn’t bother the Parabolic SAR strategy.
All in all, the Parabolic SAR indicator is the source of many powerful trading strategies. Besides the two mentioned here, others exist.
Some traders use the Parabolic SAR indicator together with an oscillator. This way, they hope to make the most of both trending and ranging conditions.
However, the support and resistance Parabolic SAR strategy presented here overcomes the ranging issue. If the dots have the ability to break the support or resistance, it means the trend loses its steam, and a reversal just took place.
P.S.
Have you checked my recent article on Chart Patterns
Good
Let me know if you have any questions
In the above mentioned example, the price already closed above the lowest SAR dot you mentioned to focus. Why are we considering only the second close above the dot? Why not the first close?
Hi Mathan, thank you for your question. That is pretty much how I am seeing it being used. It gives an extra confirmation, as well
How about multi time frame approach? I think its more accurate. But I am not sure which combination is the best. maybe Daily with H4 time frame.
timeframe depends on your strategy. I like Daily and 4H, too!