


NZDUSD Trading Setup
NZDUSD Trading Setup
Global stocks declined on Thursday led by the ECB’s decision to keep rates unchanged. The sell-off on Friday was a continuation of Thursday’s decline fuelled by North Korea’s nuclear tests. Gold was pressured on Friday with the global speculation if FED will raise rated in 2016.
By: Colibri Trader
The trading setup from last time is starting to show profit. I am still very confident in the GBPUSD trade and don’t see a reason for closing my position. We might see a small correction, but in the longer term it still looks as good as before.
NZDUSD Trading Setup
Have a look at the chart below:
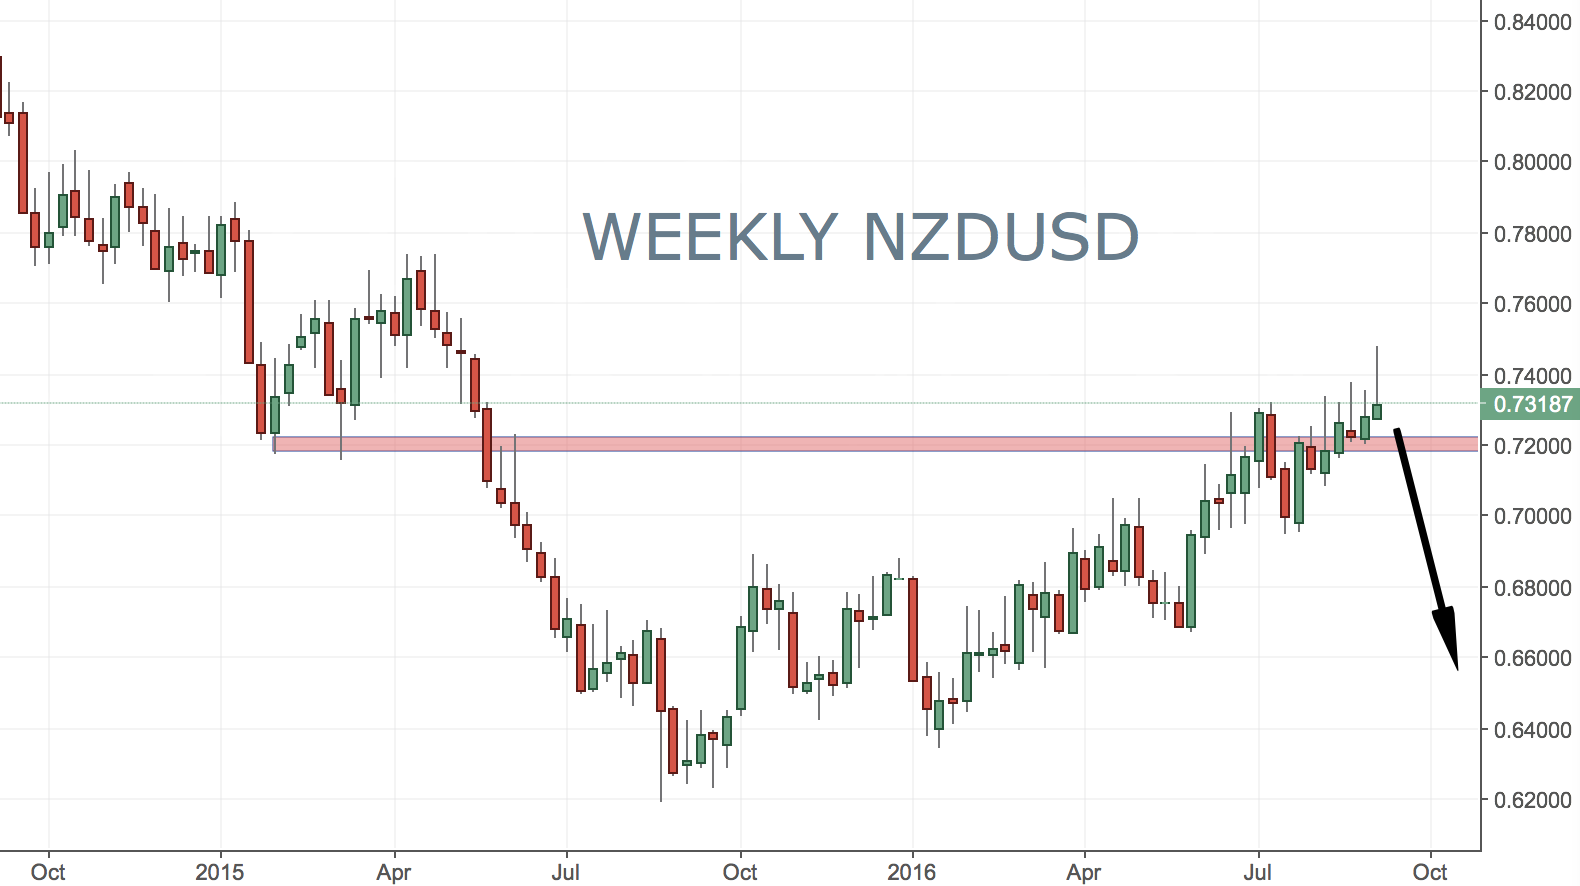
As a lot of you might have guessed already, this is the Weekly chart of the NZDUSD. I do seldom show longer term charts like this one, since I do mostly Daily analysis for you guys. What is important here is the strong multi-month resistance area. It is around the 0.7200 level. What we are seeing is a small breakout, but also a bullish rejection candle (pin bar). As you might have correctly guessed (if you have read my previous article on Support and Resistance), this might be a fake breakout. Indeed, I believe it is! Therefore, I will be looking to enter into a short trade around these levels.
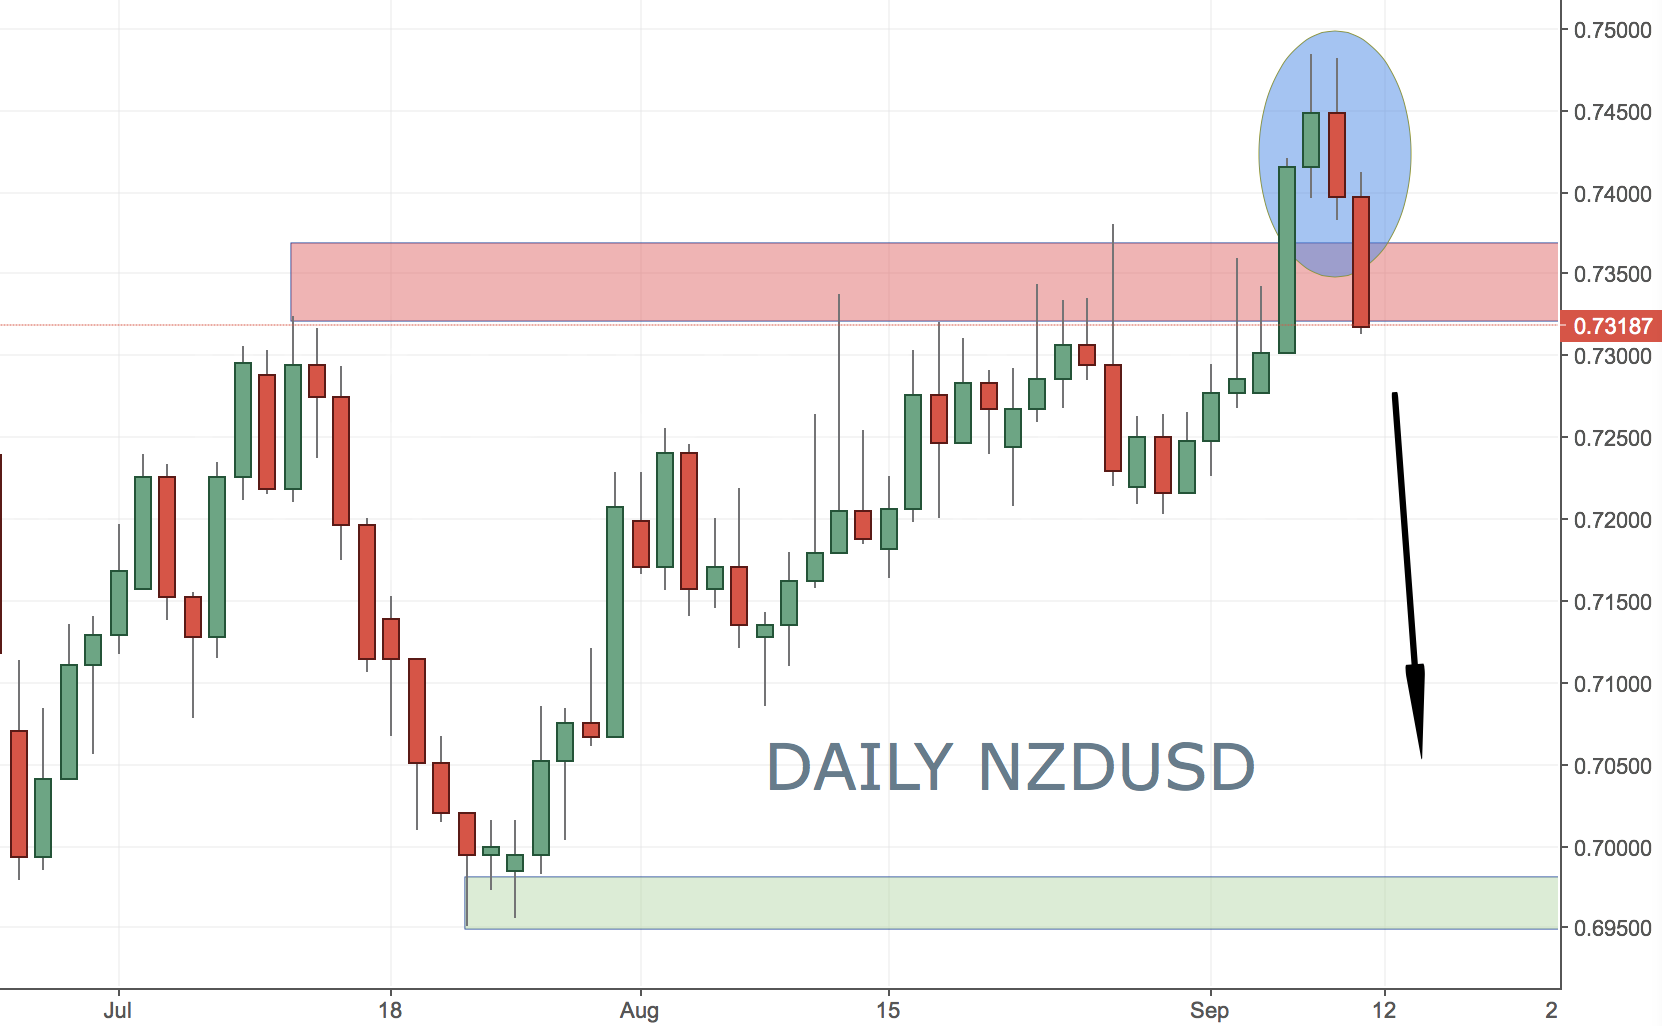
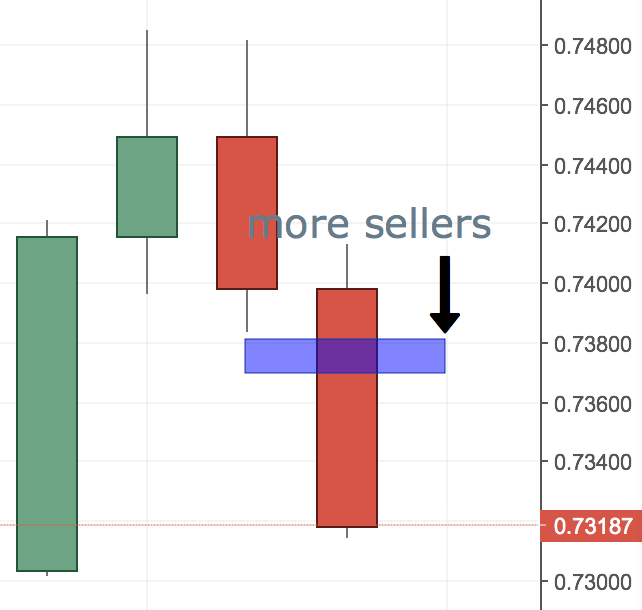
Zooming down to the Daily chart, we can see definitely a bearish mood on the market. You can see a bearish engulfing candle that formed during Thursday’s trading session. The Friday candle was a bearish candle, as well. Now, I am expecting to see a small retracement, where more sellers will join the party. I am zooming in, so you can see where I will be looking to meet more sellers and therefore sell. The screenshot below is showing this area (roughly 0.7380). I will be looking to enter in a short position around 0.7380. My stop loss would be placed just above o.7490. My first target is the level of 0.7000. Then, it will really come down to price action
Happy Trading,
Colibri Trader