


Moving Averages in Trading- 5 Moving Averages Trading Strategies to Profit from the Markets
Moving Averages in Trading- 5 Moving Averages Trading Strategies to Profit from the Markets
Moving averages in trading… In the world of currency trading, trend indicators have great use. Mostly, traders buy dips and sell spikes around dynamic support or resistance areas.
Moving averages in trading serve precisely this purpose. But, on top of it, they have many other advantages.
Get the Free Moving Averages PDF Guide
There’s no trader in this world that didn’t use at least once in their trading lifetime a moving average. In fact, moving average strategies are very common amongst currency traders.
Regardless of the market (currencies, equities, commodities, bonds, etc.), a moving average is a reliable indicator. It divides the price action into bullish and bearish, thus telling the trader what the general market bias is.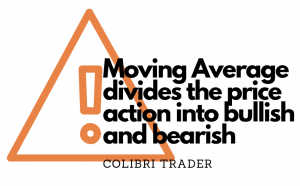
Moreover, the moving average trading strategies developed in time have led to an increase in the number of traders seeking to use these trend indicators. As such, it is no wonder that many trading strategies using moving averages survived the test of time and still exist to this day.
In this article, I’ll cover everything related to moving averages in trading. Besides explaining what moving averages are and the difference between different types of moving averages, I’ll focus on something more important. That is, how to profit from the markets using moving averages trading strategies.
In the end, you’ll end up with five moving averages trading strategies to profit from the markets. All of them unique, interesting, and, more importantly, very easy.
Sounds interesting? Let’s begin…
Contents in this article
- Moving Averages Explained – SMAs, EMAs and Their Purpose
- How About EMAs?
- Using Multiple Moving Averages in Trading
- Patterns’ Final Legs Forming Around Moving Averages in Trading
- Support and Resistance when Using Moving Averages in Trading
- Golden and Death Crosses – Derived Moving Averages Trading Strategies
- Rules
- Drawdowns
- Trading Strategies to Profit – Combining Moving Averages with Oscillators
- EMAs Plus RSI – The Ultimate Moving Average Trading Strategy
- Conclusion
Moving Averages Explained – SMAs, EMAs and Their Purpose
Moving averages have a self-explanatory name. As it suggests, the average “moves” with each price period.
In time, multiple moving averages emerged. The simplest form to average past prices is the SMA or the Simple Moving Average.
The SMA just averages past prices. Depending on the period used, a moving average is “fast” or “slow.”
The rule of thumb goes like this: the fewer periods considered, the faster the moving average is. As such, the SMA(20), for instance, is faster than, say, SMA(200).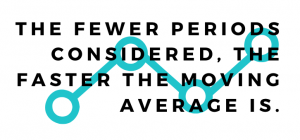
But what do the words “faster” and “slower” refer to? Simply, they reflect the ability of a moving average to react to any given change in the current price. Or, how fast it reacts to a current change in prices.
This is a crucial concept in technical analysis, with multiple implications. On the one hand, it shows the lagging time to consider before a change in the moving average direction. On the other hand, it reflects the power of support and resistance levels given by moving averages in trading.
Multiple ways of calculating a moving average exist. After all, it depends on what is the price the trading platform considers.
The default settings use the closing price of a candlestick. For instance, if you apply the SMA on a daily chart, the daily closing price of each period is the one used in the SMA calculation.
But that is only one option you have. The opening price works too, and, in some cases, some moving averages use an average between the high and the low of each candlestick.
How About EMAs?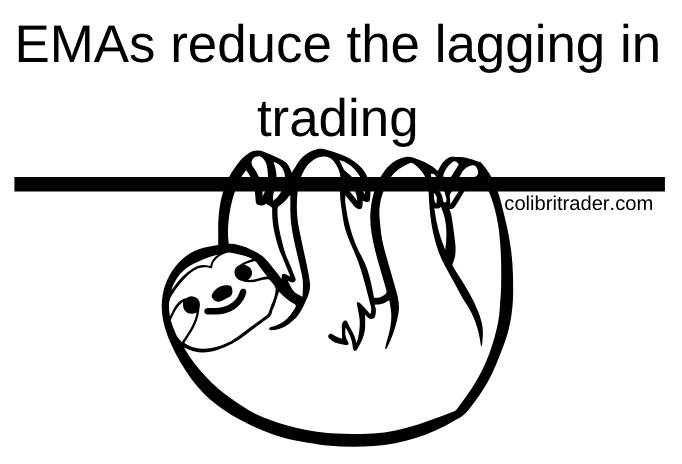
The SMAs may be the most popular moving averages in trading. But, the most efficient ones are the EMAs.
An Exponential Moving Average (EMA), not only averages the prices. It uses a multiplier as a smoothing factor, making it more relevant for the current price analysis.
In plain English, it means it is closer to the price than an SMA. Thus, it reduces the lagging factor which is one of the most significant drawdowns when using moving averages in trading.
Using Multiple Moving Averages in Trading
The first moving averages trading strategy presented covers a simple concept. That is, applying multiple averages on a chart to find the perfect trending conditions.
For this, we need multiple moving averages, starting with EMA(20), continuing with EMA(50) and EMA(100), and ending with the “mother” of all EMAs, EMA(200).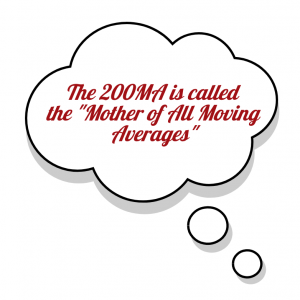
Rarely traders use a moving average that considers more than two-hundred periods. The explanation is that over that point, the moving average becomes just a horizontal line, losing its significance.
Coming back to the strategy, the idea behind it is to see the averages aligned in the order of the periods. Therefore, the condition for a bullish trend is: EMA(20)>EMA(50)>EMA(100)>EMA(200). It means the moving averages are on top of each other, with the EMA(20) sitting above them all. Conversely, the condition for a bearish setup is: EMA(20)<EMA(50)<EMA(100)<EMA(200).
One important note: apply this setup on the daily timeframe. This is very important, because it filters all the noise on the lower timeframes, by following the daily setup.
The USDJPY daily chart from below has all the EMA’s on it. The EMA(20) sits above all other EMAs, making it a bullish setup.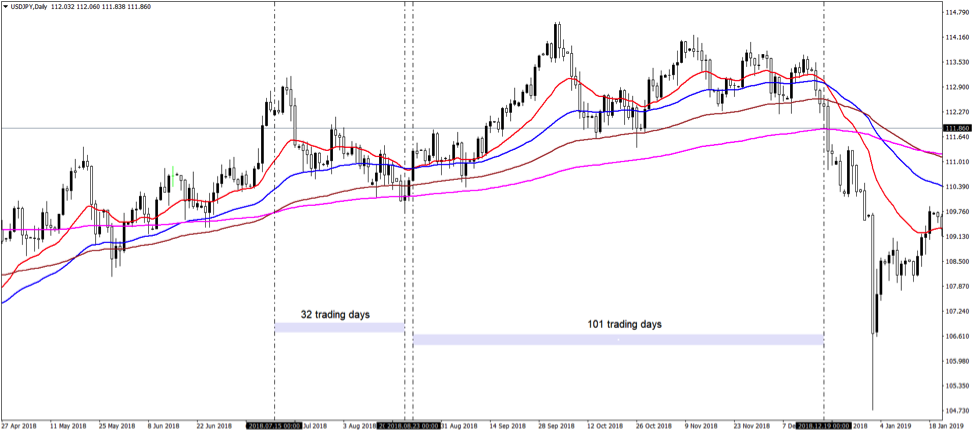
From left two right, for thirty-two days, the pair was in a bullish setup. Following a quick cross when EMA(20) fell below EMA(50), another bullish setup formed. Only this time, over a hundred days long.
The idea, naturally, is to buy dips into a bullish setup.
Where to do that?
Only above a support area. The bigger the EMA, the stronger the support provided.
Also called the “perfect order” setup, it shows the real nature of a trend. As such, traders discount any conflicting information on the lower timeframes, by sticking with what the daily chart shows.
Patterns’ Final Legs Forming Around Moving Averages in Trading
Technical analysis is the art of interpreting patterns. Traders search for similar patterns and document them. Next, they interpret the current price action to trade similar situations.
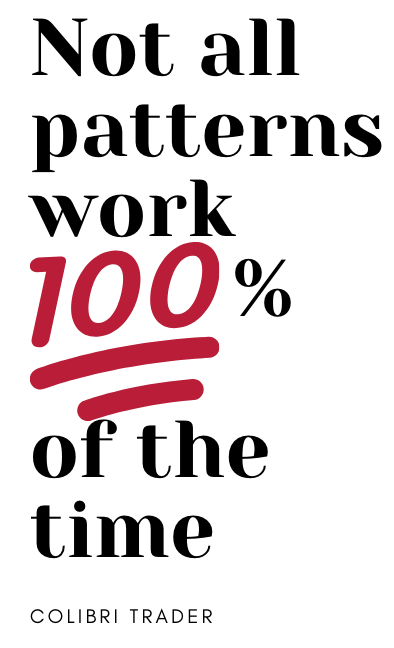 But not all patterns work one-hundred percent of the time. For instance, any trader using a pattern recognition approach knows that sometimes head and shoulders patterns fail.
Or, that a rising wedge doesn’t “fall” every time. In fact, sometimes it acts like a super-strong continuation pattern.
Furthermore, the hammer pattern most of the times is invalidated by future price action. For this, a stop-loss and a risk-reward ratio keep the trading account safe.
But what if I told you that patterns work best when there’s an “incentive” to trade them? Or, something that leans the odds in favour of the pattern?
Moving averages in trading serve this purpose. Only for this to work, we need the biggest one possible: the EMA(200).
Therefore, the first thing to do is to apply the EMA(200) on a chart. Any chart.
Next, look for the last leg of a pattern (either continuation or reversal) to touch the EMA(200). Finally, look at the move to be the final “kiss” before the pattern fulfils its purpose.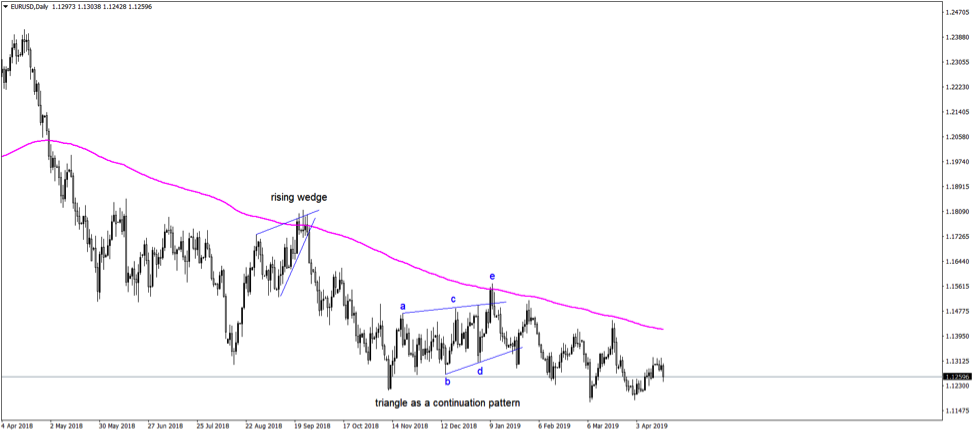
This is the EURUSD daily chart with the EMA(200) on it. The pink line offers two possibilities to go short the pair.
First, the price reaches the EMA during the last phase of a rising wedge. Remember, a rising wedge most of the times “falls,” bringing a bearish sentiment to the market. The fact that the last phase of it forms while the price reaches the moving average comes to reinforce the pattern.
Second, the price reaches the EMA during the last leg of a contracting triangle. Because of the bearish trend already in place, the triangle acts as a continuation pattern.
Support and Resistance when Using Moving Averages in Trading
This is a classic strategy to use moving averages in trading. Yet, it can’t be omitted from any article dealing with how to use moving averages in trading the financial markets.
However, we won’t use any chart to illustrate how support and resistance work. Instead, we’ll provide this quick guide on how to use the levels.
Firstly, apply the desired moving averages on the chart. Ideally, use the 50, 100 or 200-day one.
Secondly, look at the type of market condition: bullish or bearish. When the price is located below the moving average, the market is bearish. Naturally, when it stands above the moving average, it shows bullish conditions.
When the market touches the moving average, go long/short targeting new lows/highs. Ideally, look to incorporate a risk-reward ratio based on the distance to the take-profit, as that one is initially known.
Pro tip: avoid trades after the first two attempts at the moving average.
The ability of price to reach the moving average after that signals a countertrend strength that many want to avoid.
Golden and Death Crosses – Derived Moving Averages Trading Strategies
A golden or death cross strategy involves two moving averages. Originated from the stock market many years ago, it has the SMA as the classic setup.
However, for all the reasons given in this article so far, the EMA gets better results because it reduces the lagging time until we see a reaction.
The two moving averages used are EMA(200) and EMA(50). When the fastest average moves below the slower one, the market forms a death cross. In trading terms, it means that it is time to sell.
On the other hand, when the faster average moves above the slower one, a golden cross appears. In other words, it is time to buy.
Rules
First, wait for a golden or death cross to form. Ideally, use the daily timeframe, just like the chart below shows:
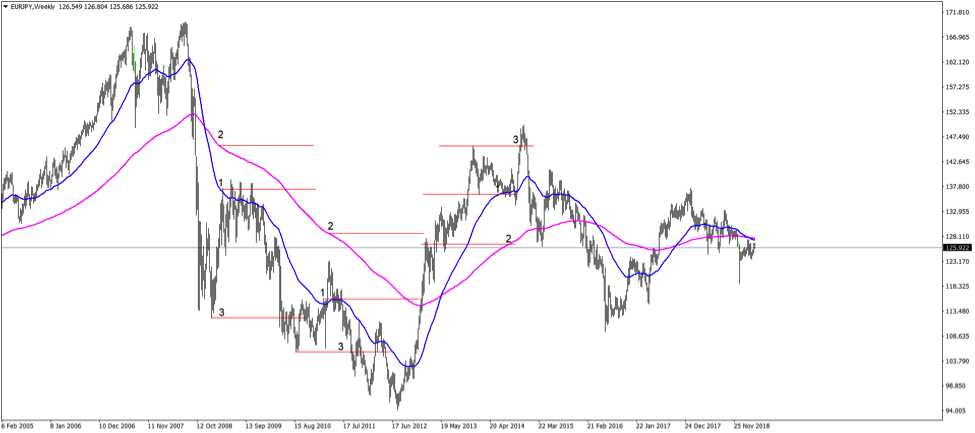
It is the EURJPY daily timeframe with the EMA(200) (the magenta line) and EMA(50) (the blue line) on it. From left to right, a death cross formed when the blue line slipped below the magenta one.
Second, wait for a pullback into the EMA(50). Marked with 1 on the chart, that’s the entry place.
Third, place the stop-loss at the EMA(200). Marked with 2 on the chart, it shows the invalidation point.
Finally, set the take-profit at new lows. Marked with the number 3 on the chart, it represents the exit point.
Drawdowns
This moving average trading strategy derived from a death or golden cross has some drawdowns. Mainly, it rarely offers a good-enough risk-reward strategy.
The example explained above does provide a solid risk-reward ratio (that is, bigger than 1:2 – meaning the reward exceeds the risk by a factor of 2 to 1). But looking at the other setups on the above chart, reveals setups with poorer risk-reward ratio.
Another drawdown is that in tight ranges it tends to change direction quite often. But, there’s a solution to that. That is, if stopped, the easiest way to make the most of this strategy is to reverse the trade and recover the loss.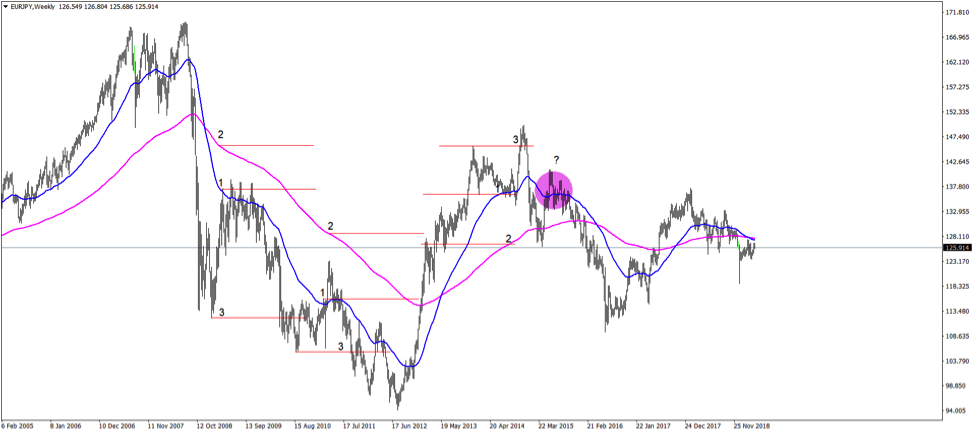
Before showing you an example of a reversing trade, here’s a situation to consider. See that circle on the chart above? Is it a proper setup according to the strategy described? The answer is a solid no.
Here’s why. The market is in a bullish setup, given by the earlier golden cross. Hence, we shouldn’t look for selling, but for buying.
How about this instance?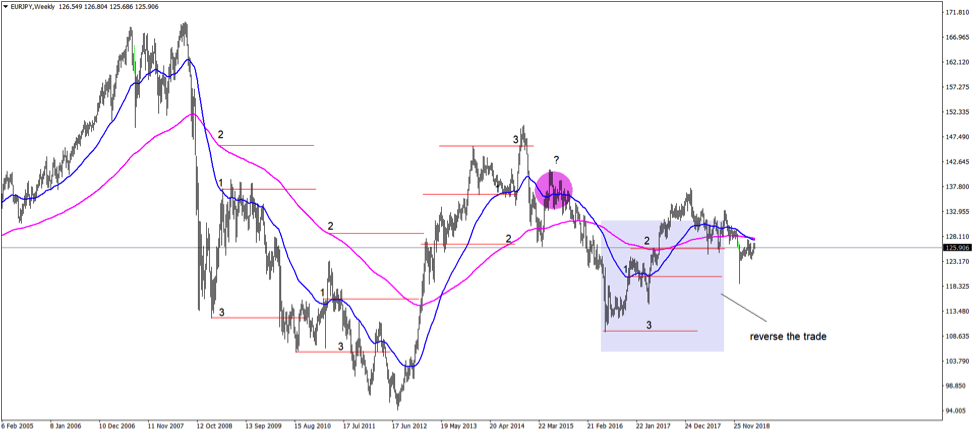
This is different, it is a valid signal. To start with, the setup comes after a death cross. Moreover, the market bounces into the EMA(50). Finally, it is stopped on the EMA(200). However, reversing the trade proves to be the right decision, as the price action quickly recovers the initial loss.
Trading Strategies to Profit – Combining Moving Averages with Oscillators
One of the most interesting ways to use moving averages in trading the markets is to combine them with various oscillators. Oscillators act in different ways, mostly filtering false information given by current price action.
An oscillator, just like a moving average, considers multiple periods before plotting a value. It typically appears in a separate window, at the bottom of a chart.
Most traders use oscillators in range trading. When they spot a range, overbought and oversold territory become the favourite places to sell, respectively to buy.
Moreover, bearish and bullish divergences help in detecting false breakouts. Both approaches (overbought and oversold plus divergences) are well-known in the trading community.
But how about combining an oscillator with a trend indicator? In fact, many technical analysts argue that indicators in both categories give similar information.
More precisely, that all trend indicators act the same way. They lag the price action, and traders buy dips and sell spikes when reaching them.
Or, all oscillators have an overbought and oversold area. And trading divergences works on all of them.
In other words, picking one (your favourite) from both categories is enough for a proper market analysis. Why not combine the information provided by both before deciding to go long or short?
EMAs Plus RSI – The Ultimate Moving Average Trading Strategy
What I’m about to show you next is a moving average strategy that also uses an oscillator. I chose the RSI (Relative Strength Index) for various reasons.
First, it is widely known by all traders. It turns out it is the first option when picking an oscillator to filter market moves.
Second, it comes with precise levels of what overbought and oversold means. Unlike other oscillators, the RSI marks those levels (70 and 30) clearly, so there’s no confusion in interpreting them.
Therefore, this strategy combines the EMA and the RSI info. And, it tells us if we should expect a bounce from the EMA or not.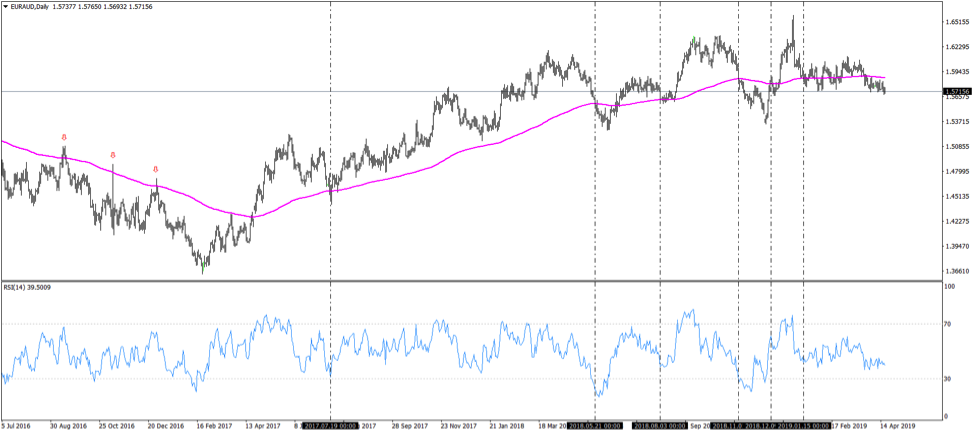
The EURAUD chart above has the EMA(200) plotted on it. It shows the recent price action on the cross.
Remember, we interpret the signals based on both the EMA and the RSI. Therefore, the vertical lines on the chart show when the price reaches the EMA. And, what the corresponding RSI value is.
The interpretation has several steps. First, wait for the price to reach the EMA. Second, at the closing, check the RSI value, if it is between the 30-70 territory or below, respectively above.
Finally, use the RSI to filter the price move into the EMA. More precisely, if the price reaches the EMA and closes beyond, check what the RSI says.
For a bounce from the EMA, the RSI must be above the 30 level. For a continuation into further bearishness, the RSI should close below 30. Obviously, the opposite is true on the 70 mark.
The three examples on the left side of the chart are relevant too. The price reaches the EMA.
Before I move on to the conclusion, here is a video that I have created on how to insert moving averages to you charts on TradingView.
Conclusion
The moving averages trading strategies presented here reveal many known facts. But, above all, they focus on combining elements of money management so that the trading account benefits the most.
The use of moving averages in trading is an old technical analysis concept. While most traders like the trending component of a moving average, it is not the only way to use them.
In this article, I’ve shown how to combine moving averages with other technical analysis patterns and indicators. Moreover, I’ve used risk-reward ratios, the essential part of any money management system to make the most of derived moving averages trading strategies.
As always, one needs to be careful about the drawdowns of using moving averages. The biggest one, the fact that they are lagging indicators, is addressed by combining the moving average standard interpretation with an oscillator.
The perfect order setup addresses this issue as well. On top of it, it offers a clear distinction between bullish and bearish markets. In other words, it tells the trader what to do on the lower timeframes: sell or buy.
To sum up, moving averages in trading have a great potential. That is especially true if traders integrate money management rules with trading signals generated from the moving averages.
Happy Trading,
Colibri Trader
P.S.
Check out my other article on Moving Averages Here