


The Most Detailed Historical Analysis of EURUSD
The Most Detailed Historical Analysis of EURUSD
The following article and the file included in the “Bonus” link below does go back in history and analyses EURUSD back to February 1994. I believe to have created the most detailed historical analysis of EURUSD that has ever been done online. As such it could possibly offer you a trading edge. I will only do the analysis and leave the trading edge search on you. Do not consider this article as a recommendation to buy or sell EURUSD, but merely as a powerful tool to add to your trading arsenal.
by: Colibri Trader
BONUS: Get The Most Detailed Historical Analysis of EURUSD
I would like to give you a bit of information first in order to make the most of my analysis in this file. The report that I have created does include historical analysis of EURUSD since 1994.
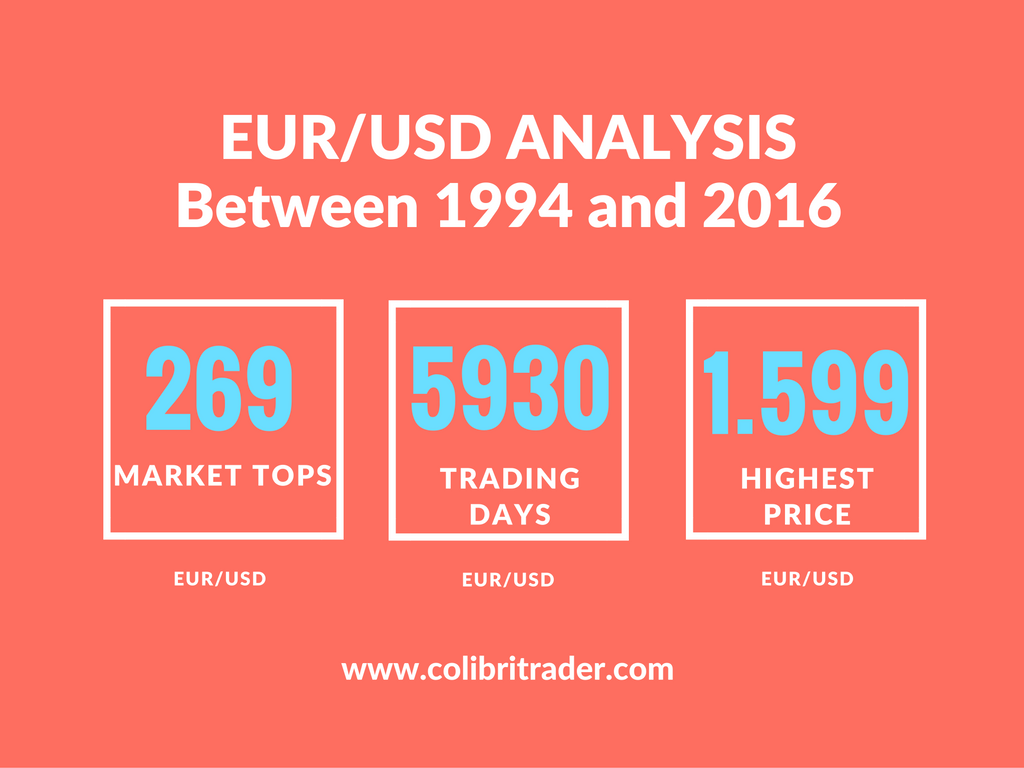
In this analysis, I have only analysed the currency pair from a daily timeframe point of view. There are 5930 trading days included in the analysis (or 8175 calendar days).
The highest price that EURUSD reached for that period was 1.599. The lowest price that EURUSD reached during that period was 0.827. There were a total of 262 market tops and 262 market bottoms. The average daily P/L% is 0.0014%.
I have created this E-Book in an Excel file, so you can easily download and use the data for your own trading analysis. I have used a professional software to collect the data.
In this file, you will find powerful information for candlestick formations- for example, how many times a market top was preceded by a Hammer (a.k.a. Pin Bar). You will find also how many times was a market bottom preceded by a Bullish Engulfing candlestick pattern.

In the most detailed historical analysis of EURUSD, I have included other metrics such as Moving Averages and Oscillators. For example, I have used a comparison of different combinations of moving averages and shown how EUR/USD has behaved in time. I have also included some of the most popular indicators such as RSI,MACD, Stochastic, Momentum, ATR30, etc. to analyse the behaviour of the EUR/USD since 1994.
As mentioned above, you will find detailed information regarding 50 candlestick patterns, which will shed light into your trading. In the most detailed historical analysis of EURUSD, I have also included detailed information about market tops and bottoms. The analysis is so detailed, that you will find data such as what percentage of times does a bar closes on its high or low at a market top. I have also included data about what percentage of times does a cross between SMA10 and SMA50 occur before another reversal pattern.
In “The Most Detailed Historical Analysis of EURUSD“, you will also find on which month or day of the week is the EUR/USD most likely to reverse.
I have tried to analyse this pair from as many angles as possible and I believe that no better dissection of the pair has been done for free in such details. Why I am doing that? I have been thinking of a way to give back to my trading community and found this to be the best way to do so.
The Most Detailed Historical Analysis of EURUSD
In the text below, I have included a brief history of the Euro the counterpart of the US Dollar.
European official start of the Euro currency, the solemn moment that the banks officially started to use the European currency. It was celebrated as if it was a birthday party.
At 13:51 or 13:15 on 31 December 1998 time, the President of the European Commission, Mr. Jacques Santer and his Monetary Affairs Commissioner Mr. Yves Thibault de Silguy, pulled the curtain from the electronic scoreboard to reveal to EU finance ministers the rates.
Roy Gillett (Considerations Jan/1999) gives the Euro as 1/01/1999, 00:00 MET Frankfurt-am-Main, as the birth chart “even though no official trading is possible yet.” He continues that the First Trade Chart is 1/04/1999, 7:00 AM, Auckland, New Zealand which is 12 hours before the Frankfurt Exchange opens.
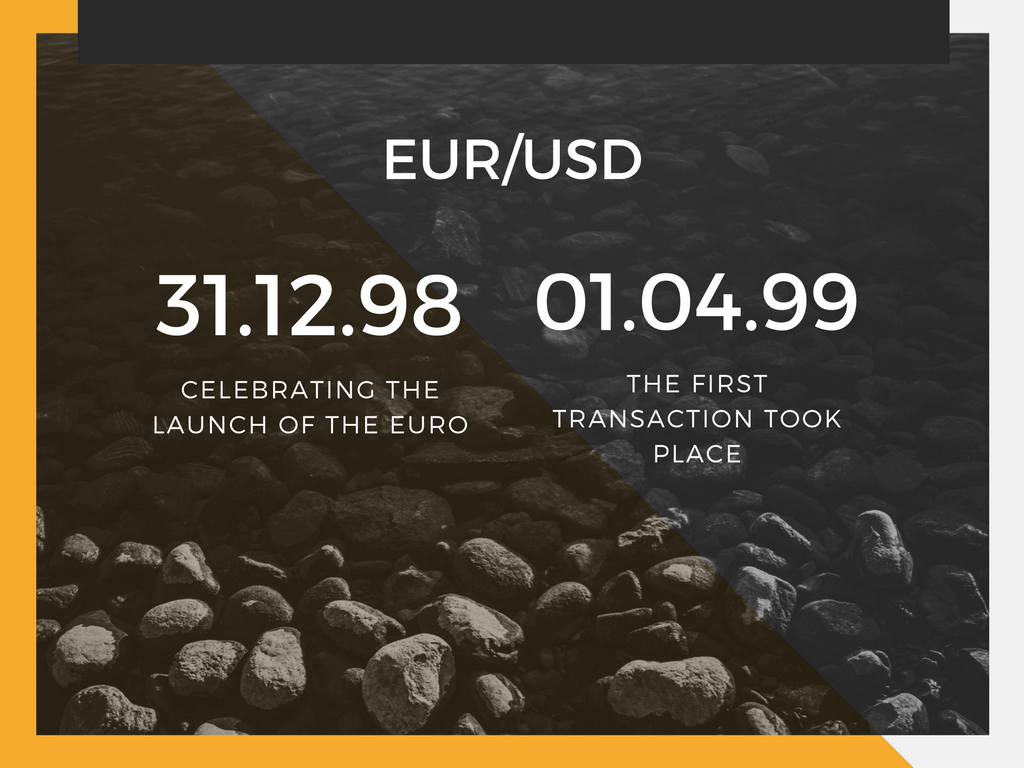
Marion March responds to Gillett’s article (Considerations Mar/1999) by quoting an email from Tees Reisma, “The First Euro transaction took place on 1/01/1999 at 00:00:01 AM, Frankfurt, Germany when the vice president of VISA paid for a bottle of champagne in the bar with his card: shown on TV.”
Marion adds that “according to my information, the birth of the Euro should be cast for Brussels, Belgium, rather than Frankfurt.”
Roy Gillett responded, “My information came from Reuters TV, who informed me that all trading prior to 4th January would be unofficial. He would not know until then how much he paid for his bottle of champagne!
The official EU-rep of all participating countries, Austria’s Minister of Finance, signed the contract that brought in the Euro common currency on 12/31/1998 at 13:15 MET, Brussels, Belgium.”

Update 14 March 2015 by ATR: The Euro was not introduced in the afternoon of 31 Dec 1998. There was a meeting in Brussels on that day, which decided on the final fixed exchange rates between the Euro and the member currencies.
The Euro was introduced at midnight between 31 Dec 1998 and 1 January 1999. This intriduction had long before been decided by member states and EU institutions.
The next step was 1 January 2002, when the member currencies were taken out of circulation and the actual money (bills and coins) were replace by Euro bills and coins.
The Most Detailed Historical Analysis of EURUSD
Stages of EURUSD Development
A) First Ideas
In 1929, Gustav Stresemann from the League of Nations suggested a European currency. This idea was reminiscent of an earlier memory of the Latin Monetary Union, which involved France, Italy, Belgium and Switzerland and which disintegrated after the WWI.

Later in October 1970, a report published by Pierre Werner (Prime Minister of Luxembourg) recommended centralization of the national macroeconomic policies. He still did not propose a single currency or central bank. The “snake in the tunnel” created to limit the fluctuations of EU currencies failed, as well.
In 1971, US President Nixon removed the gold backing, which led to the collapse in the Bretton Woods system. This led to the creation of the European Monetary System (EMS) in 1979. In 1986 the Single European Act formalized political co-operation within the community.
Two years later- in 1988 France, Italy and European Commission backed a fully monetary union.
B) Re-Launch

In 1989 was introduced a plan, which included the creation of the European System of Central Banks. Three steps were outlined before the creation of the monetary union:
1) Liberalization of capital movements in the European Economic Community
2) Maastricht Treaty was signed in 1992, which agreed for the creation of the single currency
3) The British Pound sterling was forced to withdraw from the fixed exchange rate system due to the quick fall in value of the pound (Black Wednesday).
C) Last Stage
In 1994 the European Monetary Institute was created- the predecessor of the European Central Bank (ECB). In December 1995, the name “euro” rolled out, as suggested by Theo Waigel- Germany’s finance minister. The agreed launch date was the 1st of January, 1999.
In 1998, 11 initial countries were selected to participate in the new currency state. There were strict criteria for the member states. Among those were: debt ratio of less than 60%; low inflation; budget deficit of less than 3% of GDP; interest rates close to the EU average.
Just before the launch, on 1st of June 1998, the ECB succeeded the EU Monetary Institute. Its first president was Wim Duisenberg. The conversion rate was based on the market rates of the ECU. One ECU would equal one EURO.
The Most Detailed Historical Analysis of EURUSD
The EURO- 1st of January, 1999- The Launch
The euro became the successor to the ECU. Officially, the new currency started being distributed in the beginning of 2002.
When the euro was launched in 1999, the exchange rate to the USD was 1.1686. This was the first official exchange rate between the two currencies. Until the end of 1999, the EUR dropped to parity with the US dollar.
Minting
 The true design for the notes and the coins was done between 1996-1998. By January 2002, 38 billion coins and 7 billion notes were available to consumers. The first place where the new euro notes and coins were valid was the French island of Reunion. The first purchase was buying a kilo of lychees.
After the launch of the euro, nations were allowed to keep their currency until 30 June 2002. Even after the 30th of June, they were still accepted by the national central banks.
EURO Shocks
There were a few significant drops in the value of the euro against the US dollar and the Pound.
-On the 26th of October 2001, the EURUSD rate was
0.8296.
-On 15th of January 2002, the EURUSD went down to 0.8115.
-On 6th of November, the euro dipped below $1.00 again to 0.9971.
Late 2000s and the recession era
Between 2007-2009, a few more states joined the Eurozone. These were: Slovenia, Cyprus, Malta, Slovakia. The Eurozone entered its first official recession in the end of 2008. In the second and third and fourth quarters of the year, the EU was in negative growth.
Then again, in the first quarter of 2009, the EU was in a negative growth until turning back into an anaemic positive growth in the second quarter of 2009.
The risk of a default in Greece and other members led to bailing out member states. This was against the EU treaties, which were not taking into consideration any bail out of a EU member.
For this purpose, a special system was developed called SPV or Special Purpose Vehicle, which name was “European Financial Stability Facility”. The purpose of this vehicle was to preserve the financial stability in the union.
Then, new rules were agreed, according to which if a country was to run a deficit, they would have to justify it. Countries with a debt of more than 60% were about to face stricter sanctions.
In 2010, Germany and France agreed on suspending the voting rights of members who breach those rules. In 2011 a new reform commenced- the Stability and Growth Pact. Its purpose was to streamlines the processes in the EU.
Conclusion- The Most Detailed Historical Analysis of EURUSD
Again- why have I compiled the most detailed historical analysis of EURUSD for free? I have been thinking of a way to give back to my trading community and found this to be the best way to do so.
I believe in the law of reciprocity- the more you give back, the more you will receive in return. In this case, I believe I have received enough support from my followers and this is a way to say Thank You!
It has been a great 2016 and without you, I would not felt so special. I did create this blog about two years ago and it has now turned out to be followed by thousands of traders. I really hope you are enjoying the ride as much as I do!
Please share this article if you believe that it will help you become a better trader! This will help me help even more traders in the trading battle for survival!
P.S.
Check out my popular article on Support and Resistance HERE
or download the Free EURUSD Historical Analysis if you still have not done so
Very nice just amazing detailed information
Thanks Paresh. Let me know if there is anything else you would like to read about.
Colibri