


Head And Shoulders Pattern- 5 Strategies That Work
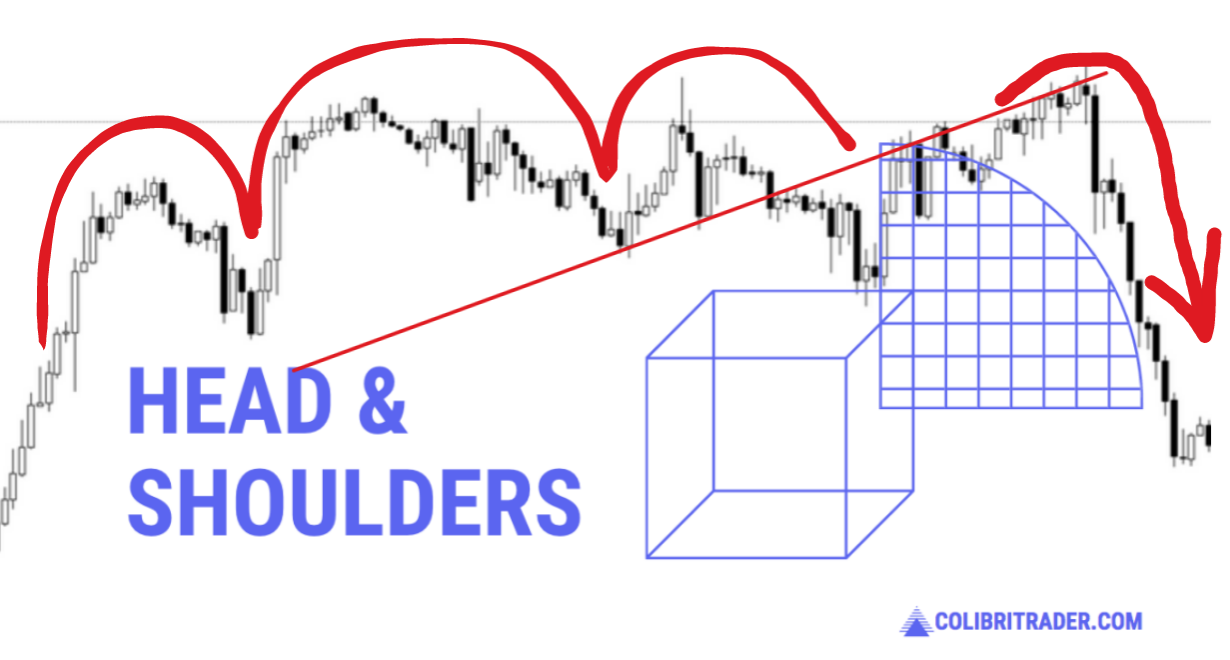
Head and shoulders patterns…do you remember your first charts’ analysis?
We all try to make sense out of this trading world, charts especially.
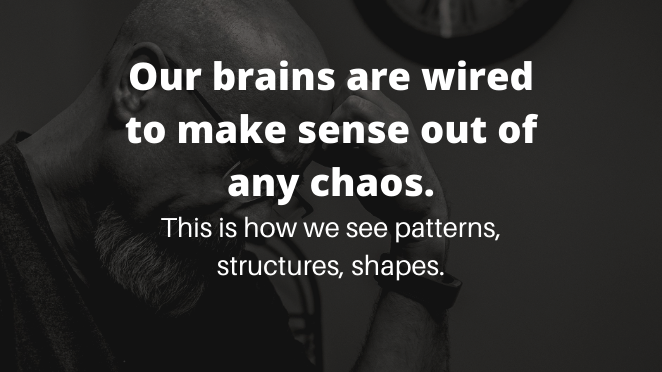
Our brains are wired to make sense out of any chaos.
This is how we see patterns, structures, shapes.
Your first trading analysis, before you knew about strategies and indicators, was likely chart pattern reading.
Before we move on to head and shoulders pattern working examples, you should read some research I have collected.
Even if you are an experienced chart pattern trader, some of the information below might be new to you.
Contents in this article
- Head and Shoulders’ Impact
- Head and Shoulders Studies and Tests
- Strategy #1 Head and Shoulders Using Zig Zag
- Strategy #2 Head and Shoulders and Trend Reversals
- Strategy #3 Head and Shoulders and Aggressive Reversals
- Strategy #4 Head and Shoulders Using Volume with Inverse Head and Shoulders
- Strategy #5 Head and Shoulders with Renko Charts
- Conclusion- Trading with Head and Shoulders
Chart Patterns and You
When we look at the clouds, we will often find one that resembles some animal or a face.
These patterns are not made by people but by the many forces of nature.
Of course, when we zoom out to great heights, we see cyclones and other patterns that help us predict the weather.
However, as beginners and from the ground, we do not see the big picture, or the patterns that work.
Only a handful of patterns have value, and rarely a single one can help.

To understand chart patterns, always have the following facts in mind.
After all, head and shoulders or any of the other chart patterns might not be what you think they are.
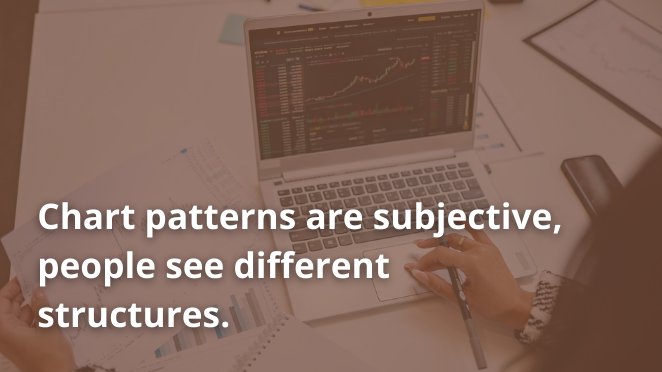
- Chart patterns are subjective, people see different structures.
- Head and shoulders patterns can repeat many times, but you might not spot them easily.
- Spotting chart patterns is fun and our brains can easily neglect other analysis methods.
- Because they are fun they are also popular, still this is not a proof they work for you.
- Trading just on a head and shoulders pattern will not get you far.
Head and Shoulders’ Impact
The head and shoulders pattern is a popular price action analysis method because it is one of the first out there.
To some, chart patterns are just a result of other analyses and market forces, such as supply and demand.
Head and shoulders might appear along with supply and demand zones, but these traders think chart patterns are not market drivers.
They are right to some extent, however, but what about groupthink theory?
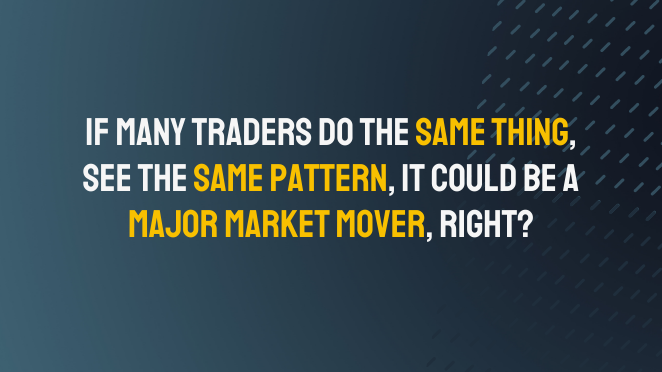
If many traders do the same thing, see the same pattern, it could be a major market mover, right?
Such occurrences are hard to prove, especially when we know chart patterns are subjective.
Many traders use the 200 EMA, for example.
Ask yourself, can you notice any significant changes in EMA 200 price crosses (so-called golden cross)?
200 EMA appears the same to every trader when we look at the same chart, for example, the Bitcoin chart on D1.
Traders interpret chart patterns differently and not all will see the same number or structure of head and shoulders.
Question: Is this the only head and shoulders you see?
Therefore, chart patterns do not have a collective impact that could move the market, especially on the lower timeframes.
Of course, fundamental factors are still major forces that drive prices, not indicators or patterns.
To sum up:
- Head and shoulders are less reliable on lower timeframes
- Chart patterns are rarely market drivers
- Some indicators can create a bigger impact than head and shoulders

Chart Patterns and Consistency
It is known that successful traders are consistent.
Their success firstly comes from the relentless constant in following their rules.
We have mentioned these pillars of trading many times.
Chart pattern trading is no different.
But let’s try to see how consistent chart patterns are.

It is really hard to conclude if the head and shoulders pattern is consistent if we know the fact it is subjective.
Science always uses measurements.
To measure if they have some strategy that works, professional traders backtest and journal.
Head and shoulders can be backtested, unlike some repainting indicators, for example.
This is a good thing, but can you spot the same head and shoulders you did before?
Not always.

A minus for consistency here, without even looking at the performance measurement.
Measure the win rate of every head and shoulders pattern you notice.
Also, money management or where you put your stop-loss is inconsistent with patterns, since their structures varies.
Now the following questions arise in the head of a trader:
- How consistent is your head and shoulders recognition strategy?
- What is your win ratio, given a simple risk management setup?
- Is it better than other tools?
- How do you incorporate your risk management with patterns?
- What price action pattern ends the pattern?
Head and Shoulders Studies and Tests
I have to present some truths that came out of studies that have been done on chart patterns.
The results can put you away from using them completely on their own.
However, some traders include them in their list of successful trading strategies.
One thing is certain, if they do, they are just one element of their analysis.
Because the chart patterns are easy to follow, they are often promoted without honest intentions.
Head and Shoulders On The Internet
The internet is full of sales, promotions, click baits and other marketing gimmicks that have nothing to do with successful trading.

They are easy to understand too since most beginners will like them.
All this creates a great “opportunity” for marketers and scammers.
They will show you the head and shoulders pattern that works every time, so you can buy their pattern recognition script.
Important: Young traders also have the so-called “Optimism Bias”, making them discard warning signs.
Now, studies of all chart patterns, including the head and shoulders, have shown that they do not work.
Here are the 3 key reappearing conclusions of the studies.
1) Head and shoulders patterns are random appearances.
This conclusion is derived by comparing real data and random data.
The patterns emerged on both with the same quantity.
While real markets are not completely random noise, head and shoulders could not point a difference.
2) Once head and shoulders emerged, the performance on both random and real markets was the same.
So not only do the patterns appear at the same rate but they do not increase the probability of winning.
If you do have some positive results it is likely to be a side effect from your good money management skills.
The third conclusion is about the effect head and shoulders patterns have on the market.

3) Head and shoulders had small predictive value on emerging or small-cap markets but were still regarded as noise.
What’s more, a study from New York Federal Reserve points that head and shoulders strategies are not profitable.
They are not profitable despite some activity was measured when the patterns emerged.
Simply, the effect was not strong enough to be considered valuable to traders.
To conclude this research, consider these important takeaways:
- Head and shoulders or any other pattern trading must be used in conjunction with other trading elements.
- The studies mentioned never included any other elements that could be beneficial to the trader.
- Do your tests and trust your research, no one can dispute your consistent results over a long period of time.
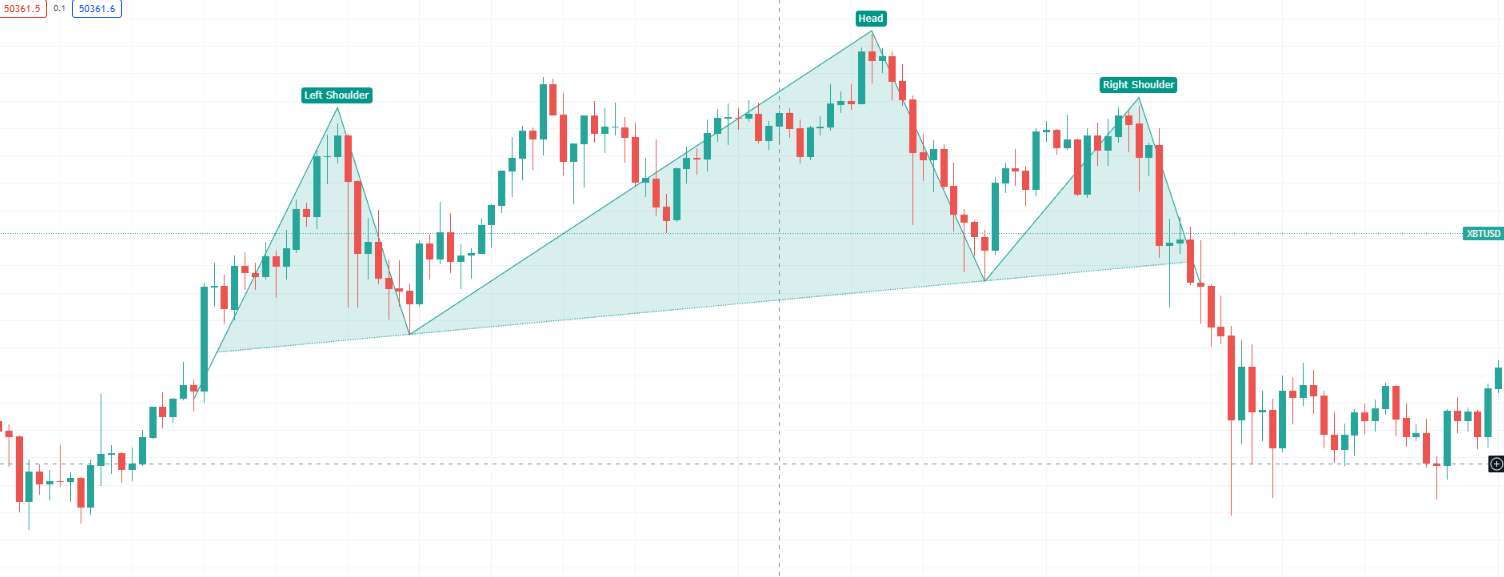
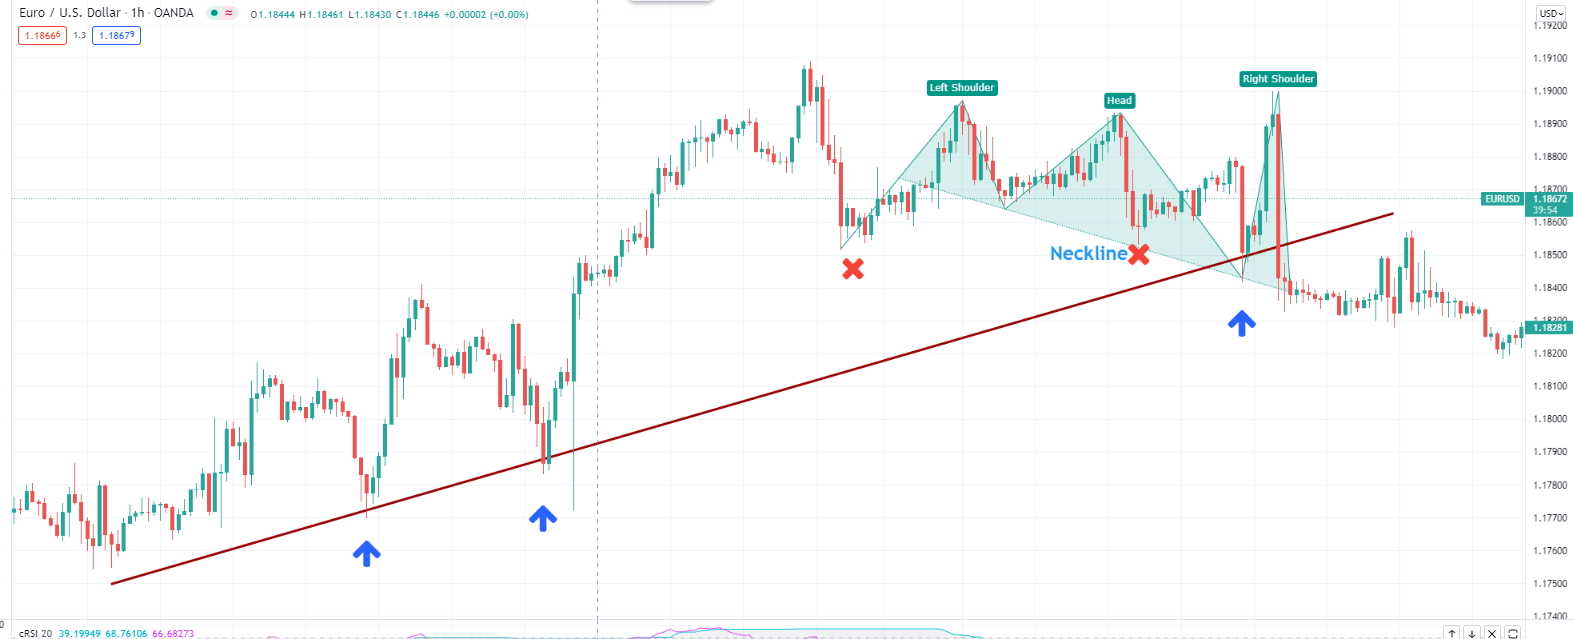
Strategy #1 Head and Shoulders Using Zig Zag
Zig Zag is a common indicator for plotting highs and lows on a chart.
Elliot Wave theory trading uses Zig Zag also to easily spot waves count.
Since the heads and shoulders pattern is defined by these points, it is easier to spot it with Zig Zag.
This example will use Zig Zag only to find the points where we draw heads and shoulders.
Pay attention to the Zig Zag settings.
Low depth will not help you in finding your head and shoulders.
1) Set Zig Zag in such a way that the head and shoulders pattern is at least 15 candles long.
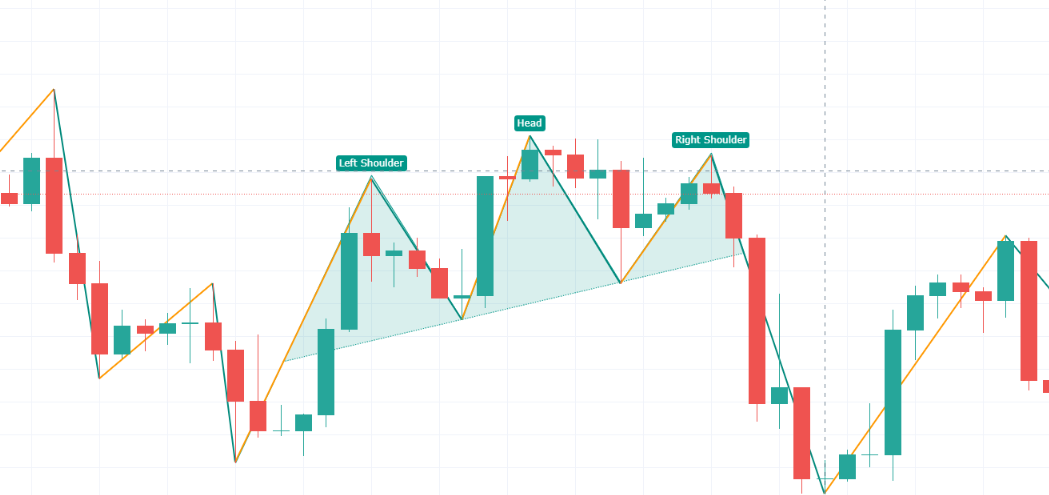
2) Now, drawing the pattern is easy, just follow the Zig Zag points.
You can practice drawing the pattern in the TradingView platform built-in pattern tool.
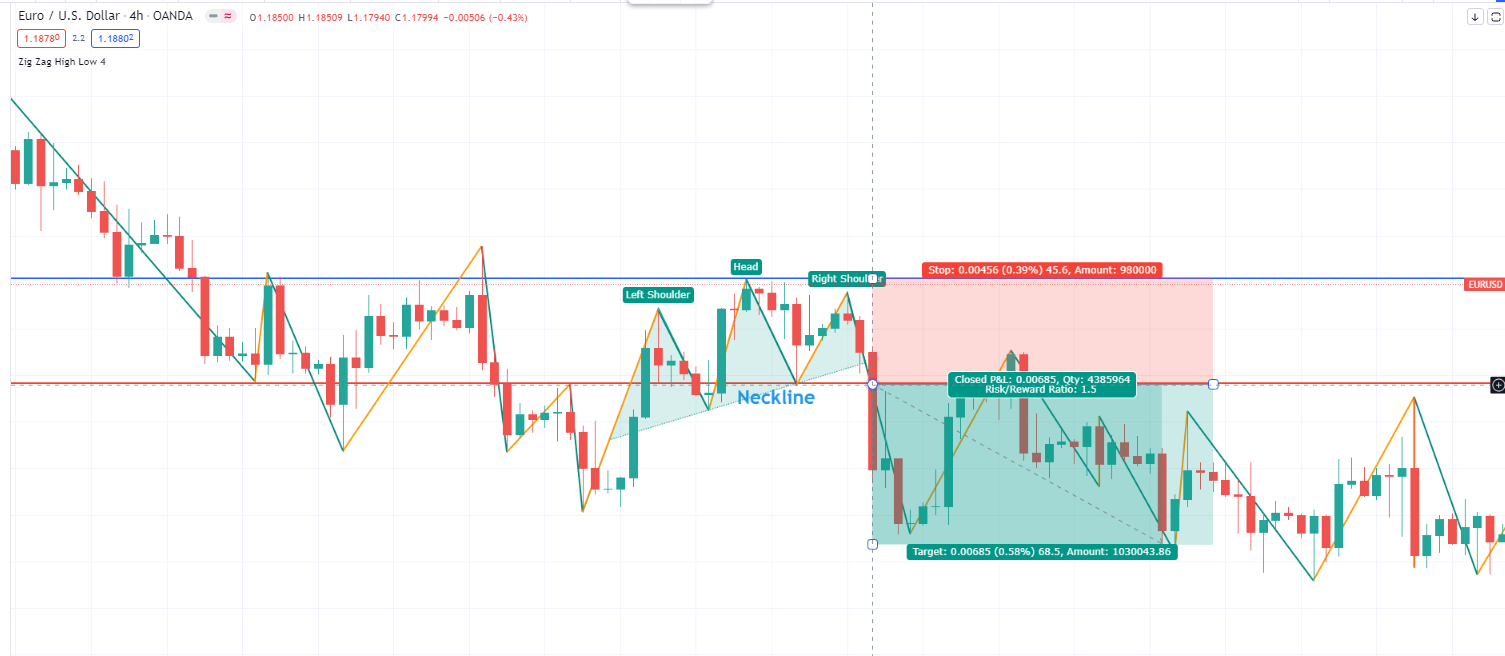
The picture above now has two horizontal lines and a trade entry.
The red line is the neckline which is drawn on the higher low, which is the base of the right shoulders.
3) Place the neckline so we can mark the level when we will enter a trade and also measure our Stop Loss level.
Place the Stop loss at the top of the head, marked with a blue horizontal line
The head and shoulders pattern is commonly drawn with the neckline to help with the Stop Loss placement.
- As in the picture, I have entered a short position once the price crossed the neckline down.
- Aim for 1:1.5 Risk reward ratio.
This is one simple but effective use of the head and shoulders pattern, however, pay attention to the following:
- Do not draw patterns that you are not sure are heads and shoulders.
- The head and shoulders pattern in this example is used with the prevailing bearish trend.
- Risk management based on the head level might be inappropriate when the head is too high.
- I have used 4 hours timeframe for this example on EUR/USD.
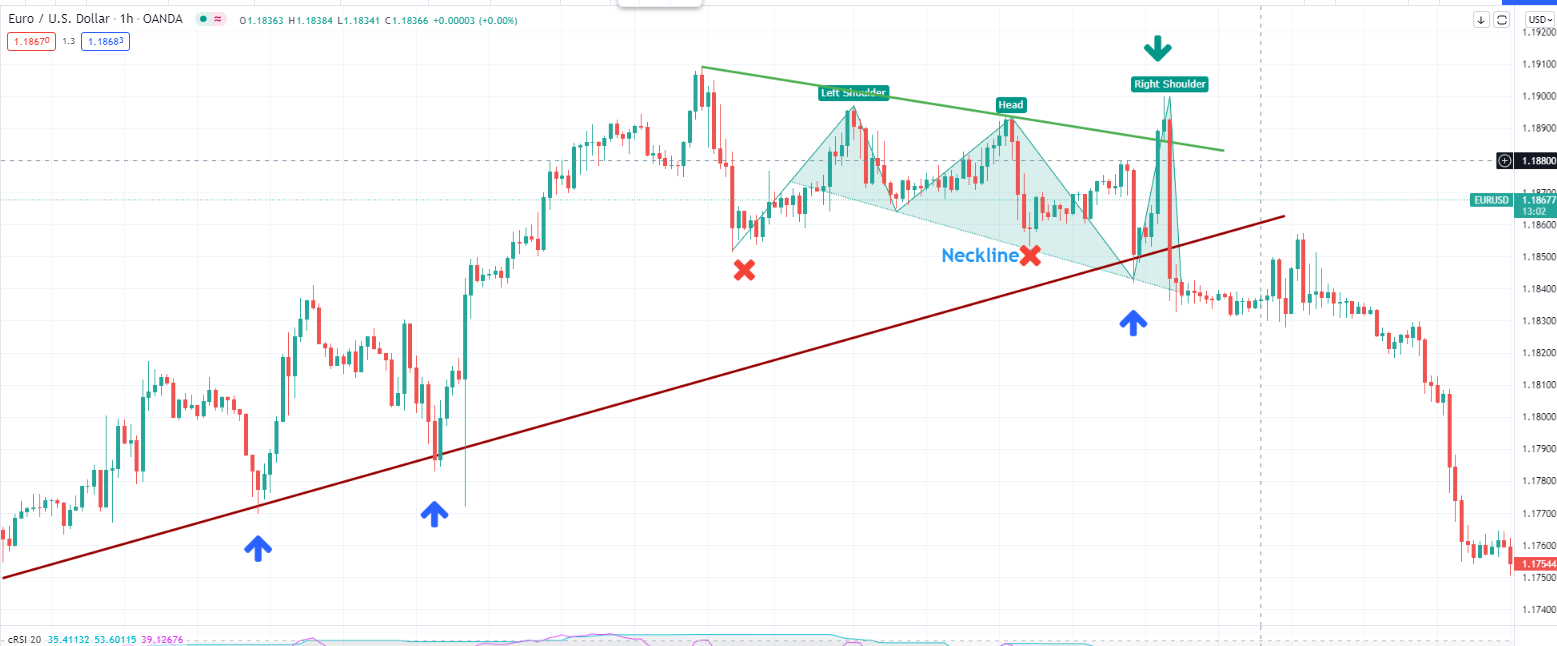
Strategy #2 Head and Shoulders Trend Reversal
Head and shoulders are considered a trend reversal pattern.
The reasoning behind this is that the pattern follows the price action structure break.
In other words, the trend slows down generating lower highs and lower lows.
In the picture below we have found a pattern with 4 whipsaws.
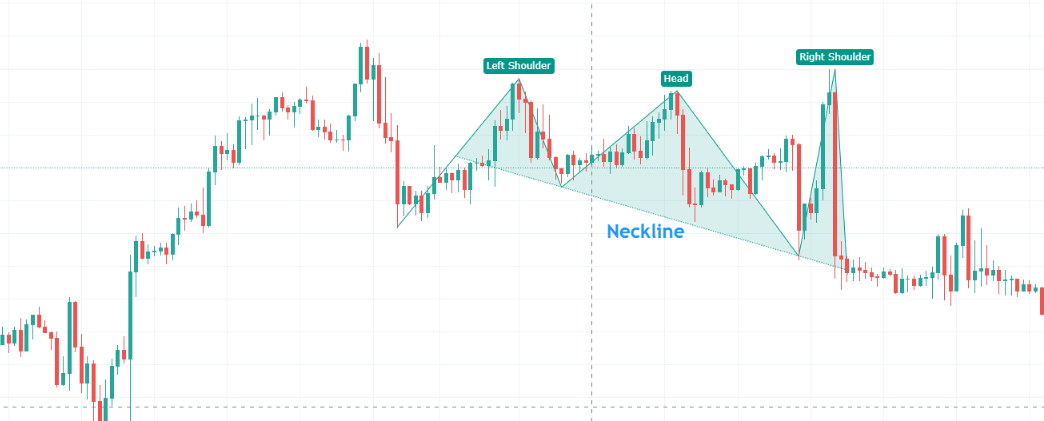
It is hard to pinpoint the “right” head and shoulders unless we follow the trend structure.
Also, notice the neckline is not the horizontal line based on the right shoulder like in the previous example.
- Here, I am using the TradingView tool that automatically connects the line using the shoulder lows.
- Now, to follow the trend structure, I will place a trendline that connects higher lows of this bullish trend.
The blue arrows show me the correct lows so that I can draw a trendline.
The red crosses are not the correct lows that follow the trend line.
This is how we know which head and shoulders pattern is more reliable.
Now, pay attention to the big red candle that crossed the trendline from the right shoulder.
This is the breakout candle and usually traders:
- Enter a short trade when the price is below the trendline, marking a new lower low and completing the right shoulder
- For stop loss placement traders usually aim the latest high and follow a 1 to 1.5 ratio for taking a profit.
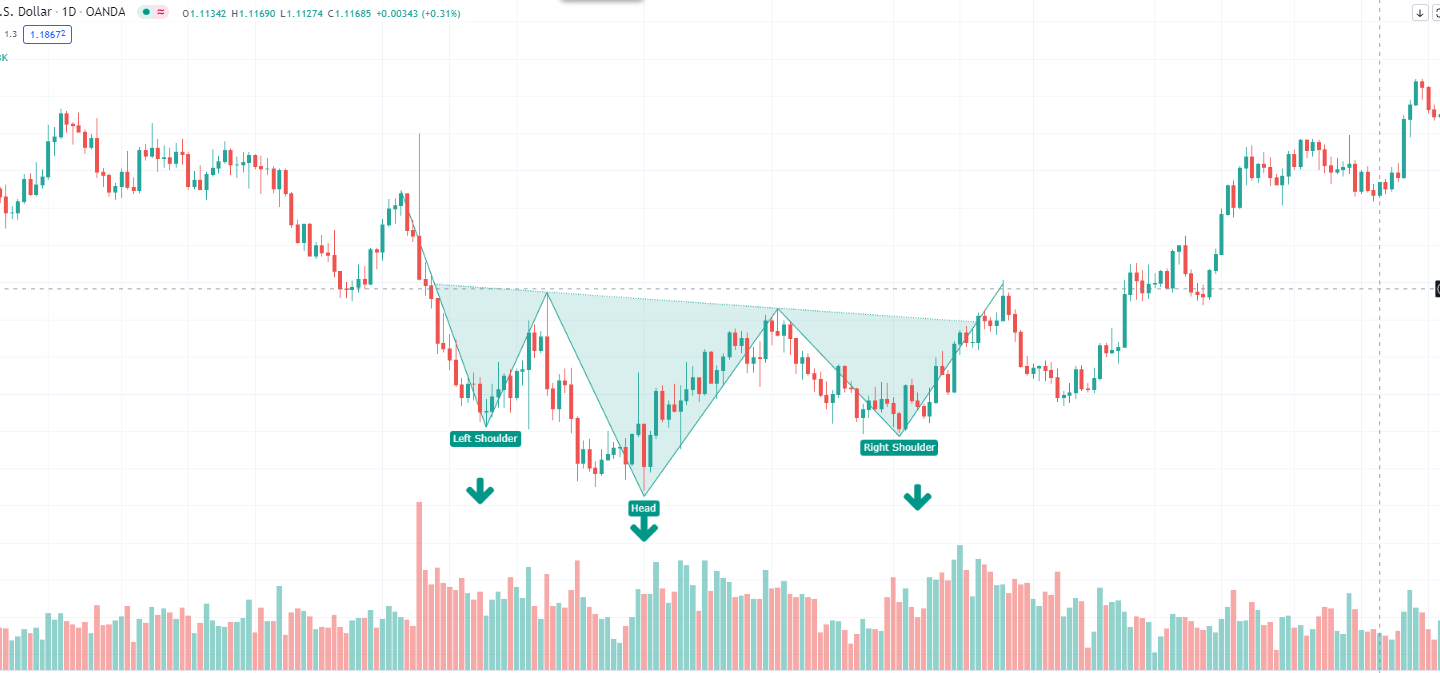
Strategy #3 Head and Shoulders Aggressive Reversal
Let’s use the same head and shoulders structure to show you how we can set up a more aggressive trade.
I have noticed two consecutive lower highs signalling a slowing momentum of the bullish trend.
1) Therefore, draw a trendline connecting the two highs so it looks like this:
Notice the trendline is connecting the head and the left shoulder.
This means the right shoulder high could be a very good aggressive entry before the pattern is complete.
Traders using this setup usually:
2) Enter a short pending order right at the green trendline where right shoulder high is expected.
I have marked that point with a green arrow.
Now, placing your stop loss is a bit harder in this example because we do not have an obvious reference.
The previous high is just too shallow to make for a reasonable stop loss.
In cases like this, you can use the ATR indicator or any other method.
If you prefer to rely on the price action only, use the distance from the neckline to the head’s high for reference.
3) Set your stop loss pip distance the same as the head high from the neckline.
Because this is a more aggressive approach before the head and shoulders are complete, I will use at least a 1 to 2 Risk:Reward ratio.
4) Place you take profit at 2 times the risk
And that’s pretty much it.
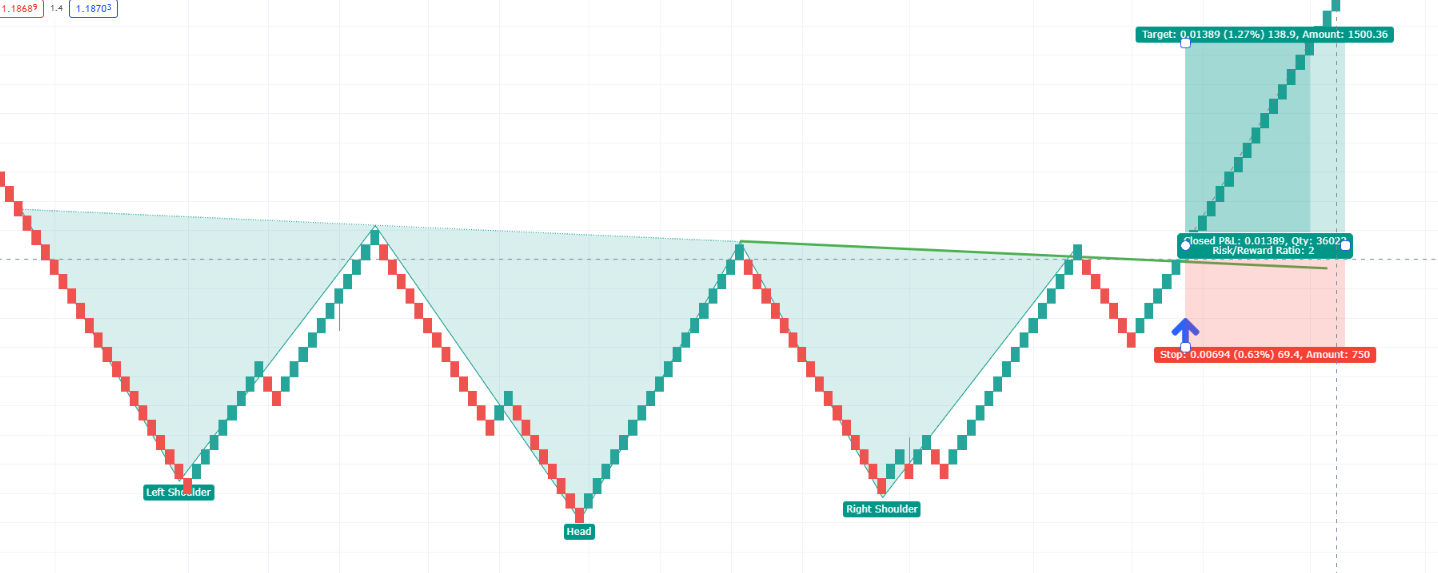
Strategy #5 Head and Shoulders Using Volume with Inverse Head and Shoulders
Since the head and shoulders pattern is a trend reversal, it also applies to bearish trends.
I will also include volume to confirm there is a head and shoulders pattern forming.
In the picture above notice how volume builds up on the left shoulder, the head, and the right shoulder.
These build-ups are the result of the supply levels evident only when we zoom out to see the big picture.
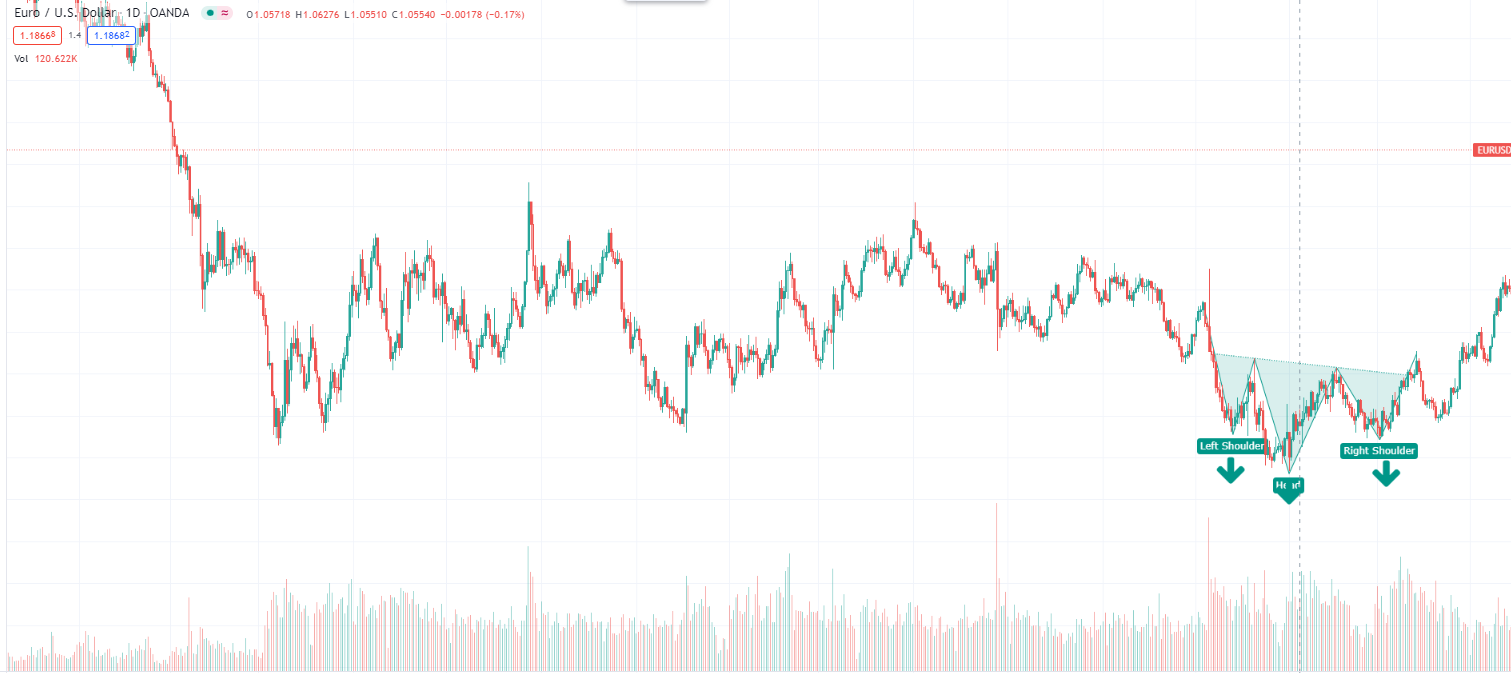
The picture above shows our head and shoulders pattern is around a previous strong support levels.
This fact increases the probability that the pattern will play out in our favour and the trend will reverse.
So not only do we have volume build-ups on each of the pattern elements, but we also have a historically strong support level.
1) Spot the usual head and shoulders pattern and confirm with increasing volume.
Now, I will not use the neckline as with previous examples.
I will wait for the pattern to complete with the right shoulder high.
Notice how head and shoulders can have pullbacks right after the right shoulder.
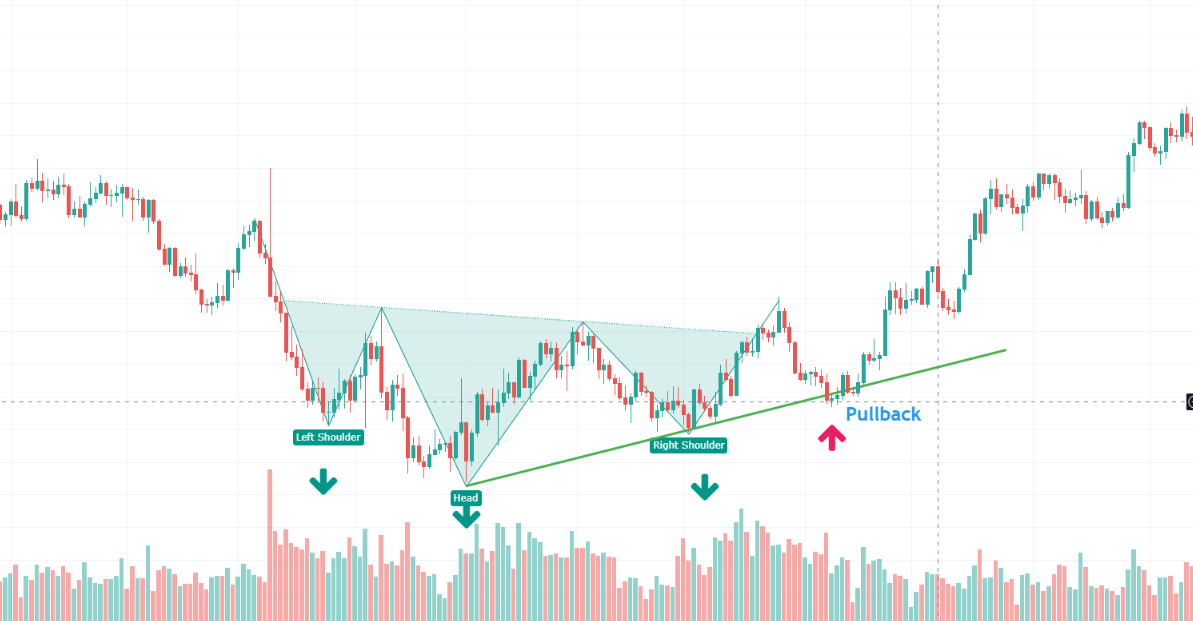
But we do not know exactly if the pullback will be strong enough or even if it will show up at all.
However, if it does show up, we have a much better trade setup since we have multiple confirmations of a trend reversal.
Additionally, we are entering at a much better, pullback discounted price.
Here is what traders usually do:
- Draw a trendline connecting the head low with the right shoulder low (green line in the picture).
- Once the price pulls back and crosses my trendline in the future, this is where traders enter a long position (red arrow).
For stop loss placement you can combine any method from the previous examples.
However, in this setup, I might use scaling out, too.
- Use the head low as your stop loss level and place your first take profit at 1.5 times the risk.
- Move your stop loss to breakeven once your first take profit is reached, closing 50% of your trade in profit.
At this place, your trade is risk-free.
Your second take profit can be set at 3 times the risk.
Alternatively, your second target can be closed using a trailing stop.
As you can see, this trend went on for 4 months with an intact structure.
This example is taken from the daily timeframe of the EUR/USD pair.
Remember the pullback may not appear at all, so these events are not as common as you might wish.
On the bright side, the risk and the reward are at a very good ratio.
Strategy #5 Head and Shoulders with Renko Charts
Renko is a great solution when it comes to noise reduction.
By using Renko, you also have a clear picture of the trend structure, support and resistance.
If you are a beginner trader, the Renko chart can be very useful.
Spotting head and shoulders with Renko has never been easier too.
If you want to know more about this radical chart reading method, refer to my full-length article on Renko charts.
Note that Renko does not factor in time or volume or momentum, just the price movement in pips.
Renko is easy to plot in TradingView since it is already a built-in feature.
The default settings use the ATR’s brick calculation.
But in this example, I will use the traditional method.
- Set up your Renko by clicking the layout button in TradingView.
- Right-click on the chart and select Settings and then change the “Box Size Assignment Method” to Traditional.
- Set the Box size to 0.001 in the same settings menu.
Now, these settings are fixed and comparable to the daily timeframe price movements.
Renko does not have a timeframe selection.
Depending on how much price will move in pips, the chart will create a new Renko brick.
It won’t take long to see how easy it is to spot relevant support and resistance levels now.
Head and shoulders patterns are also clear and are the product of key support and resistance levels.
Here is one I have found on the EUR/USD pair:
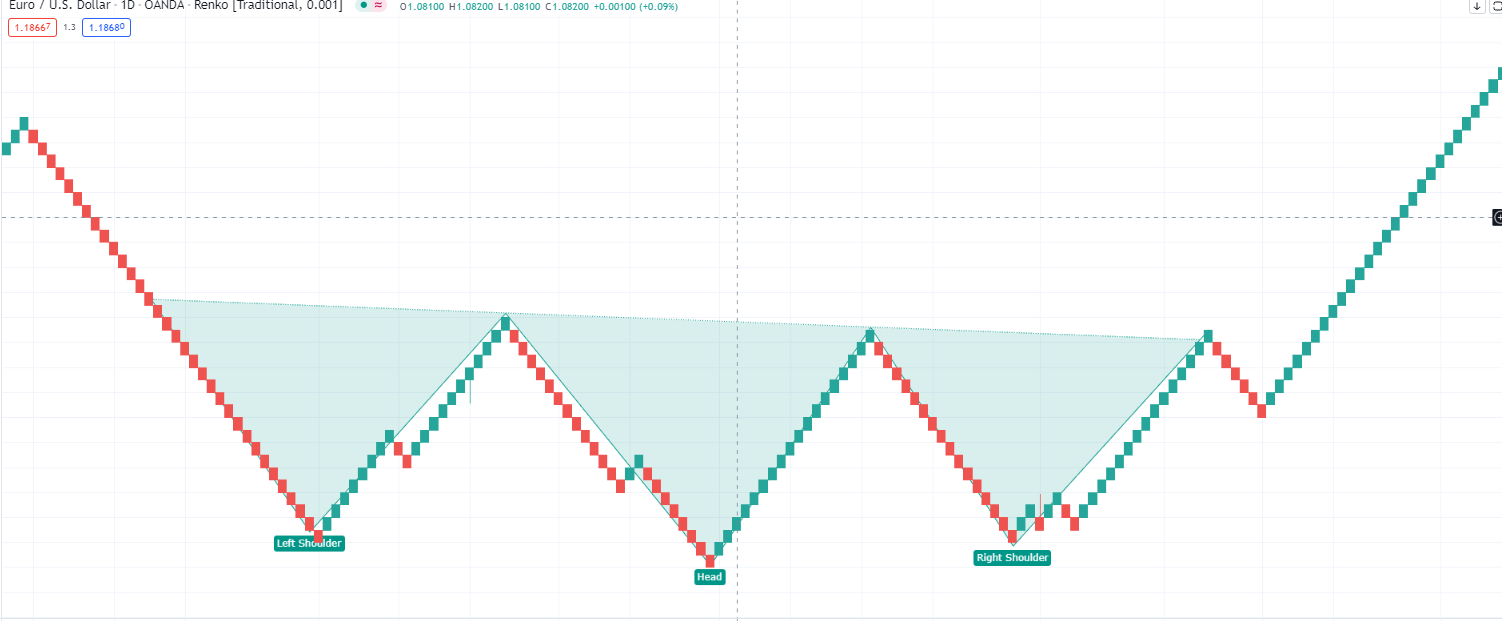
1) Draw your head and shoulders pattern connecting the obvious relevant points.
Here we have another inverted head and shoulders pattern and the plotted neckline.
Now, all I have to do to create a valid trade entry point is to extend the neckline like this:
2) Extend the neckline and wait for a brick cross up for a long entry (marked with a blue arrow).
The next thing to do is:
3) Set your stop loss at the previous low or use a fixed brick stop loss.
Since Renko based on traditional brick size is constant, every brick in my example resembles 10 pips move.
You can always open the same trade size and do not worry about volatility.
So, fixed brick stop loss can be 3 bricks in the opposite direction of your trade, just make sure your money management is sound.
4) Place your take profit two times the stop loss so your Risk:Reward ratio is 1:2 like in the picture above.
This example is more about the power of the Renko charts showing critical price action levels, opening many more options for your trading.
Conclusion- Trading with Head and Shoulders
Head and shoulders patterns can add up as a confirmation tool to your trading strategy.
There are so many ways you can trade with it, that it boils down to which trading style you like more or fits your personality.
In this article, I’ve intended to demystify chart patterns regarded as an unseen, secret method that makes you have an edge.
Even if the head and shoulder patterns do work for you, relentlessly follow proper risk management rules.
And hopefully, in the long-term, you will set your learning and trading priorities accordingly.
Happy trading,
Colibri Trader
Thanks for sharing this great knowledge with us.
Please, when will you organize course for advance learners?
you can check out my day trading course 🙂