


Fibonacci Levels in Technical Analysis
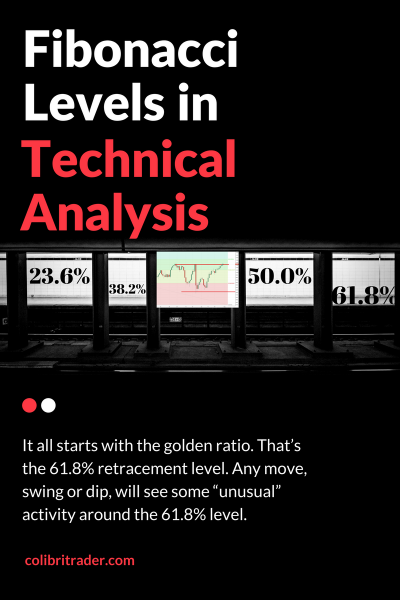
Fibonacci Levels in Technical Analysis
by: Colibri Trader
Every technical trader heard of the Fibonacci numbers. In a way, it is impossible not to. The most famous trading theories use these ratios.
Before the personal computer (PC), technical traders tracked the movement of a security on a piece of paper. Even then, the Fibonacci levels played an important role.
Today, any trading platform offers a special Fibonacci tool. There are multiple, separate Fibonacci tools to use, like Fibonacci retracement, expansion, arcs, fan, time zones, and so on.
In fact, for trading purposes, it depends very much what your technical setup is. Some may use the Fibonacci retracement only, others will base their entries on the time zones, and so on.

No matter the trading theory, the Fibonacci sequence is the same. Out of the tools mentioned above, the Fibonacci retracement and Fibonacci expansion levels are the most popular ones.
Traders use technical analysis tools to find out places to buy or sell a currency pair. The more visible the setup is, the more likely traders will use it again. Either on a different currency pair or on a different time frame.
However, diversification matters too. For example, if you open a chart and draw ten different Fibonacci retracement tools on the screen, the result is worthless.
The idea is to combine the strength of the Fibonacci ratios with other technical analysis tools. Or, with other trading theories. Or, both! The more reasons or arguments for a trade.
The Most Important Fibonacci Levels
It all starts with the golden ratio. That’s the 61.8% retracement level. Any move, swing or dip, will see 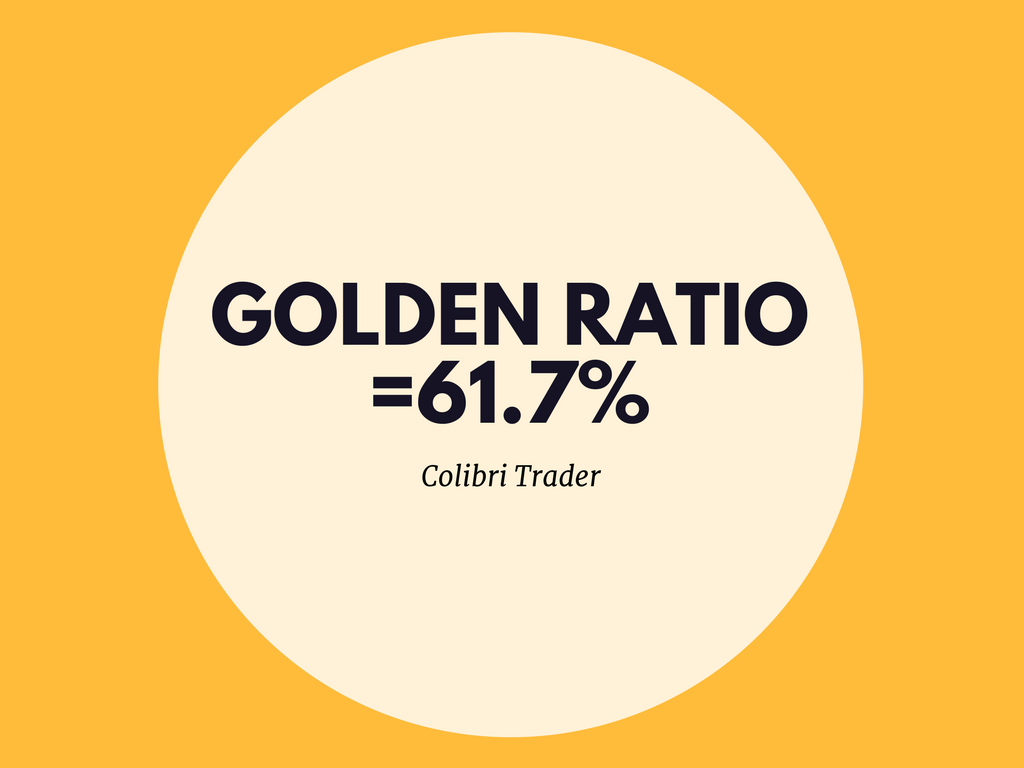 some “unusual” activity around the 61.8% level.
Just look at any currency pair you want. Pick one from the Forex dashboard. Next, drag the Fibonacci retracement. Finally, find the 61.8% level.
If the market can retrace to it, it will have a hard time to break it from the first time. Everyone using Fibonacci’s focuses on the 61.8% level.
Elliott Waves traders use the golden ratio to hunt the most powerful wave in an impulsive move. The 3rd wave.
For this, they wait for a five-wave structure to complete. Furthermore, they wait for a pullback in the 61.8% area and then enter a trade.
As a target, they use the Fibonacci extension of 161.8% of the previous five-wave structure. Again,  without Fibonacci levels, technical analysis would not exist.
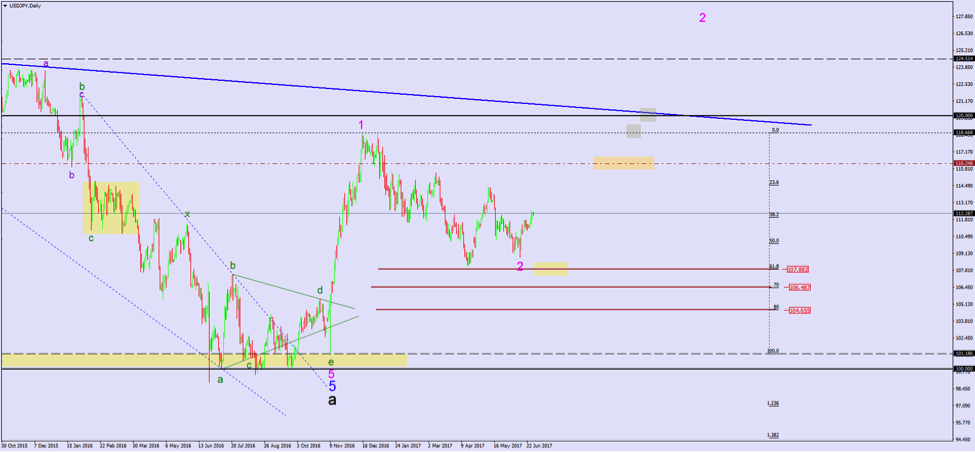
In the chart above, because of it refers to current levels, the USDJPY bounced right from the 61.8% area. Again, bulls respected the golden ratio.
The first assumption is that the 3rd wave in an impulsive move will follow. Because traders don’t know for a fact if the 2nd wave ended here, they look for the possibility of the 2nd wave to form a running correction.
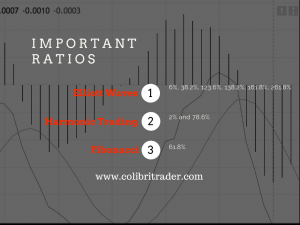
Only when the price moves much higher and the structure unveils, they’ll know the correct count. Yet, the golden ratio gave a nice bounce for the short to medium-term traders.Besides the golden ratio and its derived levels, other levels have important meanings in different trading theories:
- 6%, 38.2%, 123.6%, 138.2%, 161.8% and 261.8% in Elliott Waves Theory;
- 2% and 78.6% in harmonic trading.
How to Draw the Fibonacci Retracement Tool
One of the major problems traders face is not knowing how to drag the Fibonacci retracement tool. This matters, because:
Important: The main use of a Fibonacci level is to find important support and resistance levels.
The key comes from the technical approach used. Look at the previous chart. The Fibonacci tool isn’t dragged from top to bottom. Yet, the 61.8% area proves to be correct. How come?
The answer comes from the Elliott Waves Theory rules: drag the Fibonacci tool from the start of a move until its end.
However, there’s a catch. The end of a wave is not always its lowest or highest point. Hence, the derived Fibonacci levels differ.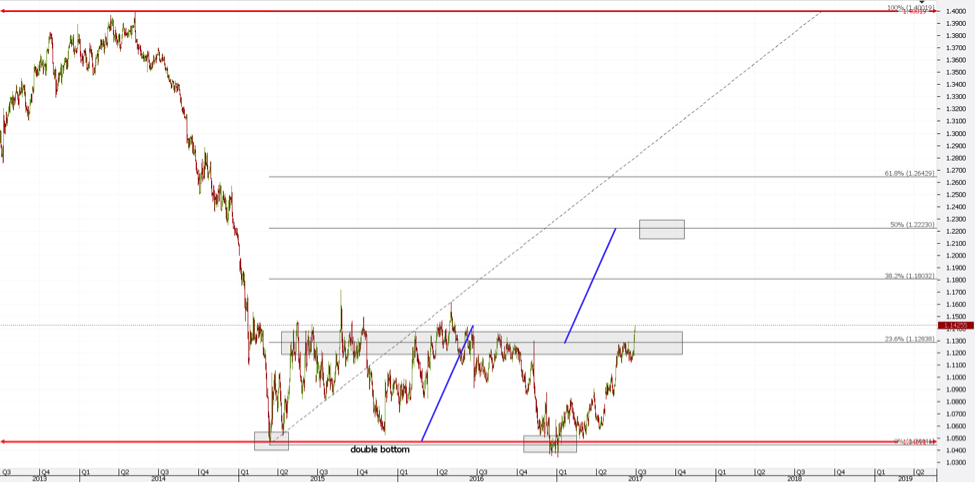
A similar example comes from the EURUSD daily chart. Note that this chart is zoomed out, so the actual time frame is even bigger.
The drop you see on the left side of it started from the 1.40 level. The ECB (European Central Bank) just announced it will cut rates to fight inflation.
As such, Euro bears sold the common currency in a frenzy. For whatever the reason, after an almost four-thousand pip fall, the pair bounced.
How do we know the bounce is for real? It reached the 23.6% level. And, it was rejected.
This validates the way to drag the Fibonacci tool. However, after the first rejection, the price tried again for the 23.6% level.
As a rule of thumb, the more it tests it, the bigger the chances it will break it.
Side Note: Don’t use any level more than two times for a trade in the same direction.
Next, traders focus on finding other clues to help with the new direction. In this case, the EURUSD formed a possible double bottom and now broke the 23.6% retracement level.
Look for Confluence Areas
In the previous chart, the double bottom’s measured move points to the 50% retracement level. Obviously, until then, the 38.2% may act the same way the 23.6% did.
A confluence area has two meanings. One is to look for different Fibonacci levels to form around the same place. Everyone knows that.
However, another one is to look for different currency pair to point to the same scenario/direction. In doing that, traders favour alternation between the confirmation factors.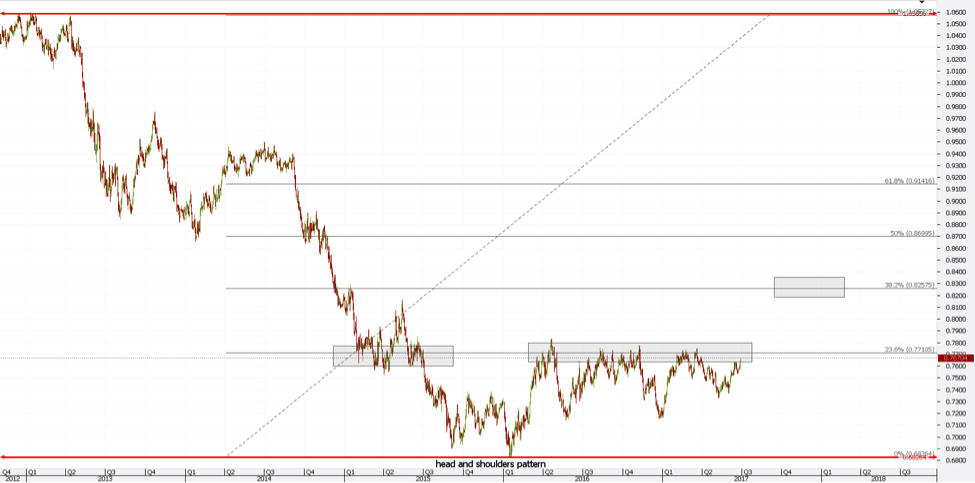
Above is the AUDUSD daily chart. The moment Governor Stevens said the Aussie dollar is overvalued against its American counterpart, the AUDUSD pair collapsed.
Using the same logic like in the EURUSD case, the pair found a bottom and jumped to the 23.6% level. Moreover, in doing that, it formed a head and shoulders pattern.
That’s the alternation in patterns: double bottom in the first case, head and shoulders in the second one. It is like the market screams in your face the two pairs want to move to the next Fibonacci level.
Conclusion
The examples used here have the purpose of showing a few ways to use the Fibonacci tools. Because the retracement tool is the one used in most trading theories and concepts, we focused on it.
However, especially in the Elliott Waves Theory, things go from simple to complicated in a blink of an eye. Complex retracement and expansion levels confirm a pattern or not.
They only come to confirm the importance of the Fibonacci sequence in technical analysis.
p.s.
Have you read how traders use Harmonic Trading to analyse the market
or my article based on Two Great Trades I Took and Why (Step-by-Step explanation)
For any questions, please send them directly to me: admin@colibritrader.com or join the rest in the comments below
Great content! Thank you for sharing
Thank you Stephen! Is there anything you would like to learn about that is not talked about yet on my website?
Thanks Stephen! Always my pleasure. What else do you want to read about?
CAN WE DRAW FIB RETREC ON SINGAL CANDLE AND IF YES IS IT WORK INTRADAY TRADING
I would not use it that way, although have seen others using it